
Decline in bank stress likely to continue as interest rates normalize
Bank stress has steadily declined since a series of bank failures in the spring of 2023, based on a review using four key measures common to the bank examination process. Stress rose significantly during the pandemic and again in 2022, when the Federal Reserve began raising interest rates to curb inflation.
While the key measures suggest current levels of stress, that is, conditions that hamper a bank’s resilience to economic adversity, are marginally higher than before the pandemic in 2019, we expect further declines as interest rates normalize.
Watch list indicators detect bank stress
Our four watch list indicators of potential bank stress are:
- High exposure to commercial real estate.
- High reliance on non-core deposits, meaning large time deposits, brokered or foreign deposits.
- Rapid growth in total assets including loans.
- Low levels of equity capital after subtracting mark-to-market losses on both available-for-sale and held-to-maturity securities.
The first three measures are commonplace, prominently used for monitoring banks during the savings and loan crisis in the late 1980s and early 1990s and in the Great Recession in the mid to late 2000s. Historically, banks with high shares of risky commercial real estate lending and less stable deposit funding (lacking the steadiness of checking accounts and certificates of deposit, for example) are more likely to fail than other banks, all else equal. Separately, many fast-growing banks have failed because of poor asset and liability management, as their internal controls and oversight lagged growth in assets.
Mark-to-market security losses weakened tangible common equity
The fourth measure, the adjusted tangible common equity to total assets ratio, has gained prominence since the Fed began raising the fed funds rate in early 2022. Tangible common equity measures what would remain to common shareholders in the event of liquidation.
During the pandemic, a range of fiscal and monetary policies supported households, businesses and markets. Banks flush with new deposits from pandemic stimulus invested in mortgage-backed securities and other fixed-income securities, which are highly sensitive to interest rates. Meanwhile, commercial real estate became a source of potential bank stress.Many banks were surprised when the Fed increased rates by more than 5 percentage points between February 2022 and July 2023. This rapid rise had two important effects. First, it generated large mark-to-mark losses on bank securities holdings. The market value of debt issues such as Treasuries and mortgage-backed securities moves inversely to interest rates; higher interest rates reduce the market value of outstanding debt. These losses in most cases are not reflected in standard regulatory capital measures but are captured by the adjusted tangible common equity ratio.
Second, many bank customers switched to money market funds that paid higher interest rates, resulting in large deposit outflows at banks. These developments set the stage for widespread banking stress and three major regional bank failures in spring 2023 (Silicon Valley Bank, Signature Bank and First Republic Bank).
Indicators draw on quarterly Call Report data
Our four watch list flags were calculated using publicly available data in the quarterly Call Reports filed by banks. These reports contain bank income statements and balance sheets, detailed loan and deposit information, and they track any asset sales and changes in bank capital.
We flagged banks with high commercial real estate concentration risk if either:
- The ratio of non-owner-occupied commercial real estate and construction and land development loans to the sum of Tier 1 capital (broadly, shareholder equity and reserves) and the allowance for credit losses exceeded 600 percent.
- The ratio of construction and land development loans to the sum of Tier 1 capital and allowance for credit losses exceeded 125 percent.
We flagged banks with risky funding if two of the following four limits were breached:
- Uninsured deposits exceeded 50 percent of domestic deposits. (Federal Deposit Insurance Corp. insurance covers $250,000 per depositor per bank.)
- The quarterly change in uninsured deposits exceeded plus or minus 10 percent.
- The non-core funding dependency ratio exceeded 36 percent (the average historical 95th percentile value).
- The quarterly decline in non-maturity deposits, for example checking accounts or money market accounts, exceeded 10 percent of prior-quarter total assets.
We flagged banks’ total asset growth as “risky” if annual total assets grew more than 35 percent, which is the 95th percentile historical growth rate. Finally, a bank was flagged if its adjusted tangible common equity was less than 4.5 percent of total assets. (Specifically, the adjusted measure equals tangible common equity plus tax-adjusted unrealized gains or losses on held-to-maturity securities plus loss reserves minus nonperforming assets minus loans 90 or more days delinquent but still accruing interest.)
Review period spans five years
We look at changes in our four watch list indicators from the first quarter of 2019 to the fourth quarter of 2024, the latest quarter for which we have Call Report data. In line with standard practice, we confine our analysis to national and state member banks, state savings banks, federal savings banks and savings and loan associations.
The number of banks in our sample declines from about 5,300 institutions at the beginning of the period to fewer than 4,500 banks at the end mainly because of small bank closures and consolidations. Even with fewer banks overall, total assets grew by more than 30 percent.
Aggregate decline in bank stress since 2023
The share of banks with at least one watch list flag doubled with the onset of the pandemic in 2020, peaking at just below 30 percent in the first quarter of 2021 (Chart 1).
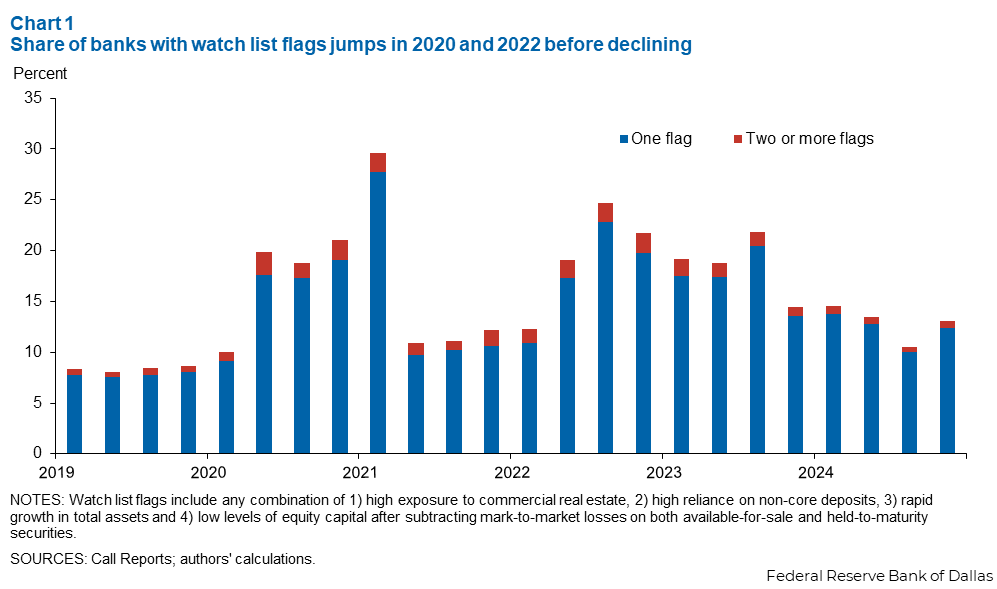
The share sharply declined in the next quarter and was relatively constant before rising again in the second and third quarters of 2022. It fluctuated around 20 percent through the third quarter of 2023. Since then, the share has decreased to 13.1 percent in the fourth quarter of 2024. The share of banks with two or more flags in any period was small, never exceeding 3 percent.
We find a broadly similar, albeit more pronounced, pattern for the share of cumulative total assets exposed to our watch list flags (Chart 2). However, the decline in exposed assets is more notable in 2021, and the increase in 2022 is much larger.
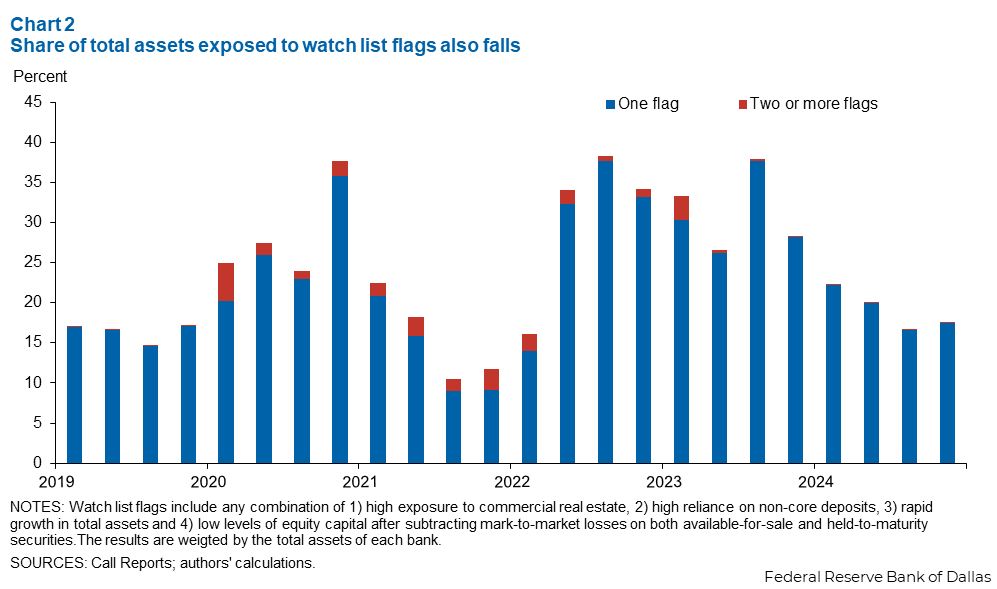
Because fewer banks had flags in more recent periods, the change in the share of total assets exposed to watch list flags suggests that affected banks are larger. The share of total assets held by banks with at least one watch list flag in the most recent period was 17.7 percent.
Largest banks most stressed in fourth quarter 2024
Chart 3 shows changes in the share of total assets, grouped by institution size, exposed to at least one risk flag.
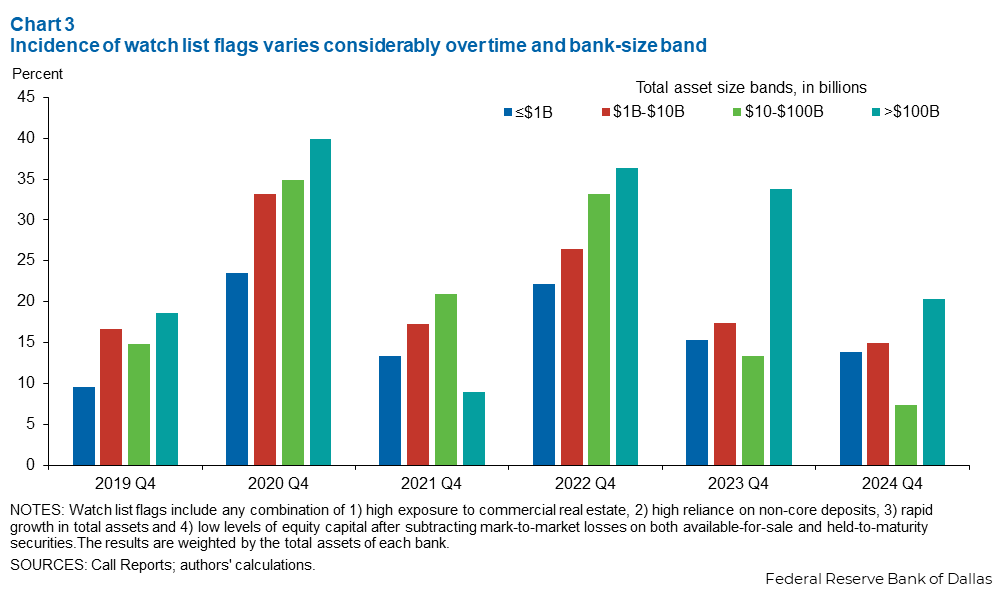
The variation over time and by bank size band stands out. In the fourth quarter of 2024, the largest banks had the largest percentage exposures to the risk indicators. Banks in the smallest and largest size bands have higher percentage exposures than before the pandemic, while banks in the two middle groupings have lower exposures.
Exposure rose dramatically for all groups in 2020 during the pandemic before receding the next year. Exposure rose again with the onset of higher interest rates in 2022 and remained elevated during most of 2023—likely a symptom of the spring banking crisis—before declining.
Low adjusted tangible-common-equity ratio important now
Asset growth was the main driver of potential bank stress during the pandemic, as consumers deposited government relief funds at banks (Chart 4). Nearly 19 percent of banks in our sample grew total assets by more than 35 percent between the fourth quarter of 2019 and the fourth quarter of 2020. One year later, 9 percent of banks still exhibited this rapid expansion.
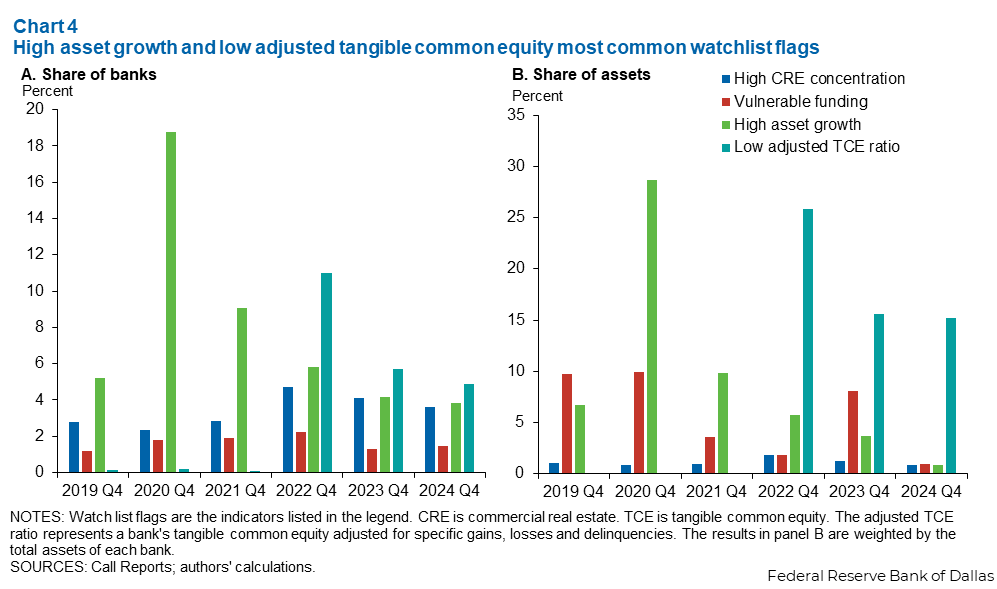
A sharp jump in the share of banks flagged for low adjusted tangible common equity ratios drove the overall increase in bank risk from 2022 onward. This jump reflects the steep rise in interest rates in 2022, which slashed the market value of securities accumulated during the pandemic when banks were flush with cash. The mark-to-market losses significantly reduced the adjusted tangible common equity ratios of banks with large securities holdings.
The share of banks in Chart 4 with high, risky commercial real estate exposure flags is relatively low, in part because banks behaved more cautiously than in the early 2000s. However, these shares are also low because our calculations do not include office building real estate exposure, as Call Reports do not identify such lending.
This is important as most of the deterioration in commercial real estate lending over the last two years has been concentrated in non-prime, downtown offices in major metro areas such as New York and San Francisco. Our takeaway: Risk related to non-office commercial real estate is relatively low in the aggregate.
Declining bank stress in the Dallas Fed district
What do the watch list indicators suggest about the situation in the Federal Reserve Bank of Dallas’s Eleventh District, covering Texas, northern Louisiana and southern New Mexico? To ensure comparability over time, we exclude Charles Schwab and its subsidiary banks and USAA Federal Savings Bank, all of which changed Federal Reserve supervisory districts during the review period.
We see a similar rise and subsequent decline locally and nationally in the percentage exposure to our watch list flags during the pandemic period, as well as much higher exposure around the onset of higher interest rates and the banking crisis (Chart 5). The incidence of two or more risk flags is low and minimal in the latest quarter.
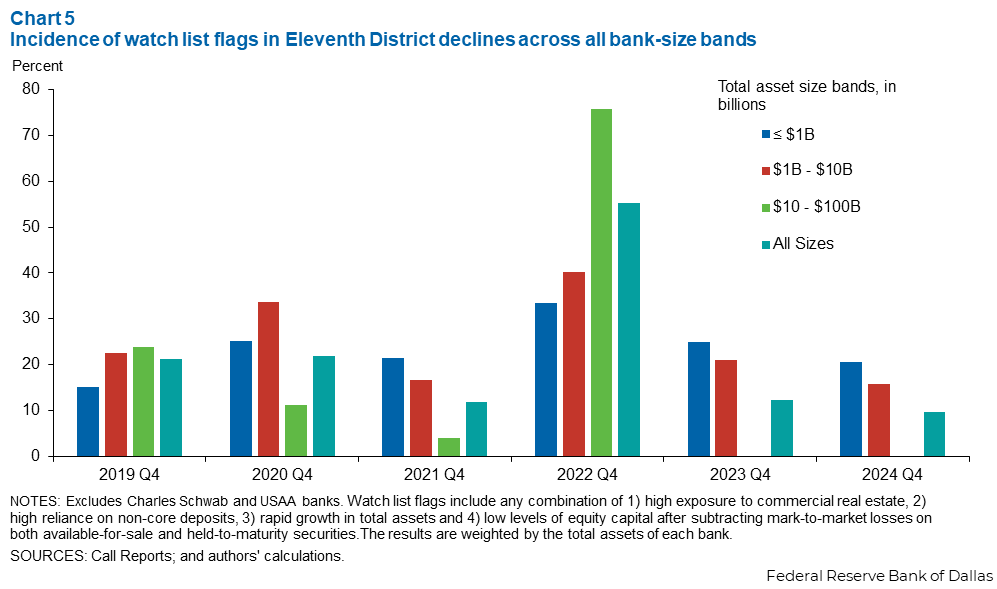
The overall share of assets held by Eleventh District banks, other than Charles Schwab and USAA, with watch list flags, 9.8 percent, is slightly lower than the corresponding national share at the end of 2024, 11.0 percent.
However, the share of assets held by Eleventh District community banks with watch list flags—institutions with less than $10 billion in assets—is greater, 17.3 percent, than their peer-sized banks nationally, 14.6 percent, because the district banks have high commercial real estate concentrations and low adjusted tangible common equity ratio flags.
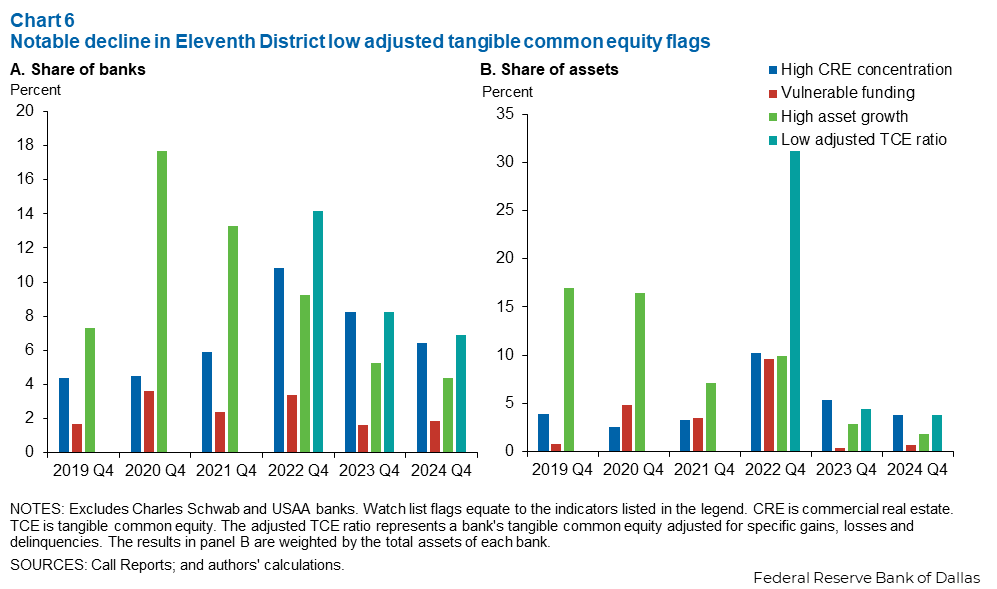
Particularly notable is the dramatic decline in the incidence of low adjusted tangible common equity ratio flags (expressed as a share of total assets) in the Eleventh District (Chart 6). It peaked at more than 36 percent in the third quarter of 2022 but was 3.8 percent at year-end 2024.
Declining stress anticipated
The level of overall bank stress nationally and in the Eleventh District has declined significantly since 2023, although overall it remains somewhat elevated relative to prepandemic levels. Given that bank stress has decreased under the so-called higher-for-longer regime of ongoing, relatively high interest rates, further declines are likely as interest rates fall.
About the authors

Anthony Murphy is a vice president in the Research Department of the Federal Reserve Bank of Dallas.

Ben Munyan is director of the Supervisory Policy Department and a senior economist at the Federal Reserve Bank of Dallas.

Dylan Ryfe is a research analyst in the Research Department at the Federal Reserve Bank of Dallas.