Eleventh District Banking Trends
Fourth Quarter 2025
This report tracks the financial performance of Eleventh District banks in comparison with national averages, looking at profitability, loans, deposits and other key metrics. It is updated quarterly.
Highlights
- Banking conditions remained satisfactory through fourth quarter 2025.
- Profitability declined for Eleventh District banks on lower noninterest income and higher noninterest expense.
- Asset quality metrics remained relatively benign, although troubled commercial real estate loans led to a slight increase in the Eleventh District bank noncurrent loan rate.
- Loan growth picked up, and the decline in Eleventh District bank consumer loans slowed.
- Deposits and Federal Home Loan Bank advances, as well as other funding sources, were stable.
- Equity capital ratios were also unchanged, as lower unrealized losses on available-for-sale securities offset a decline in retained earnings.
Charts
Select a metric to go directly to the related chart below.
Return on average assets
- Eleventh District banks earned a return on average assets (ROAA) of 1.35 percent in fourth quarter 2025, 4 basis points (bps) lower than third quarter 2025 but 10 bps higher than fourth quarter 2024.
- The ROAA for U.S. banks was 1.26 percent in fourth quarter 2025, up 5 bps from the previous quarter and 20 bps from a year ago.

Net income breakdown
- Lower noninterest income and higher noninterest expense led to a decline in Eleventh District bank profitability in fourth quarter 2025.
- Much of the higher profitability for Eleventh District banks relative to U.S. peers can be attributed to lower provision expenses.

Net interest margins
- Net interest margins (NIMs) increased in fourth quarter 2025 as declines in interest expense outpaced declines in interest income.
- Eleventh District bank NIM was 3.68 percent in fourth quarter 2025, up 1 bp quarter-over-quarter and 26 bps year-over-year.
- U.S. banks’ NIM was 3.77 percent in fourth quarter 2025, 6 bps higher than the previous quarter and 27 bps higher than a year ago.

Provision expense
- Provision expense for Eleventh District banks has trended below that of their U.S. peers since late 2021.
- For fourth quarter 2025, Eleventh District bank provision expense relative to average assets was 0.14 percent, 10 bps lower than the national value.

Net loan losses
- The net charge-off rate for Eleventh District banks has trended below that of U.S. peers since 2020.
- The Eleventh District bank net charge-off rate declined 1 bps in fourth quarter 2025 to 0.21 percent, while the U.S. bank net charge-off rate increased 4 bps to 0.35 percent.

Net charge-offs by loan type

Noncurrent loans
- The Eleventh District bank noncurrent loan rate has consistently trended below U.S. peers.
- In fourth quarter 2025, the Eleventh District bank noncurrent loan rate was 0.80 percent, up 5 bps from the previous quarter and 6 bps from a year ago.
- The rate for U.S. banks was 0.96 percent, up 2 bps from third quarter 2025 and 12 bps from a year ago.

Noncurrent loans by type

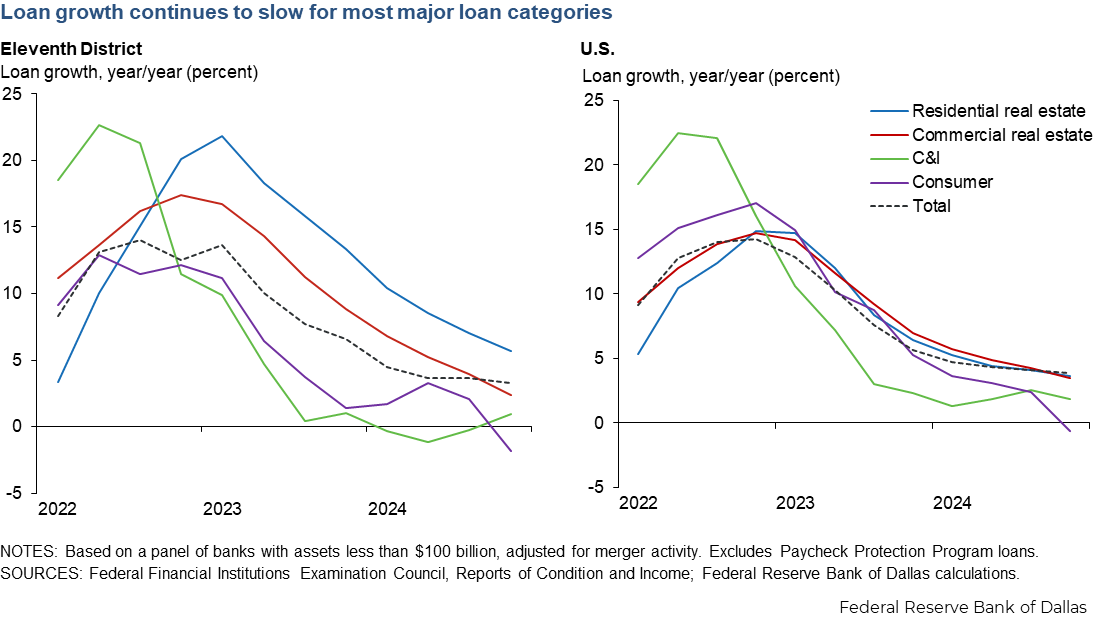
Loan growth
- Loan growth picked up slightly in fourth quarter 2025.
- For Eleventh District banks, loan growth for the one-year period ended Dec. 31 was 4.07 percent, up from 3.91 percent the previous quarter, as the decline in consumer loans slowed.

Loan growth by type
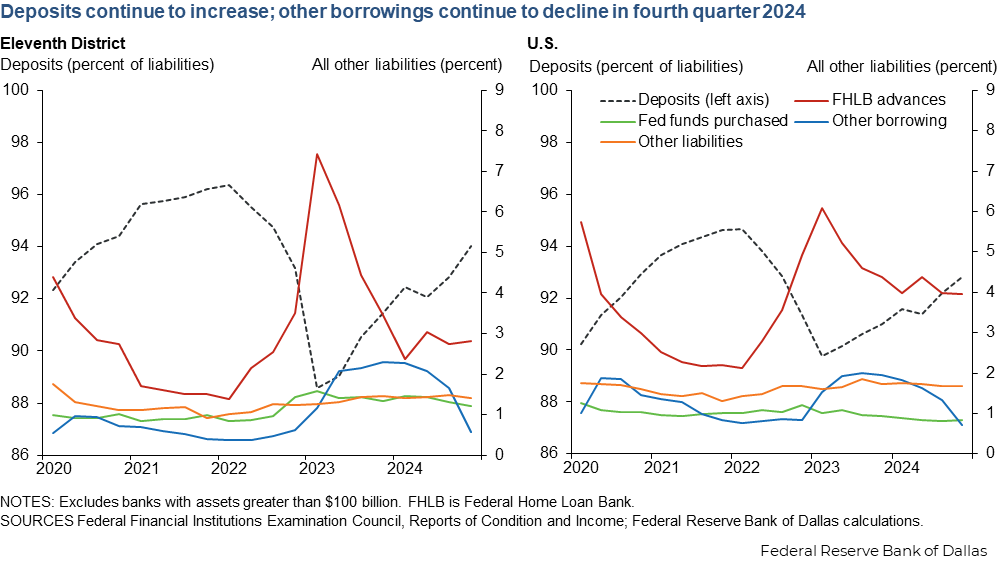
Funding mix
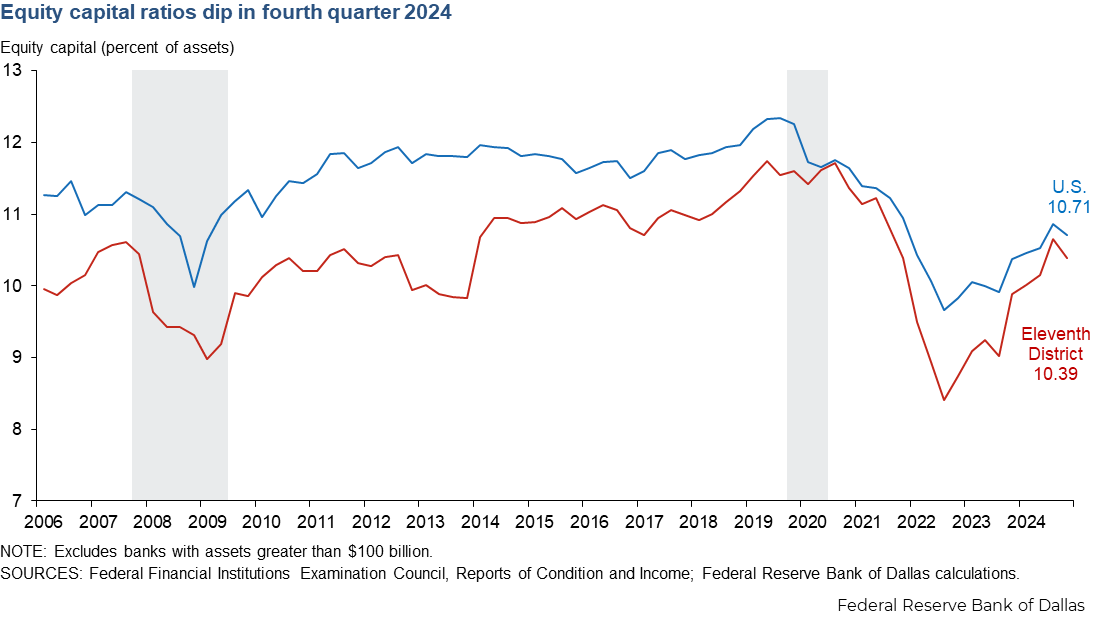
Equity capital ratios
- Equity capital ratios were unchanged in fourth quarter 2025 as lower unrealized losses on available-for-sale securities offset a decline in retained earnings.
- The Eleventh District bank equity capital ratio was stable at 11.08 percent in fourth quarter 2025, and the U.S. bank equity capital ratio remained at 11.26 percent.
NOTES: Analysis excludes banks with assets greater than $100 billion (one bank in the Eleventh District and 33 banks nationwide).
The Eleventh Federal Reserve District includes Texas, northern Louisiana and southern New Mexico. Banks headquartered in the Eleventh District may also operate elsewhere.
About Eleventh District Banking Trends
For more information about this report, contact Emily Greenwald.