Evidence suggests U.S. house price/rent ratio, real home prices to decline
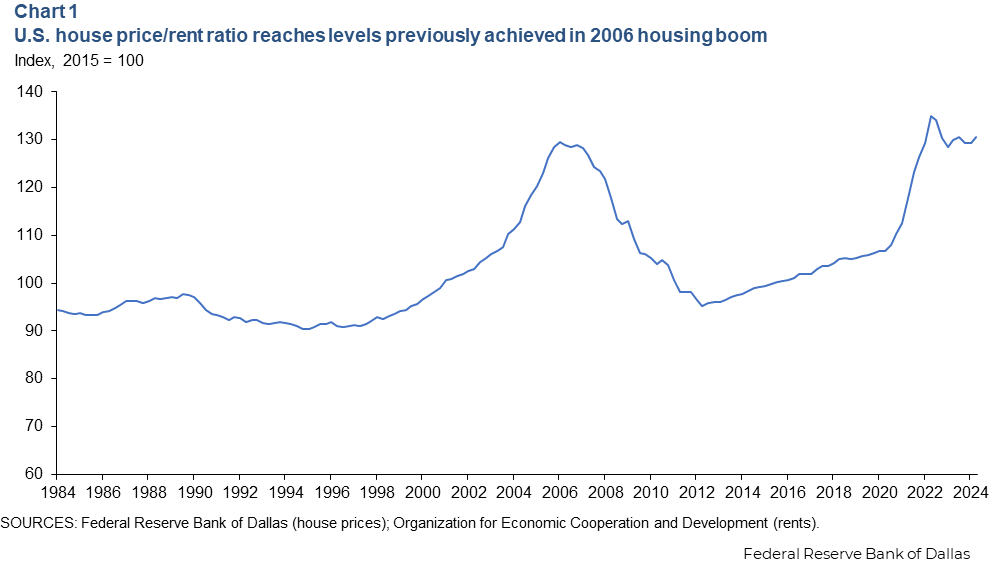
The ratio of house prices to rents in the U.S. has risen 20 percent since first quarter 2020, coinciding with the beginning of the pandemic. The ratio is near its previous high in 2006 (Chart 1).
The future course of inflation may well be influenced by how this now-lofty ratio reverts to a more usual level.
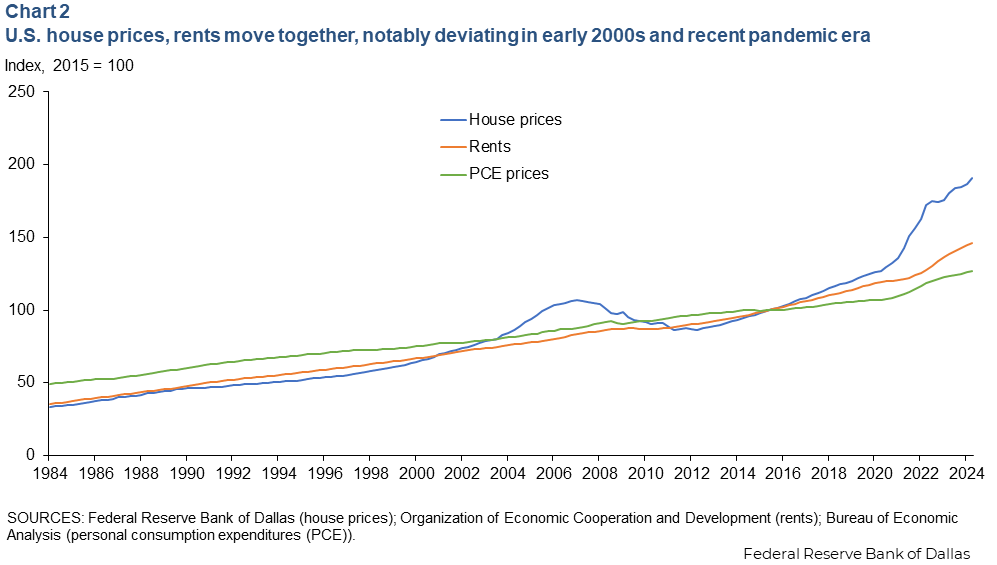
U.S. house prices and rents are generally closely aligned, with only two significant deviations since 1984—in the early 2000s and following the pandemic. The rent index is fairly smooth and closely tracks the personal consumption expenditures (PCE) price index, with rents growing a little faster than overall inflation (Chart 2). Divergence between house prices and rents in the early 2000s and again in the recent period followed a significant increase in real (inflation-adjusted) house prices and stable real rents.
Housing, rents and owner-occupied equivalent rents (the amount of a homeowner’s outlays required to rent equivalent housing), make up 16 percent of headline PCE inflation (the Federal Reserve’s preferred measure) and nearly one-third of Consumer Price Index (CPI) inflation.
House prices do not directly impact inflation. Rather, it’s an indirect effect. The Bureau of Labor Statistics estimates homeowner equivalent rent based on the market rent for similar houses. Thus, the housing component of inflation is closely tied to market rents in the economy.
Rent increases accelerated following the pandemic, although not as sharply as house prices. The housing component of PCE inflation peaked at around 8.3 percent year over year in early 2023. It has since steadily fallen.
If this divergence between house prices and rents is resolved through larger rent increases, the housing component of inflation would follow suit and rise. Since the ratio is a fraction, it can become smaller by decreasing the numerator (home prices) or increasing the denominator (rents).
To access the risk of such a pick-up, we can look to past episodes where the house price/rent ratio deviated from its historical level.
Home prices rose rapidly during the early 2000s
An increase and subsequent fall in real house prices drove the misalignment between house prices and rents in the early 2000s. Real rents were steady during this time.
Chart 3 plots the PCE price index, the rent index, the U.S. house-price index and the ratio of the housing and rent price indexes spanning the 20 quarters before and after third quarter 2006.
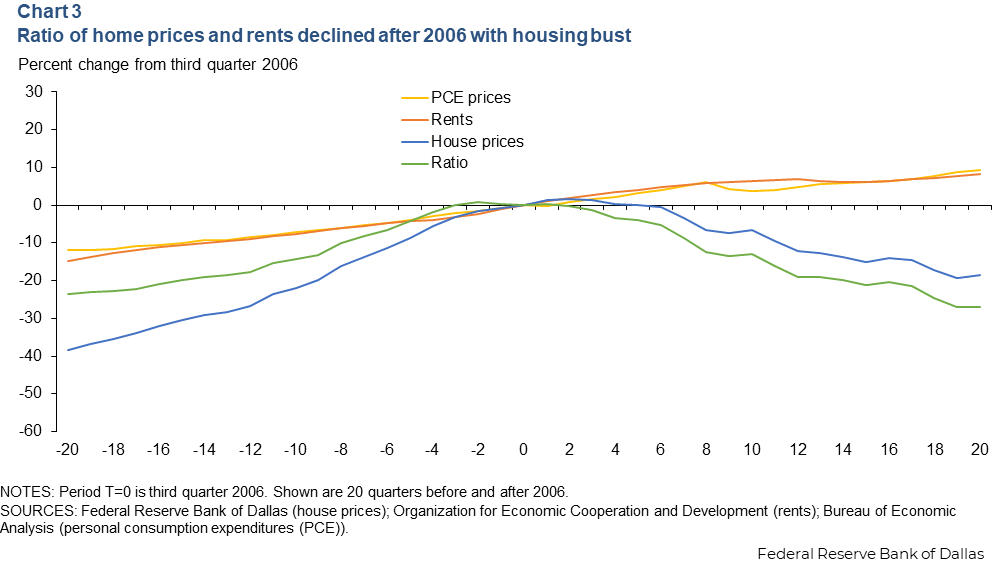
Rising real home prices drove the increase in the house price/rent ratio before 2006. Rents grew right along with PCE inflation over these years, with house prices rising far faster than overall inflation.
The U.S house price/rent ratio peaked in late 2006 and within two years had fallen by more than 10 percent. Within four years, it declined by more than 20 percent. This was accomplished through sharply lower real house prices. The rent index rose with the PCE price index, but nominal (noninflation-adjusted) house-price growth stalled after 2006 and turned negative after 2008.
The only example of a sustained fall in the house price/rent ratio in the U.S. data was in 2006. Two years after this ratio started declining, there was a global recession and financial crisis that depressed housing and asset prices. It’s unclear whether these patterns from 2006 will hold today.
Examining past episodes of sustained declines in the house price/rent ratio in foreign economies may provide insight into the future course of the relationship in the U.S.
International house price/rent movements provide clues
Drawing upon the Federal Reserve Bank of Dallas’ International House Price Database, along with data on rents from the Organization for Economic Cooperation and Development, we can construct a quarterly time series of house price/rent ratios for 18 foreign advanced economies.
Chart 4 plots the percentage change in the house price/rent ratio for the U.S. and 18 advanced foreign economies from first quarter 2020 to second quarter 2022 and, separately, from second quarter 2022 to second quarter 2024.
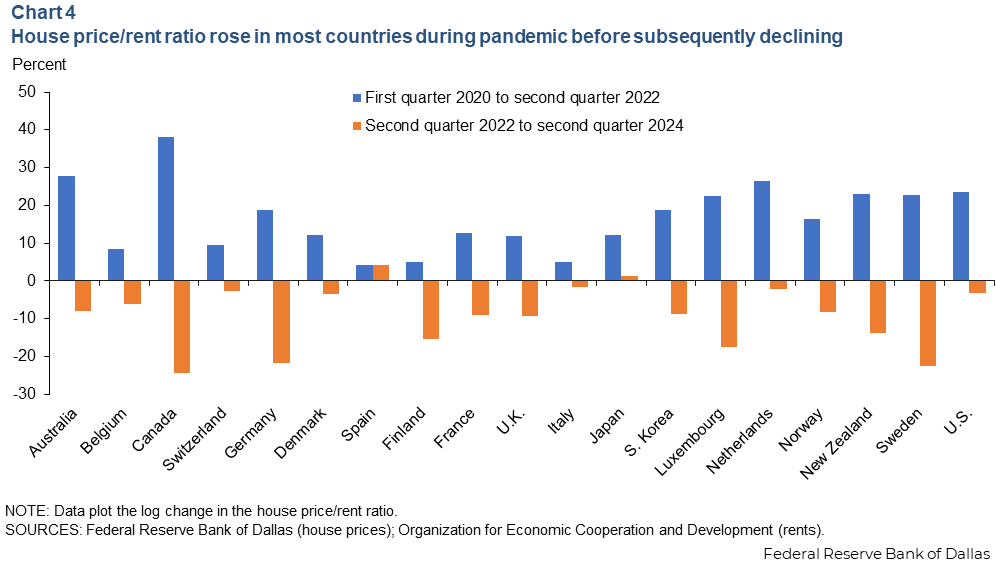
All advanced foreign economies experienced an increase in this ratio in the two years after the pandemic’s onset in 2020, and in many of them, the increase was equal to or exceeded the 20 percent rise in the U.S. A significant decline occurred in most (but not all) over the past two years.
On average, across 18 advanced foreign economies, the house price/rent ratio rose by about 16 percent in those first two years and has since declined about 10 percent. The U.S. ratio has fallen 3 percent since 2022.
Why did this pattern emerge on such a widespread scale? Did real house prices fall or did real rents increase?
On average across the 18 advanced foreign economies from second quarter 2022 to second quarter 2024, house prices fell 3 percent, while rents rose 7 percent, and CPI inflation climbed 8 percent.
Thus, the recent pattern in these advanced foreign economies is similar to what we see in the U.S. in post-2006: Rents rise along with inflation, while nominal house-price growth trails inflation. On an inflation-adjusted basis, rents change very little, but house prices fall sharply.
We can also turn away from the pandemic-era rise and fall in the price/rent ratio and instead look to international historical episodes of a fall in the price/rent ratio. We can define an episode as at least a 10 percent price/rent ratio decline over two years. Period T=0 in the episode is the initial quarter in which the decline in the price/rent ratio over the next eight quarters exceeds 10 percent. (Using this definition, T=0 for the early 2000s’ episode in the U.S. is third quarter 2006.)
With this definition of a sustained house price/rent decline, we identify 29 separate episodes in these 18 foreign advanced economies over the 1984–2019 period and plot the median response (Chart 5).
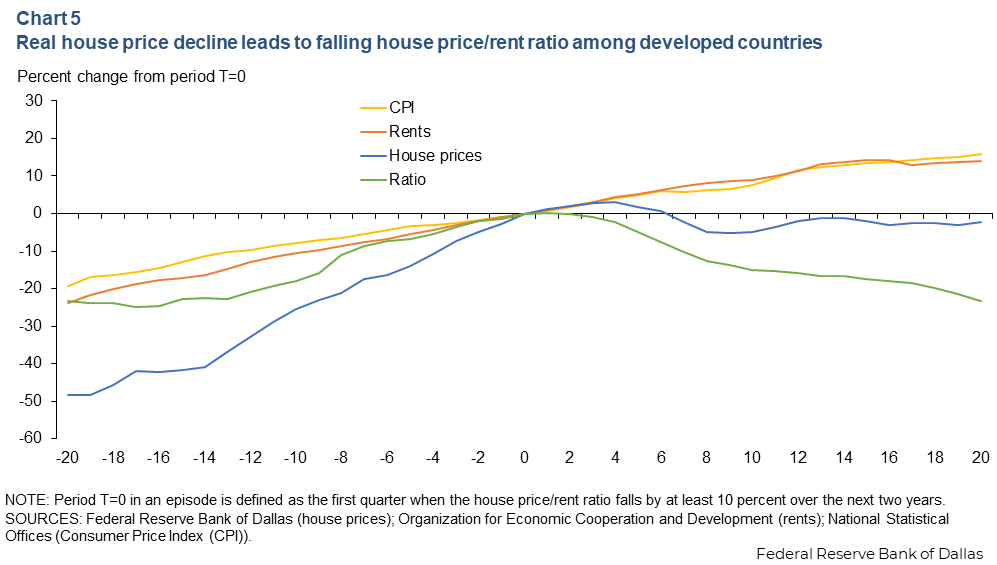
The path of house prices and rents around these 29 international episodes is similar to what we see in the U.S. Rents closely track overall inflation, with a sharp rise in real house prices in the years before the house price/rent ratio peaked.
Rents continued to rise along with the price index after the ratio started to fall, but nominal house-price growth stalled. Thus, real house prices fell. If U.S. house prices and rents follow this typical pattern, normalization of the price/rent ratio can occur without rents increasing.
About the author

