Strong U.S. employment driven by sectors less sensitive to business cycles
The U.S. has enjoyed strong payroll job gains in the past couple of years despite generally restrictive monetary policy. The sectoral composition of employment reveals job growth has been concentrated in areas that are the least sensitive to national employment fluctuations over the business cycle. Gains in sectors that are the most sensitive to the cyclical nature of national employment have slowed.
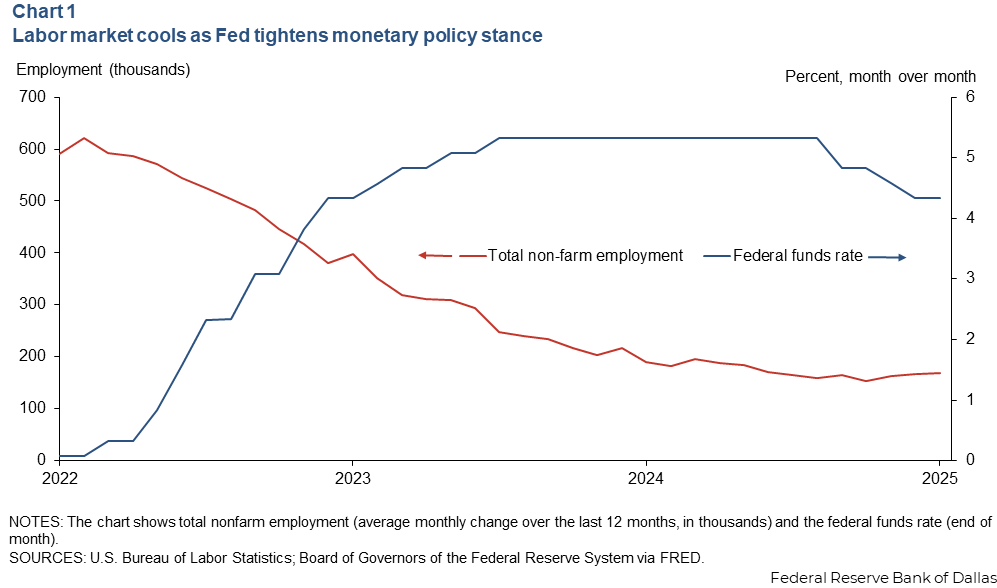
After inflation increased in 2021, the Federal Open Market Committee (FOMC) began increasing its policy rate in March 2022. The effective federal funds rate rose from near zero before the FOMC met in March 2022 to 5.33 percent following the July 2023 meeting. It remained at this elevated level through August 2024 but has since eased (Chart 1).
The effective federal funds rate remains above the median FOMC participant’s estimate of the longer-run policy rate needed to fulfill the Federal Reserve mandate of price stability and maximum employment.
Amid a tighter monetary policy stance, the labor market cooled, and total nonfarm employment growth slowed but remained strong. Average monthly job gains were 240,000 from March 2022 to August 2024, above the prepandemic monthly average of 190,000 jobs from January 2015 through December 2019. Average monthly job growth slowed since September 2024 to 199,000, still above the prepandemic level.
The strong employment growth relative to prepandemic levels, despite a tight monetary policy stance, poses a bit of a puzzle. The sectoral decomposition of employment growth may offer a clue. Employment growth showed a marked slowdown during the tightening cycle within the most cyclically sensitive sectors as expected, but growth was unusually strong in the least cyclically sensitive sectors.
How sectoral cyclical sensitivity relates to employment fluctuations
Not all sectors are equal. Some parts of the economy, such as manufacturing, have more cyclical employment than others, for example, the government. There are many reasons for differences in sectoral sensitivity to the business cycle and for varying effects of monetary policy on employment across individual sectors. For example, changes in borrowing costs will affect housing demand and construction employment more than education jobs.
In the stock market, individual stocks can be characterized as aggressive or defensive based on their co-movement with an aggregate stock portfolio. Similarly, we estimate a sector-level employment cyclical sensitivity score relative to fluctuations in national employment. We use monthly data on 35 sectors since 1990. Our model defines a sensitivity coefficient as the long-run multiplier from an autoregressive distributed lag model of sectoral employment growth on national employment growth.
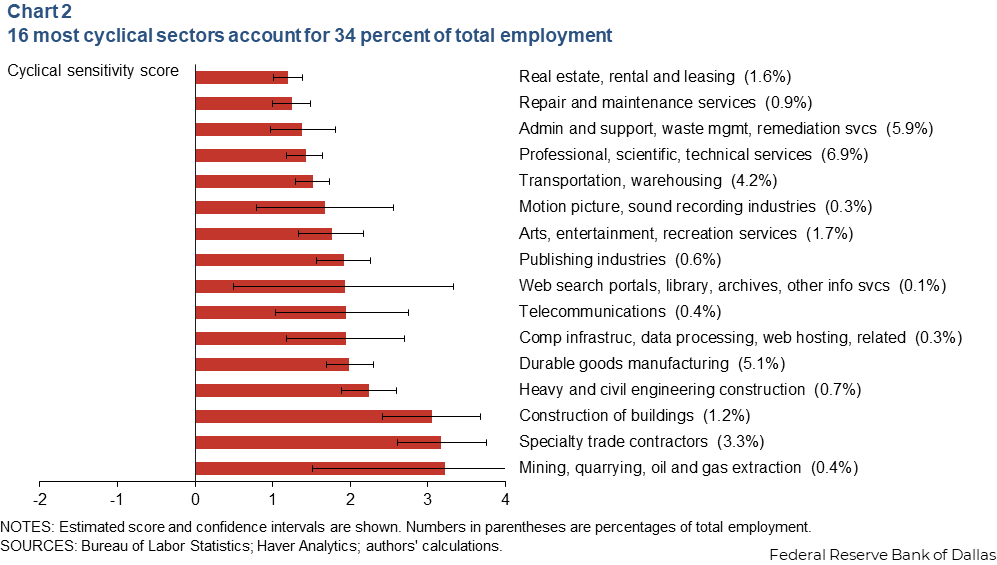
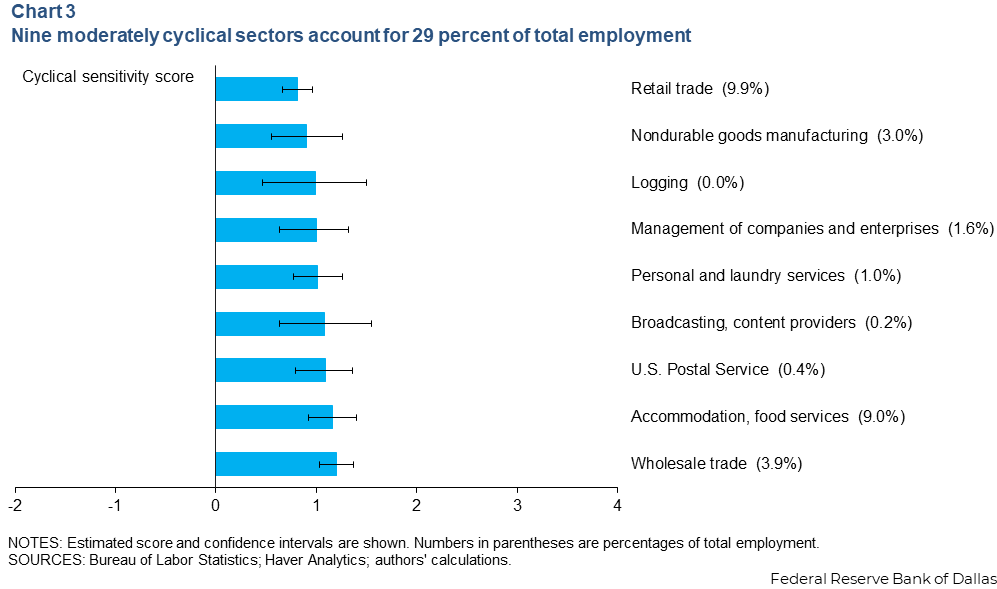
We classify the sectors into three groups: most cyclical, with a score above 1.2, moderately cyclical, with a score of 0.8 and 1.2, and least cyclical, with a score less than 0.8. Thus, the most cyclical sectors have larger movements up and down than the national business cycle. Moderately cyclical industries are almost on par with national employment fluctuations, and low-cyclical sectors are less sensitive. Each group comprises about one third of the total employment.
Mining, specialty trade contractors, construction and durable goods manufacturing are among the most cyclical sectors (Chart 2).
Trade (wholesale and retail) and non-durable goods manufacturing are among the moderately cyclical sectors (Chart 3).
The least cyclical sectors include educational services (state and private), health care, government (state and local) and utilities (Chart 4).
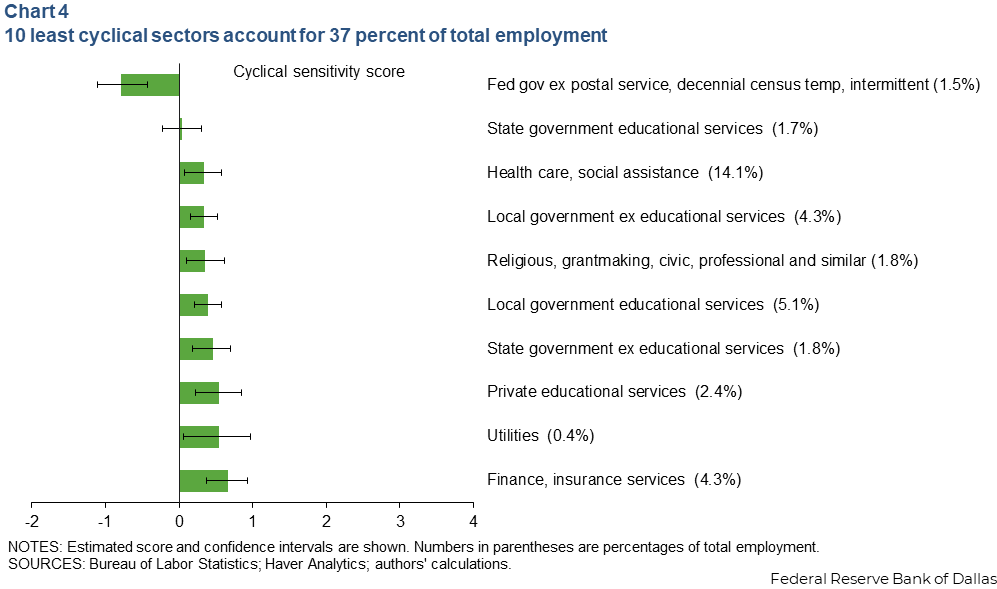
Interestingly, federal employment (excluding the U.S. Postal Service) stands out as the only sector with a negative cyclicality score. Thus, it is the only counter-cyclical sector in the economy, meaning federal employment typically moves in the opposite direction of national employment during the business cycle.
Least cyclical sectors contributed to strong employment growth
Monthly employment growth totaled 190,000 jobs on average from 2015 through 2019, with contributions to job growth spread across the three categories of sector cyclical sensitivity (Chart 5).
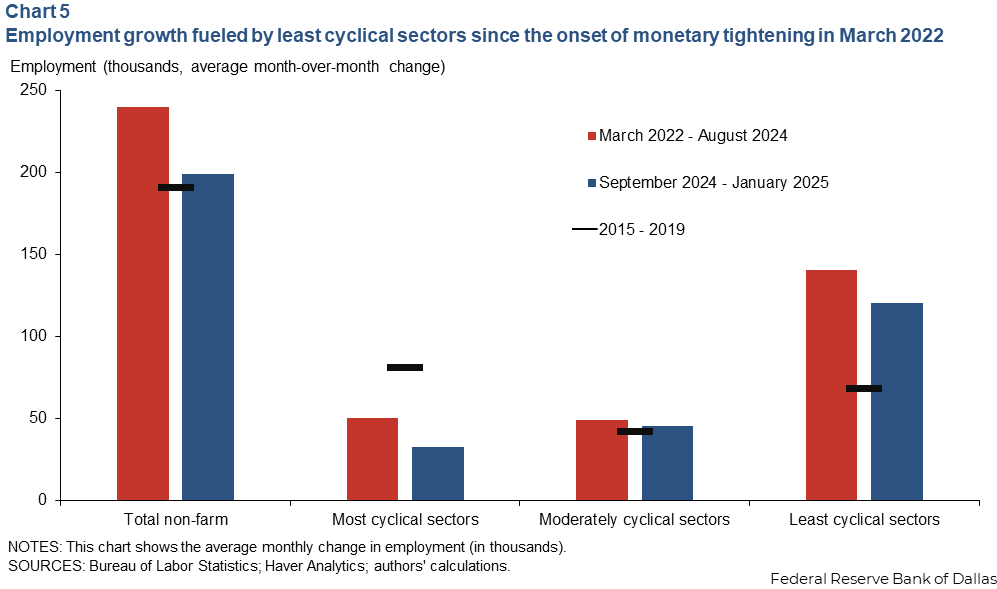
The most cyclically sensitive sectors in the prepandemic period provided 42 percent of average job gains, while the least cyclically sensitive sectors provided 36 percent. The remaining 22 percent of jobs came from moderately cyclical sectors.
Since the start of the most recent policy tightening cycle in March 2022, monthly gains have averaged 234,000 jobs. Given the restrictive stance of policy, one would expect economic activity to slow and the labor market to cool. This is the employment growth pattern for the most cyclically sensitive sectors, with job gains well below the prepandemic average.
For moderately cyclical sectors, job gains have approached the prepandemic average. By comparison, job gains in the least cyclically sensitive sectors have outpaced average prepandemic job growth over the past three years.
Health care employment leads less-cyclical growth
Looking under the hood of the strong national employment performance shows employment growth in sectors that are historically more sensitive to business-cycle fluctuations has indeed slowed down considerably since the onset of the current cycle of elevated interest rates.
On the other hand, employment growth in sectors that historically do not co-move strongly with the business cycle has been very notable. One of the reasons for such strong job growth is hiring in the health care sector, where employment has been catching up with its prepandemic trend.
About the authors

Alexander Chudik is an assistant vice president in the Research Department at the Federal Reserve Bank of Dallas.

Ron Mau is a senior business economist at the Federal Reserve Bank of Dallas.