
Texas Service Sector Outlook Survey
Growth decelerates in Texas service sector as company outlooks worsen
For this month’s survey, Texas business executives were asked supplemental questions on wages, prices, outlook concerns and government spending. Results for these questions from the Texas Manufacturing Outlook Survey, Texas Service Sector Outlook Survey and Texas Retail Outlook Survey have been released together. Read the special questions results.
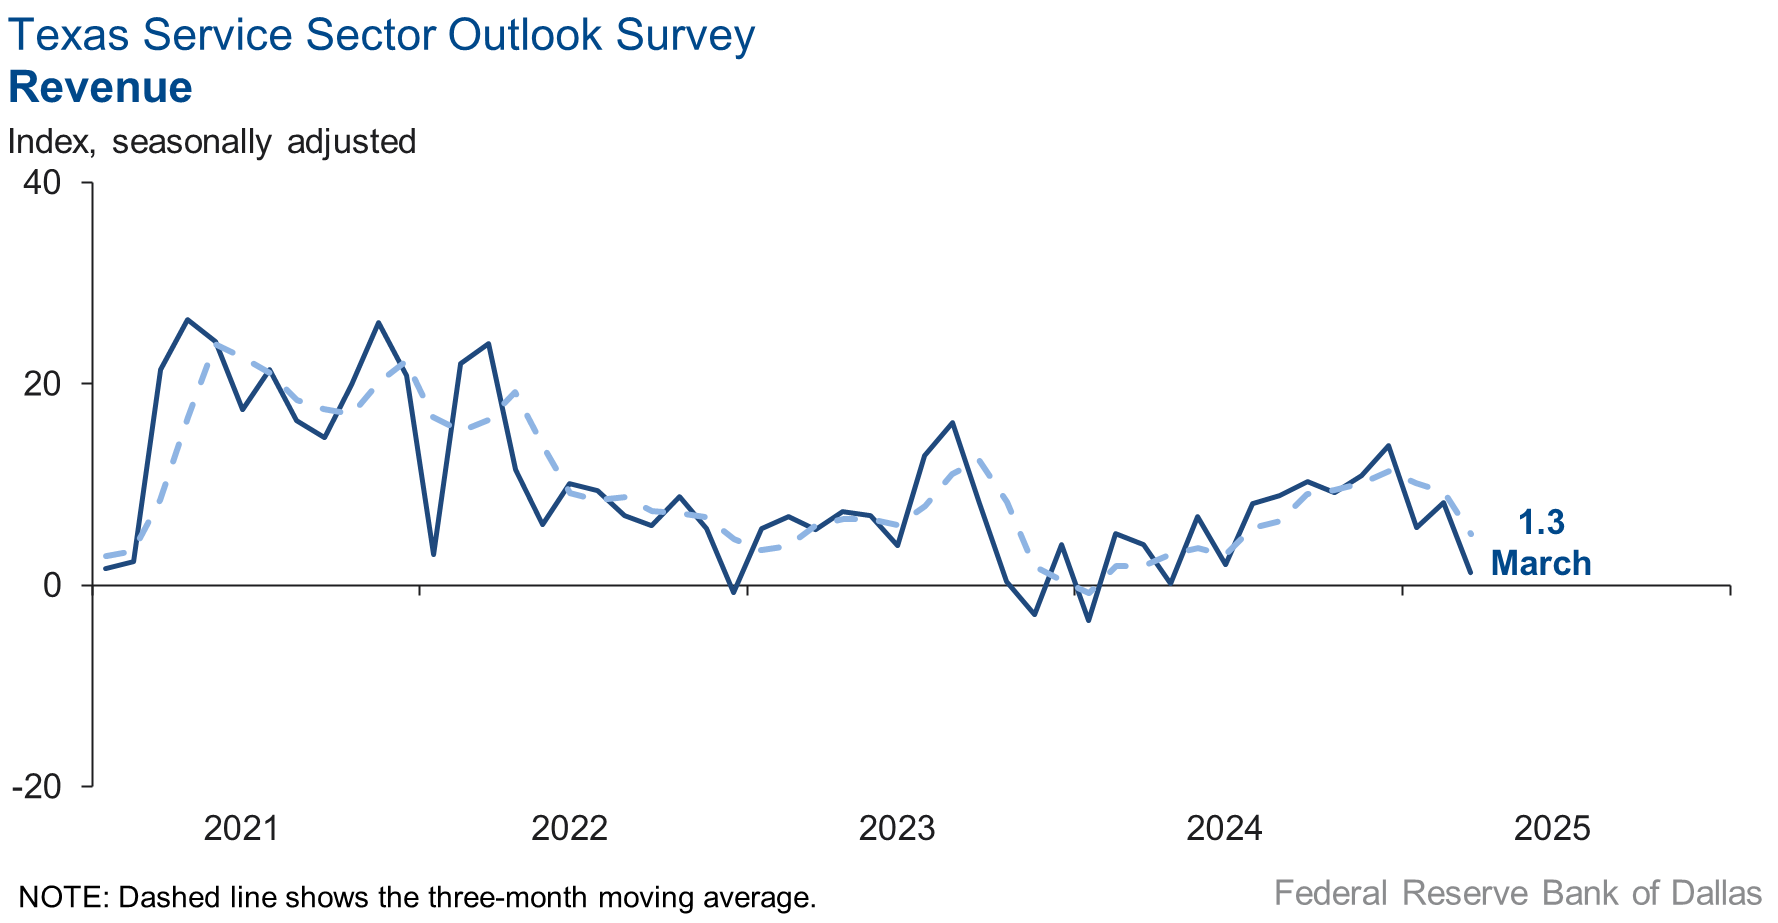
Texas service sector activity stalled in March, according to business executives responding to the Texas Service Sector Outlook Survey. The revenue index, a key measure of state service sector conditions, fell seven points to 1.3, with the near-zero reading indicating flat revenue.
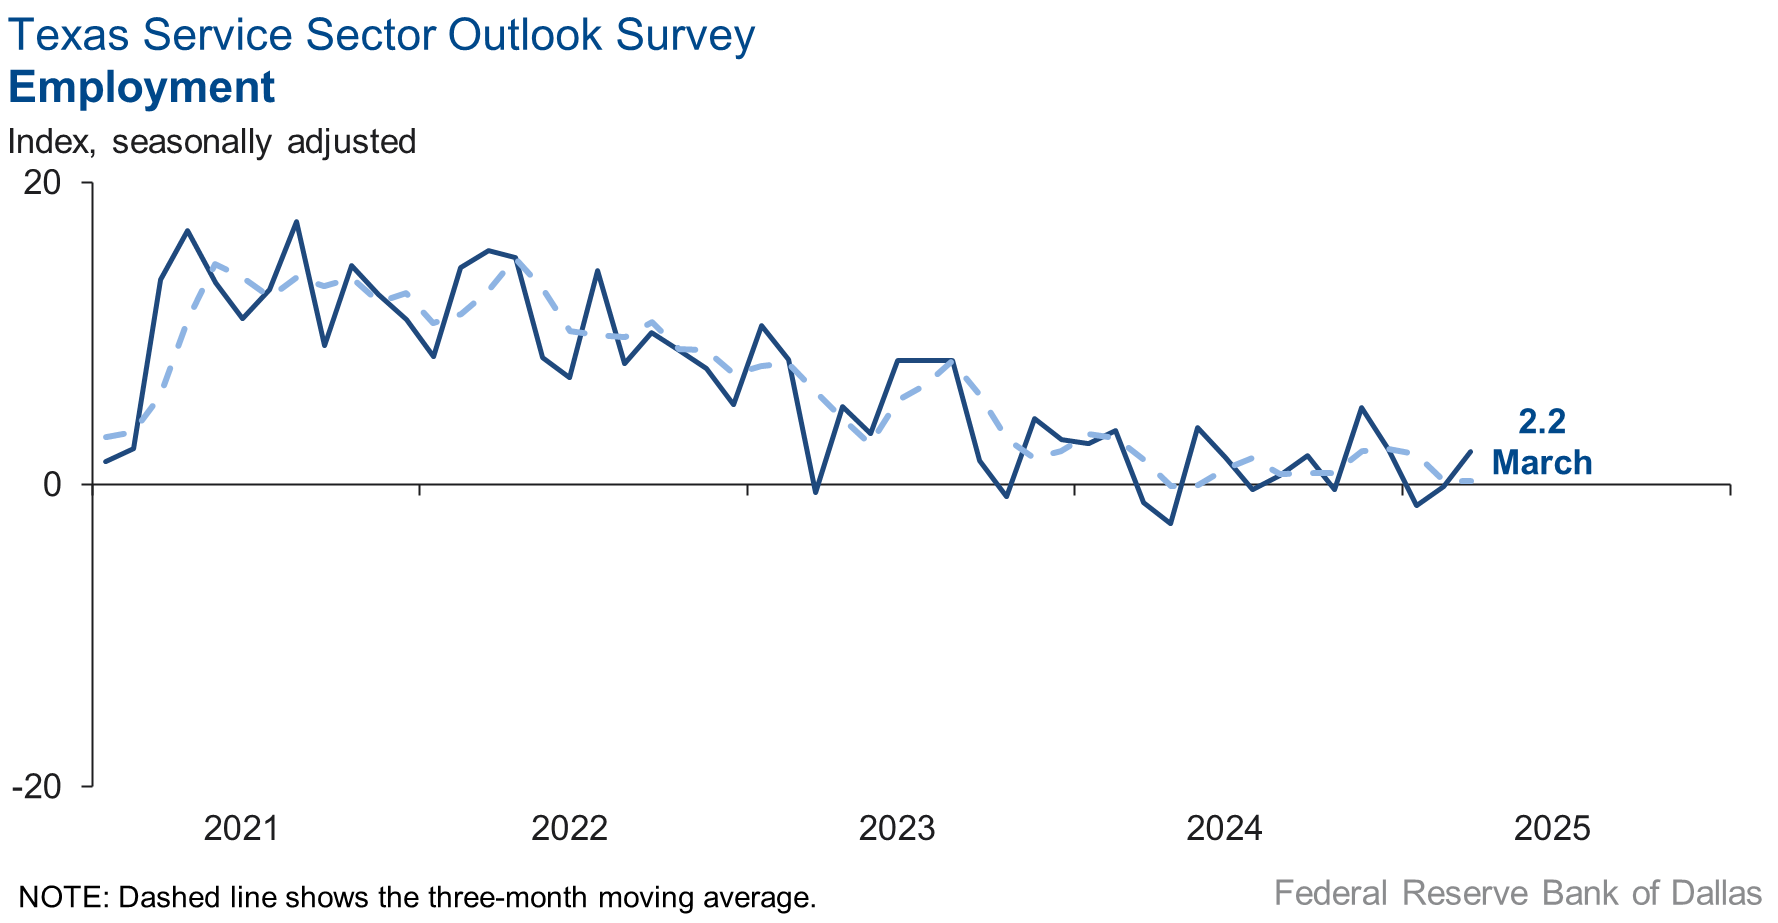
Labor market measures suggested a slight increase in employment in March, but no change in workweeks. The employment index edged up to 2.2 from -0.1. The part-time employment index fell three points to -1.7, while the hours-worked index increased two points to 0.8.
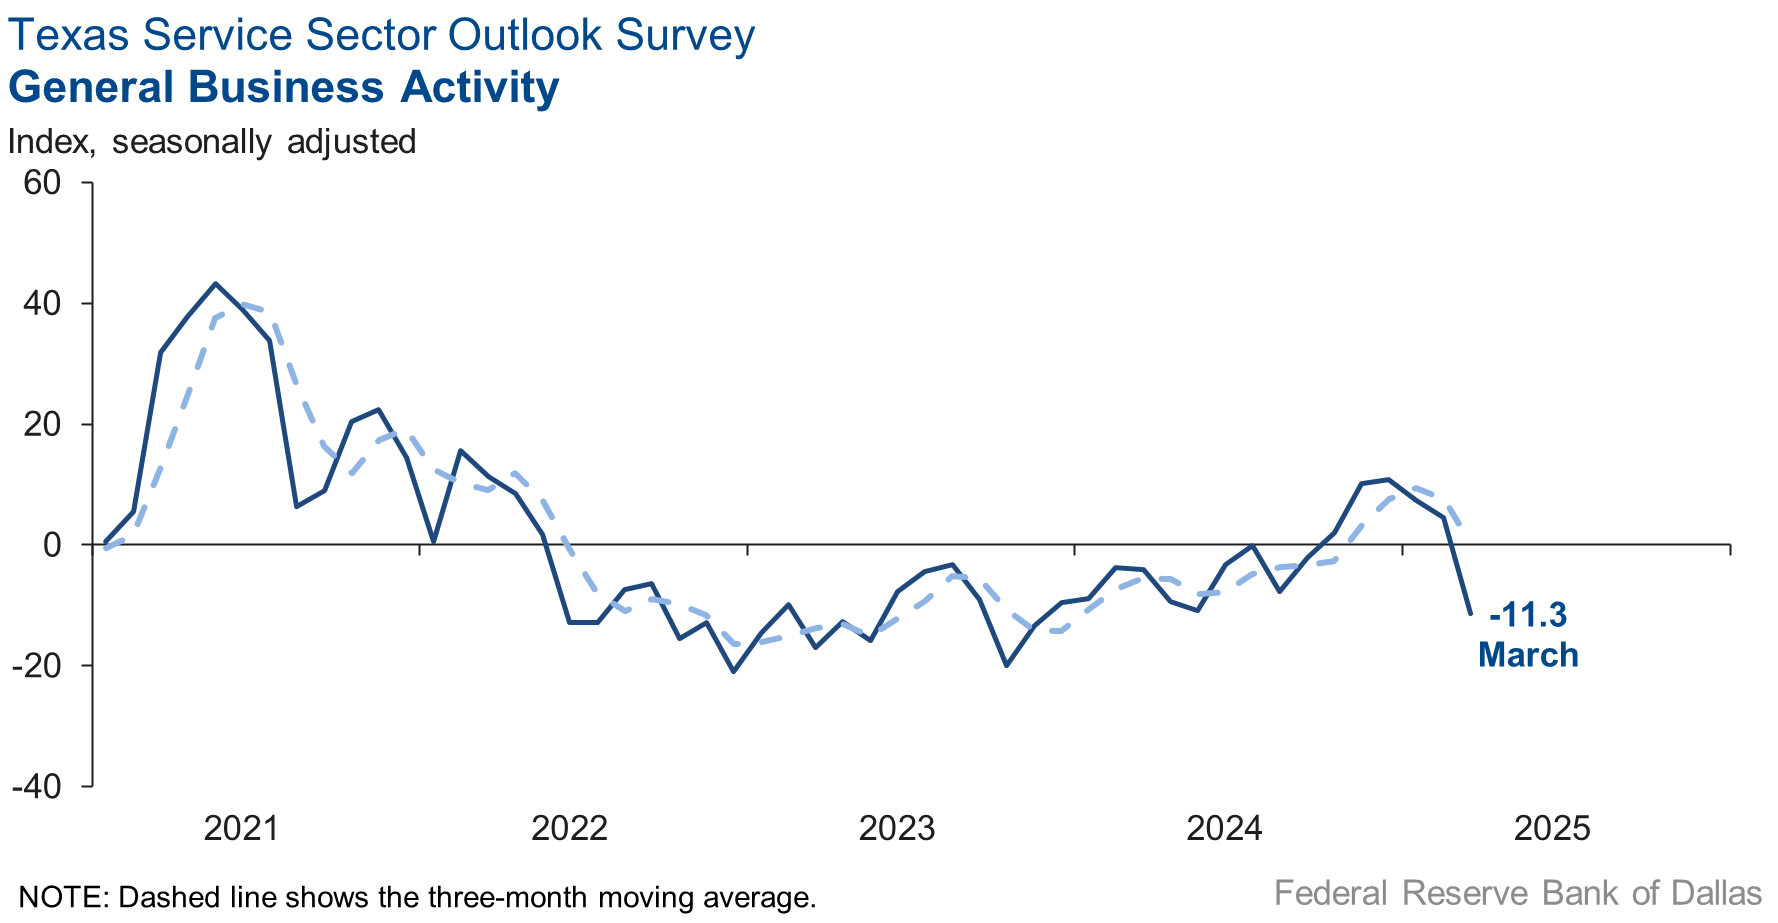
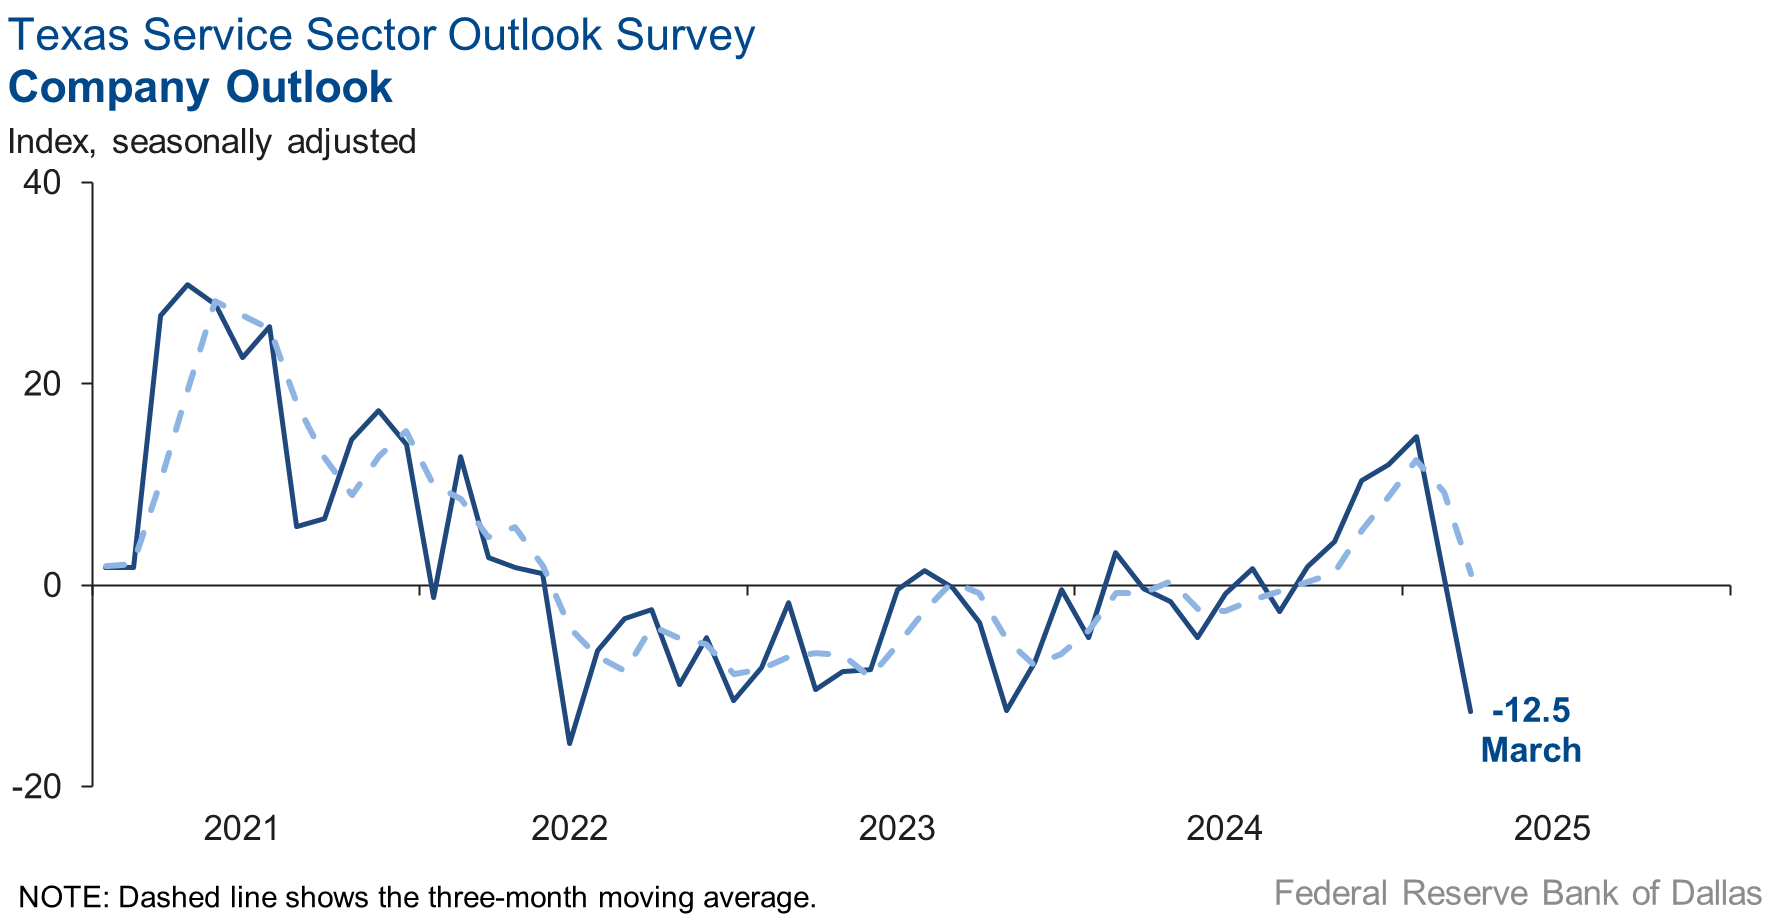
Perceptions of broader business conditions worsened in March. The general business activity index dropped 16 points to -11.3, its lowest level since November 2023 . In addition, outlooks deteriorated sharply as the company outlook index declined to its lowest level since mid-2022, falling to -12.5 from 1.1. The outlook uncertainty index increased to 27.3 from 14.2.
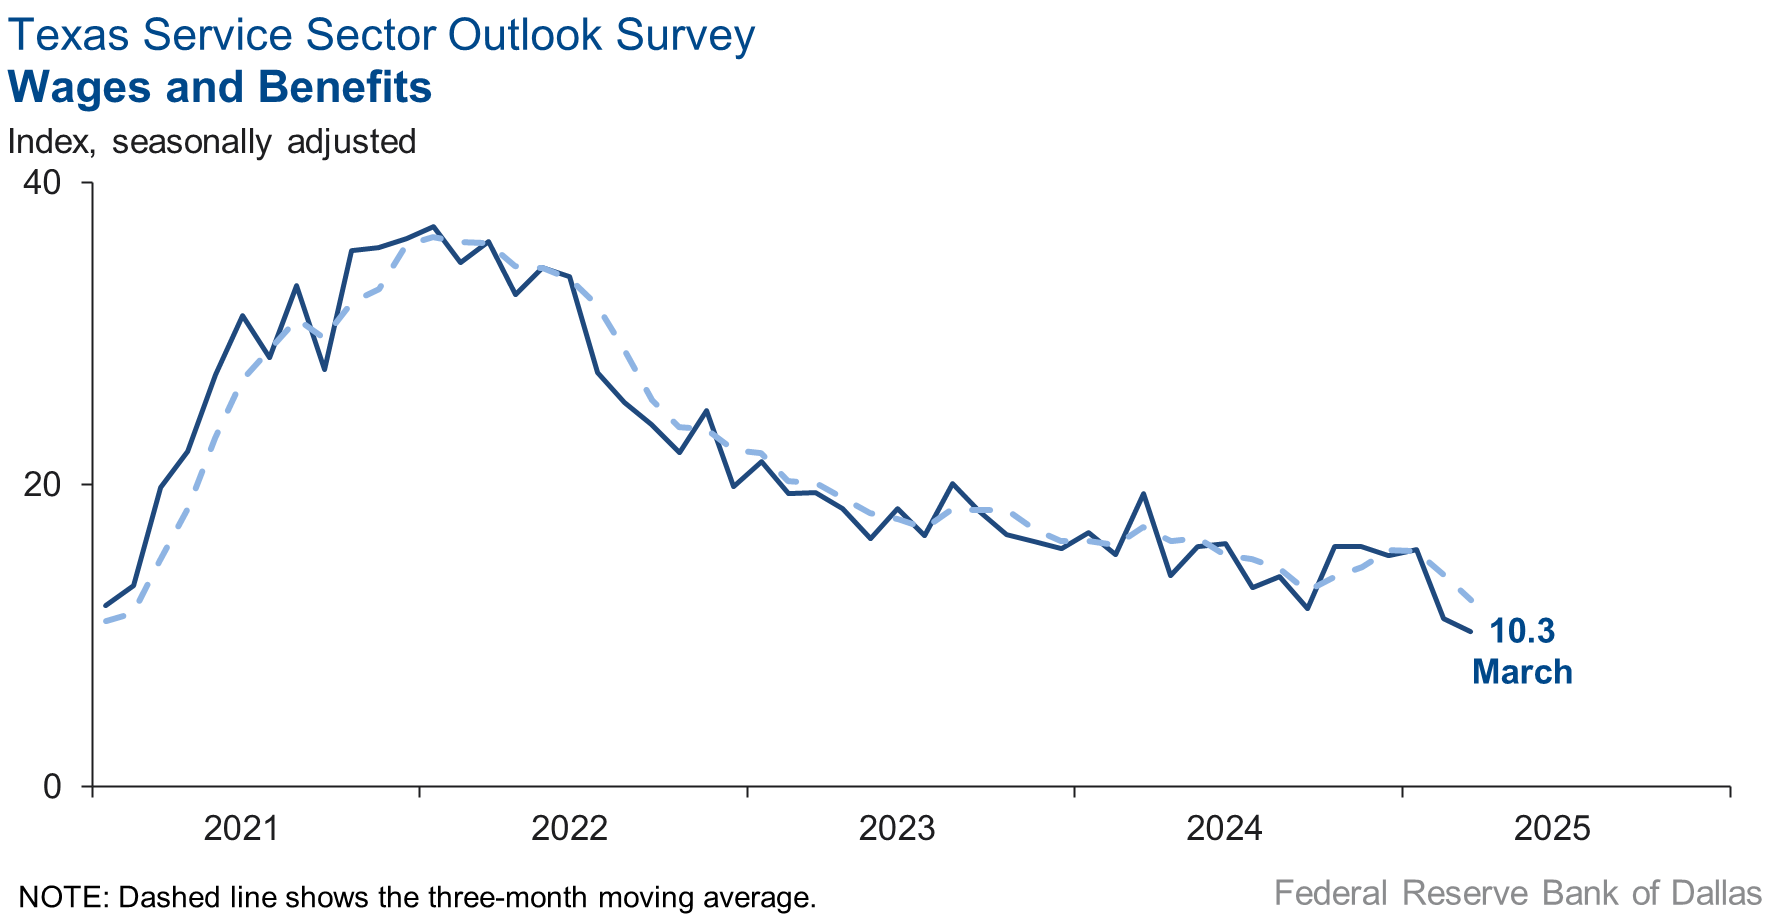
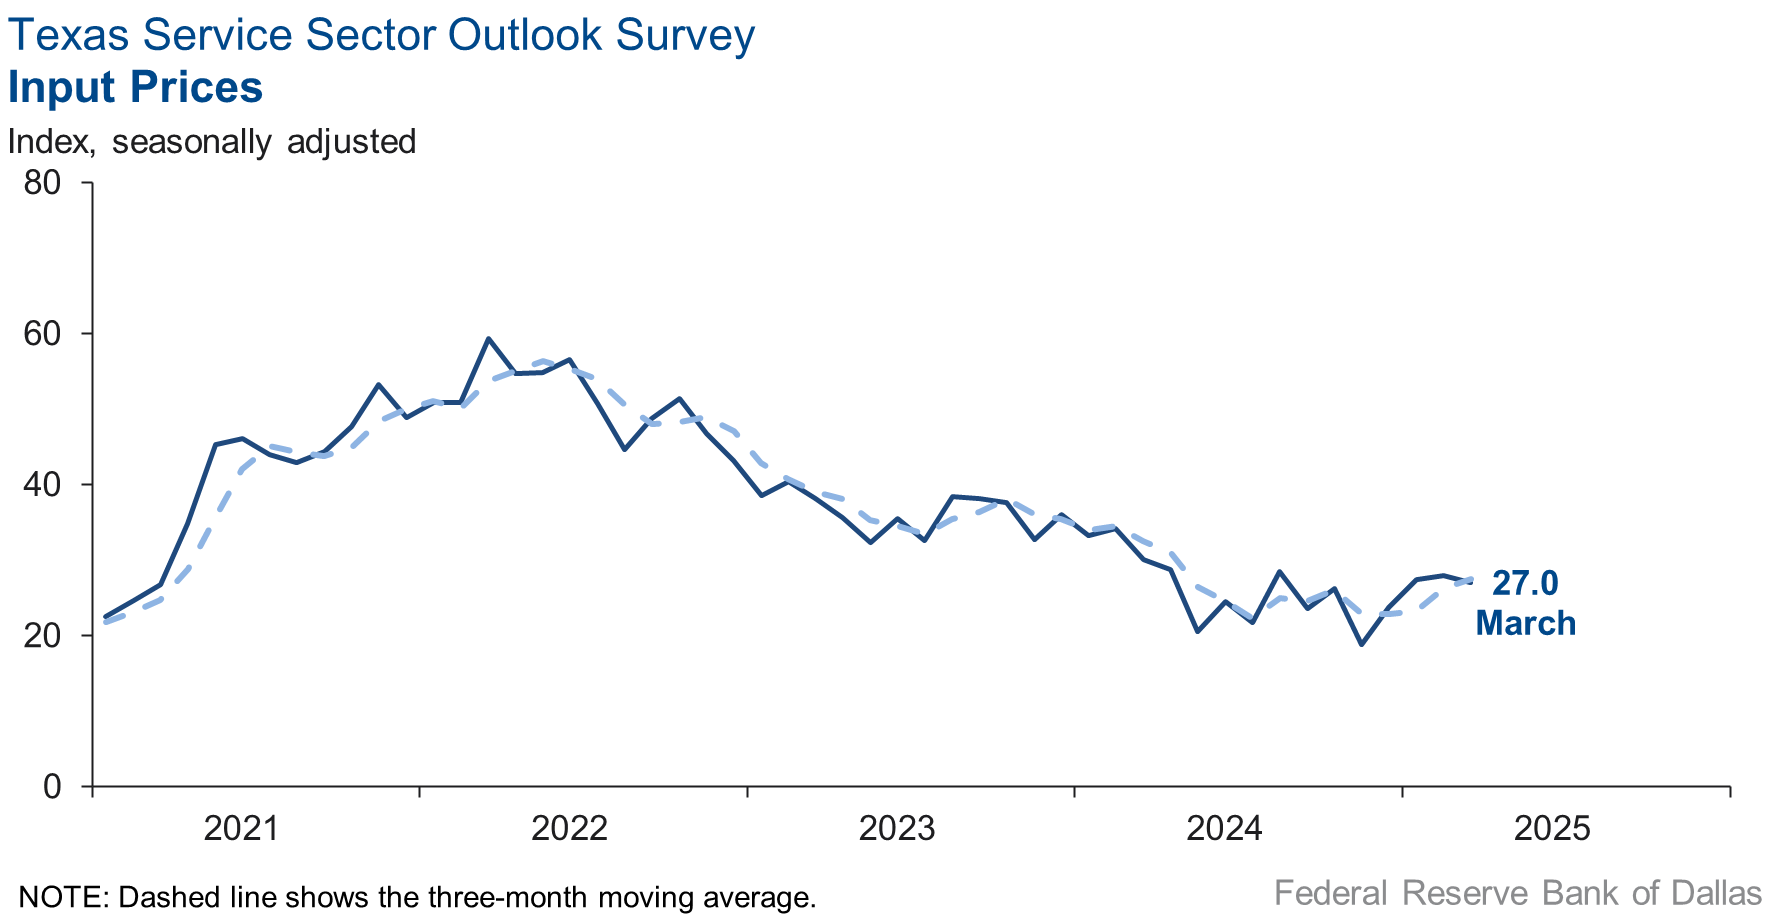
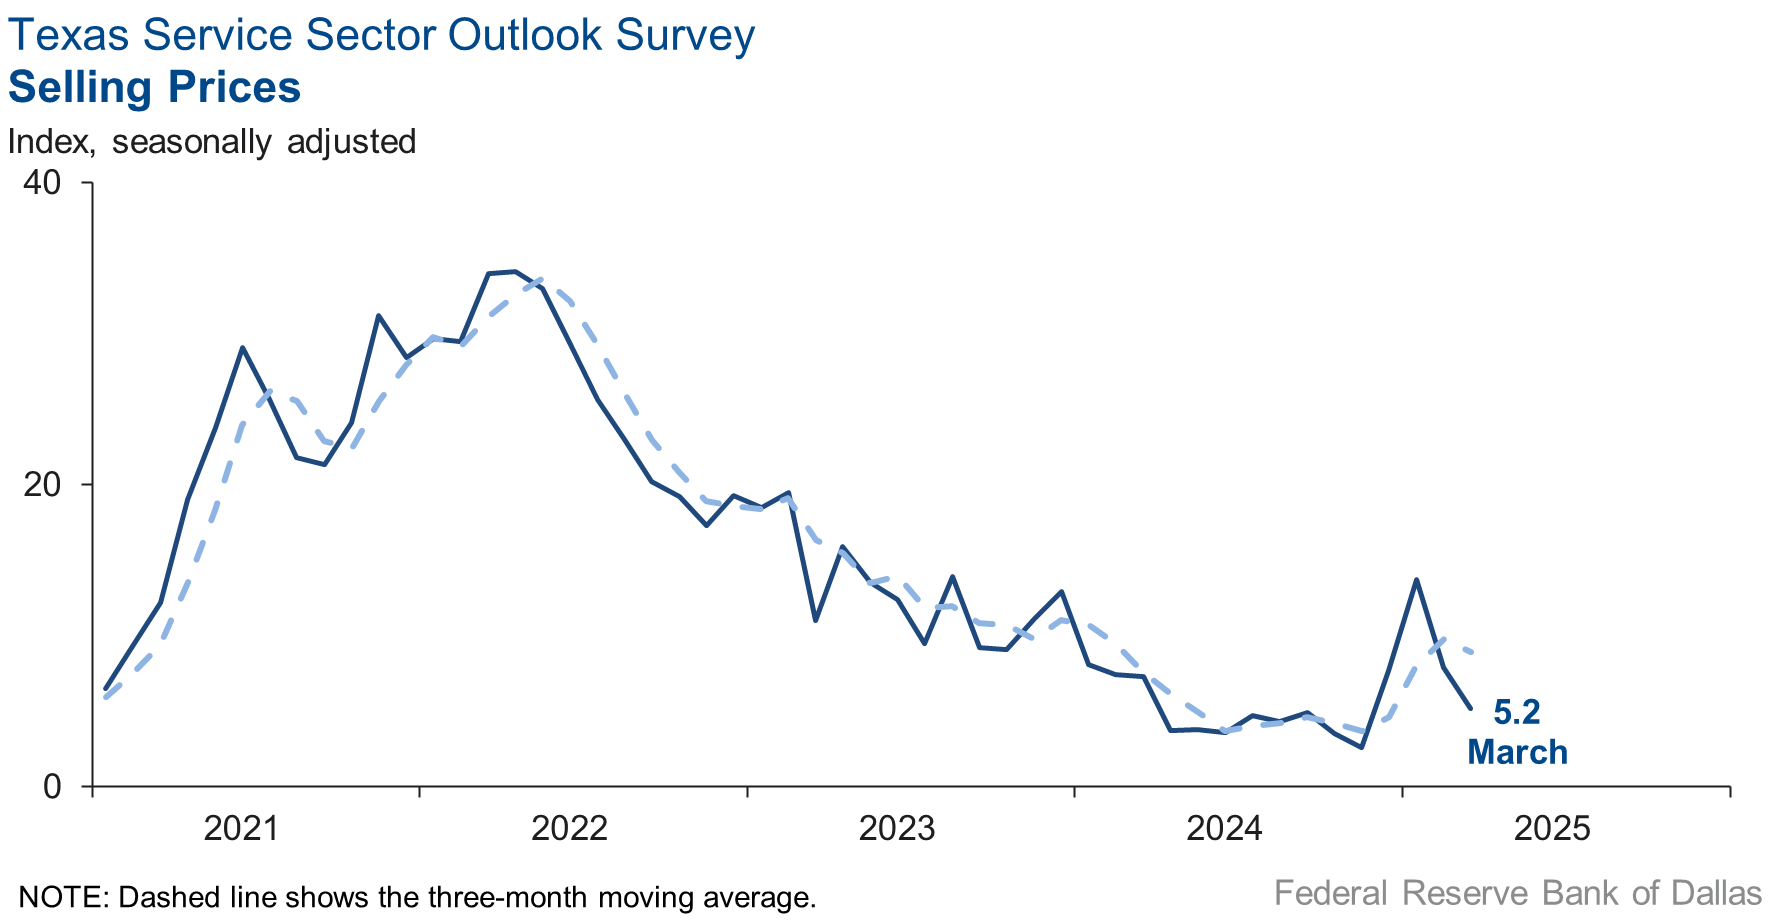
Selling price pressures fell slightly in March while input price and wage growth remained stable. The selling prices index fell three points to 5.2, while the input prices index was basically unchanged at 27.0. The wages and benefits index moved sideways to 10.3.
Respondents’ expectations regarding future business activity also downshifted in March. The future general business activity index fell to -1.1 from 12.3, while the future revenue index dropped 13 points to 30.9. Other future service-sector activity indexes such as employment and capital expenditures also fell but remained in positive territory, reflecting expectations for slower growth in the next six months.

Texas Retail Outlook Survey
Texas retail sales fall
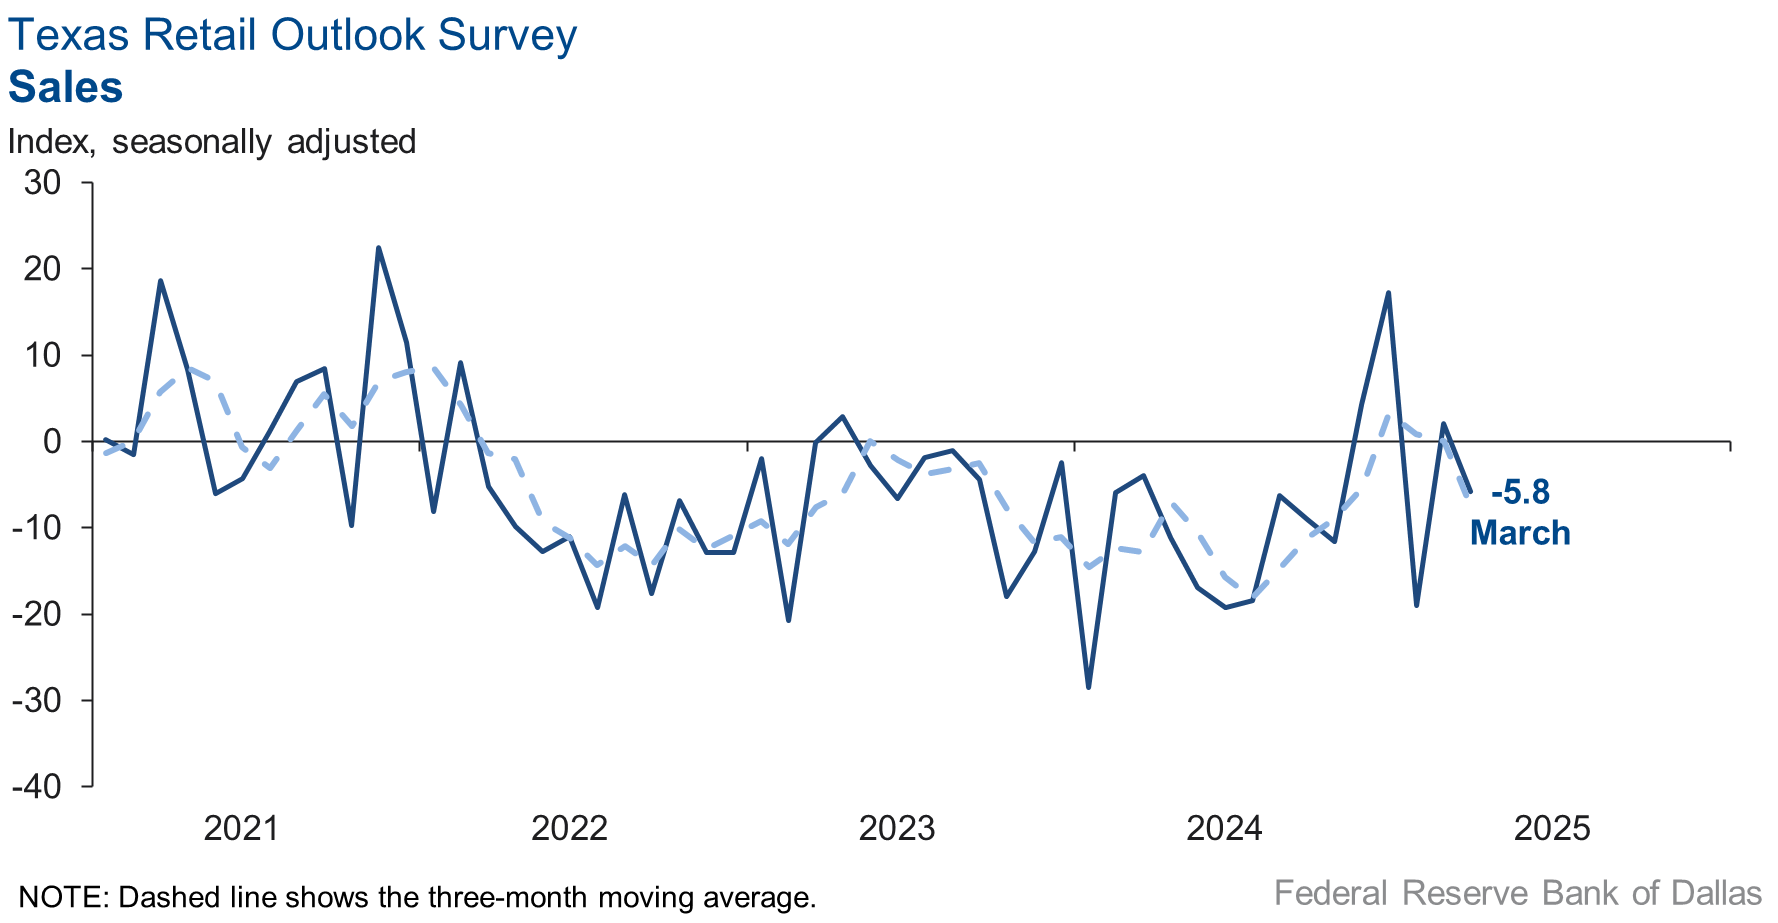
Retail sales activity decreased in March, according to business executives responding to the Texas Retail Outlook Survey. The sales index, a key measure of state retail activity, fell to -5.8 from 2.1. Retailers’ inventories were flat over the month, with the March index at -1.0, up from -4.8 in February.
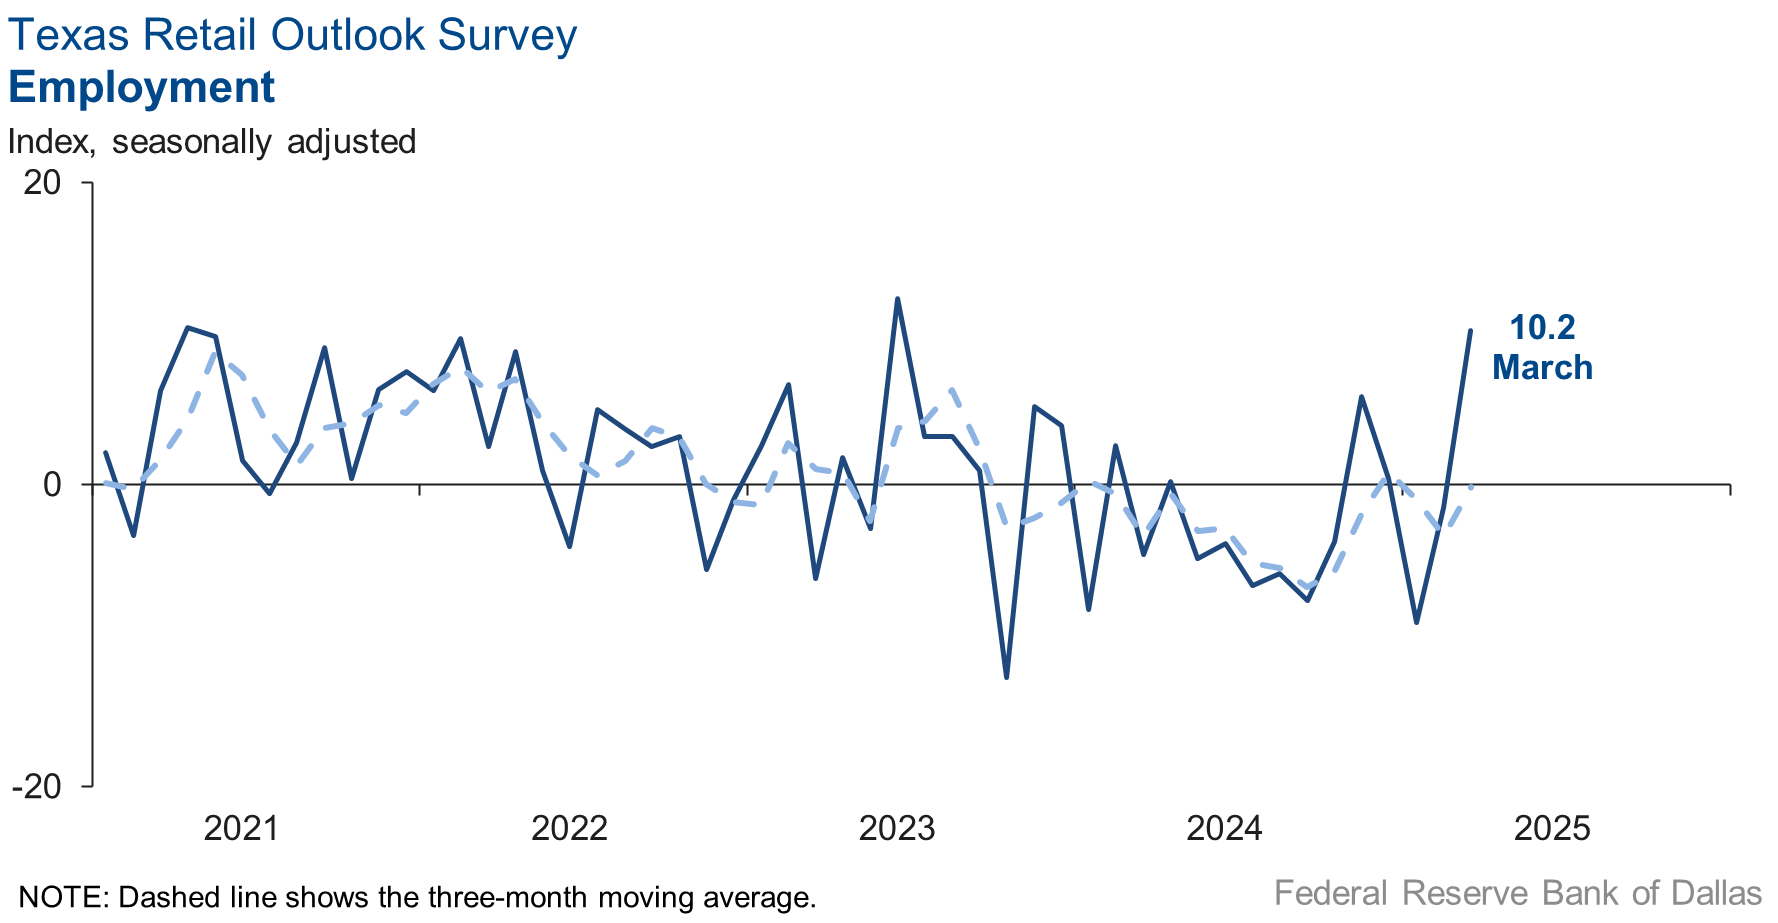
Retail sector labor market indicators suggested resumption in employment growth but contraction in workweeks. The employment index increased to 10.2 from -1.5. The part-time employment index fell five points to -2.2, and the hours-worked index fell five points to -5.0.
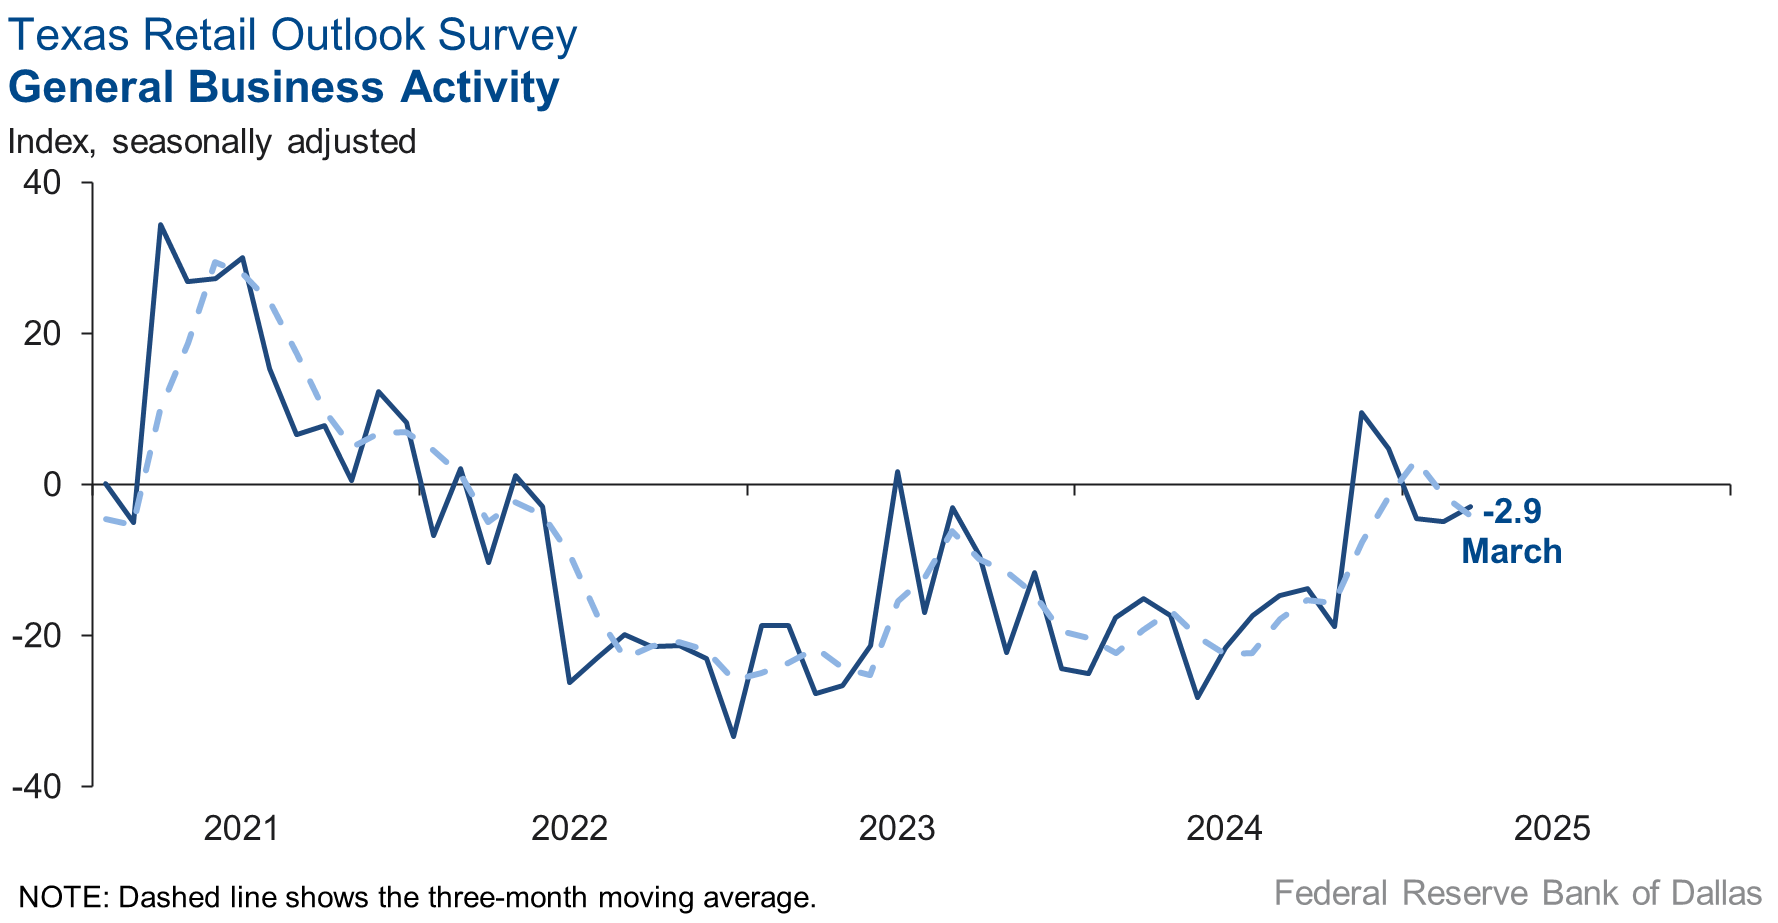
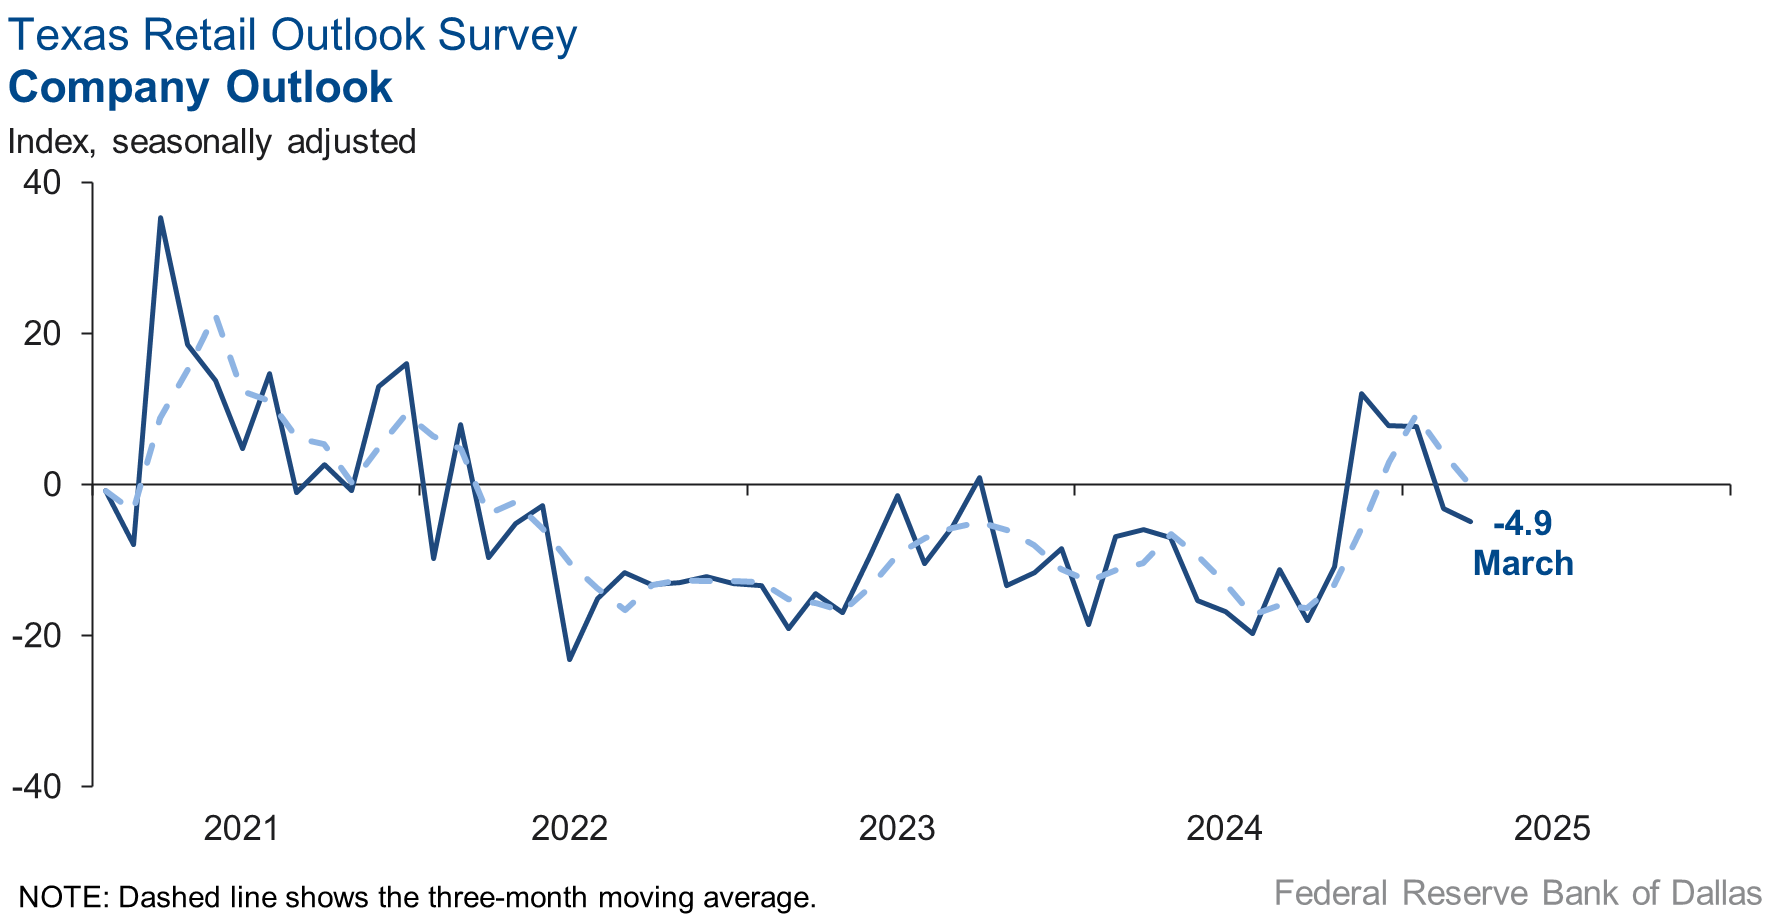
Perceptions of broader business conditions continued to worsen in March. The general business activity index remained in negative territory but increased to -2.9 from -4.9, while the company outlook index dipped to -4.9 from -3.2. Uncertainty in outlooks increased at a relatively unchanged pace, with the index coming in at 12.8.
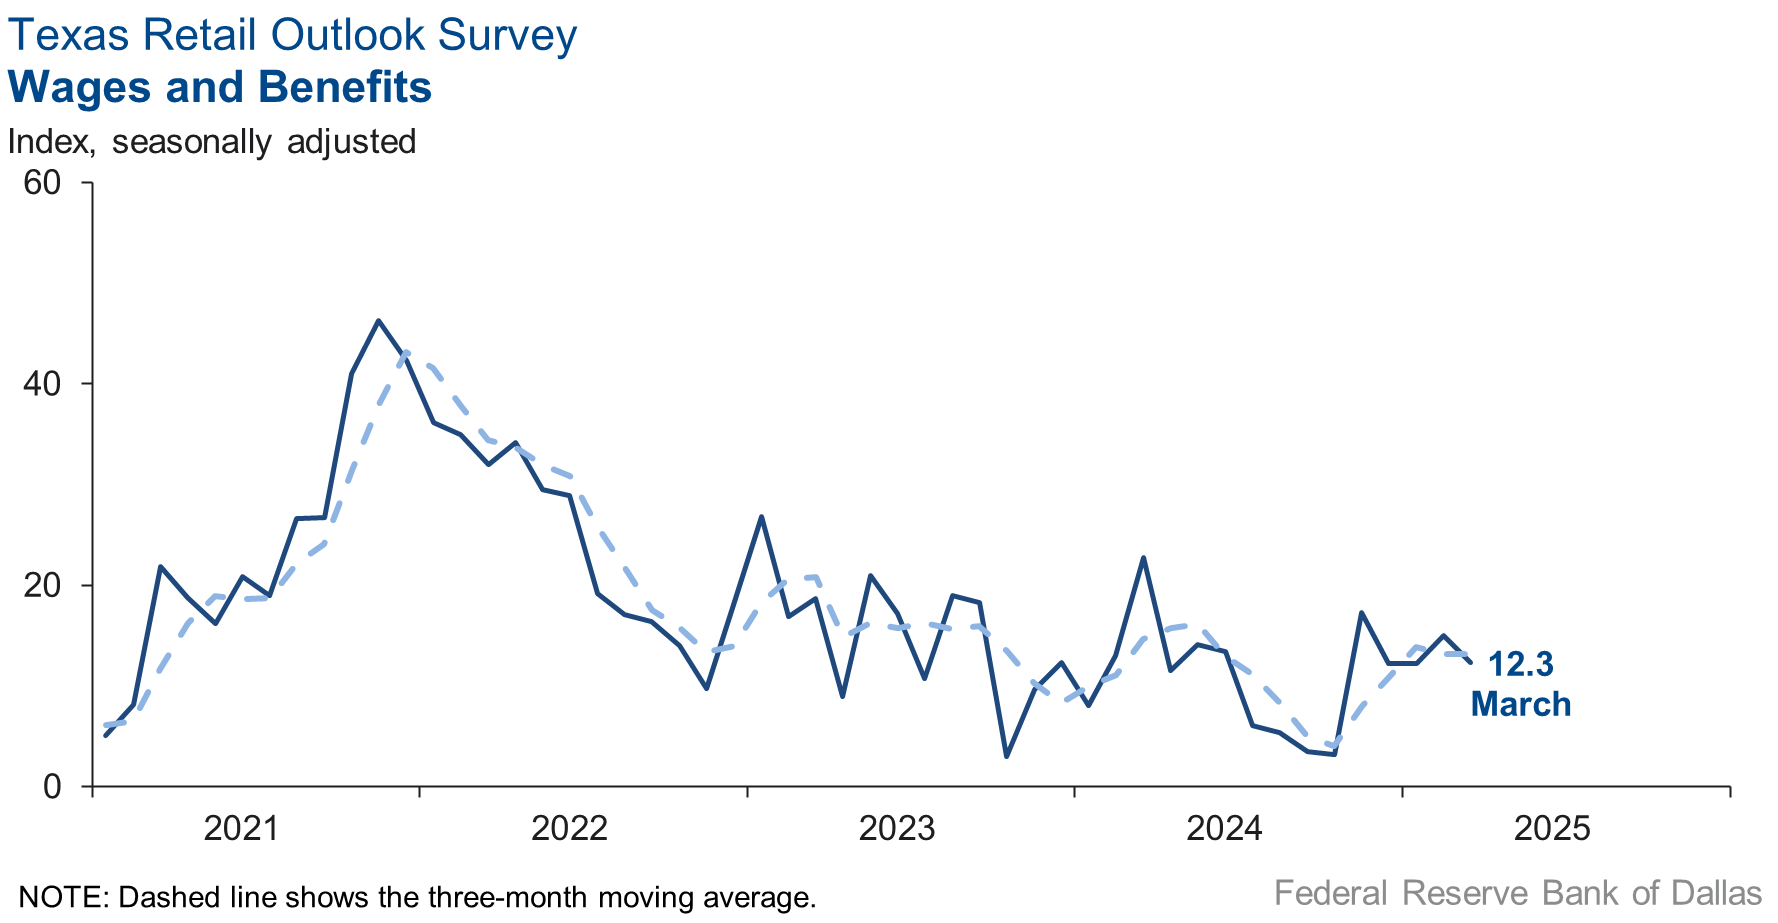
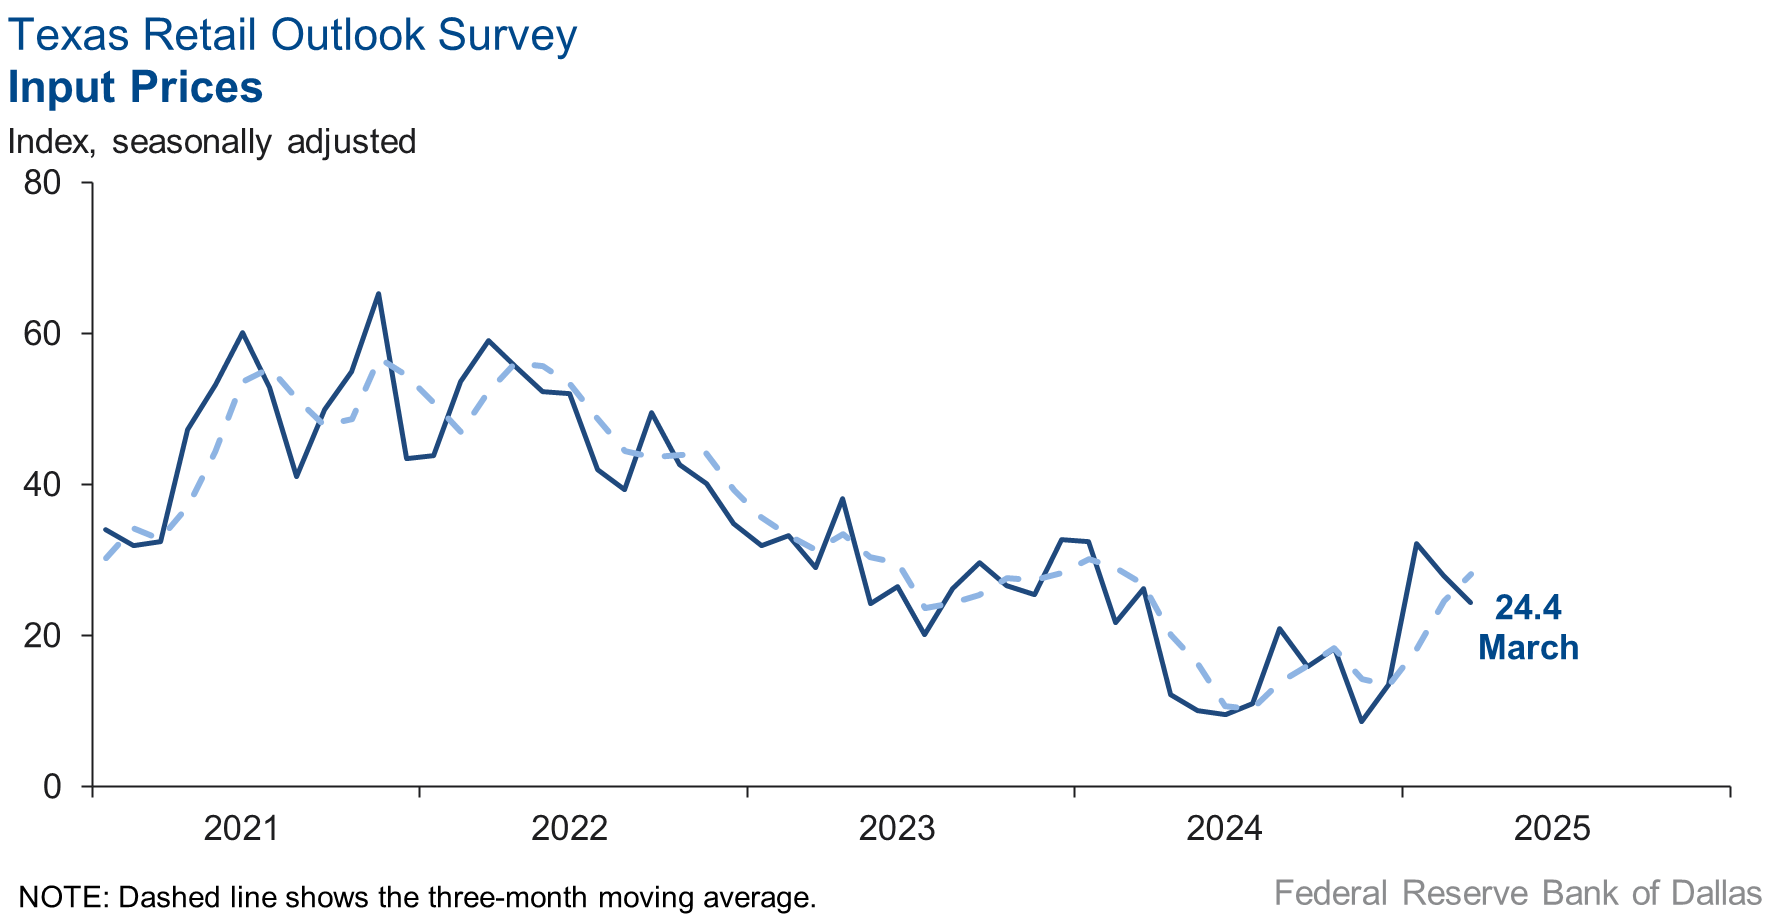
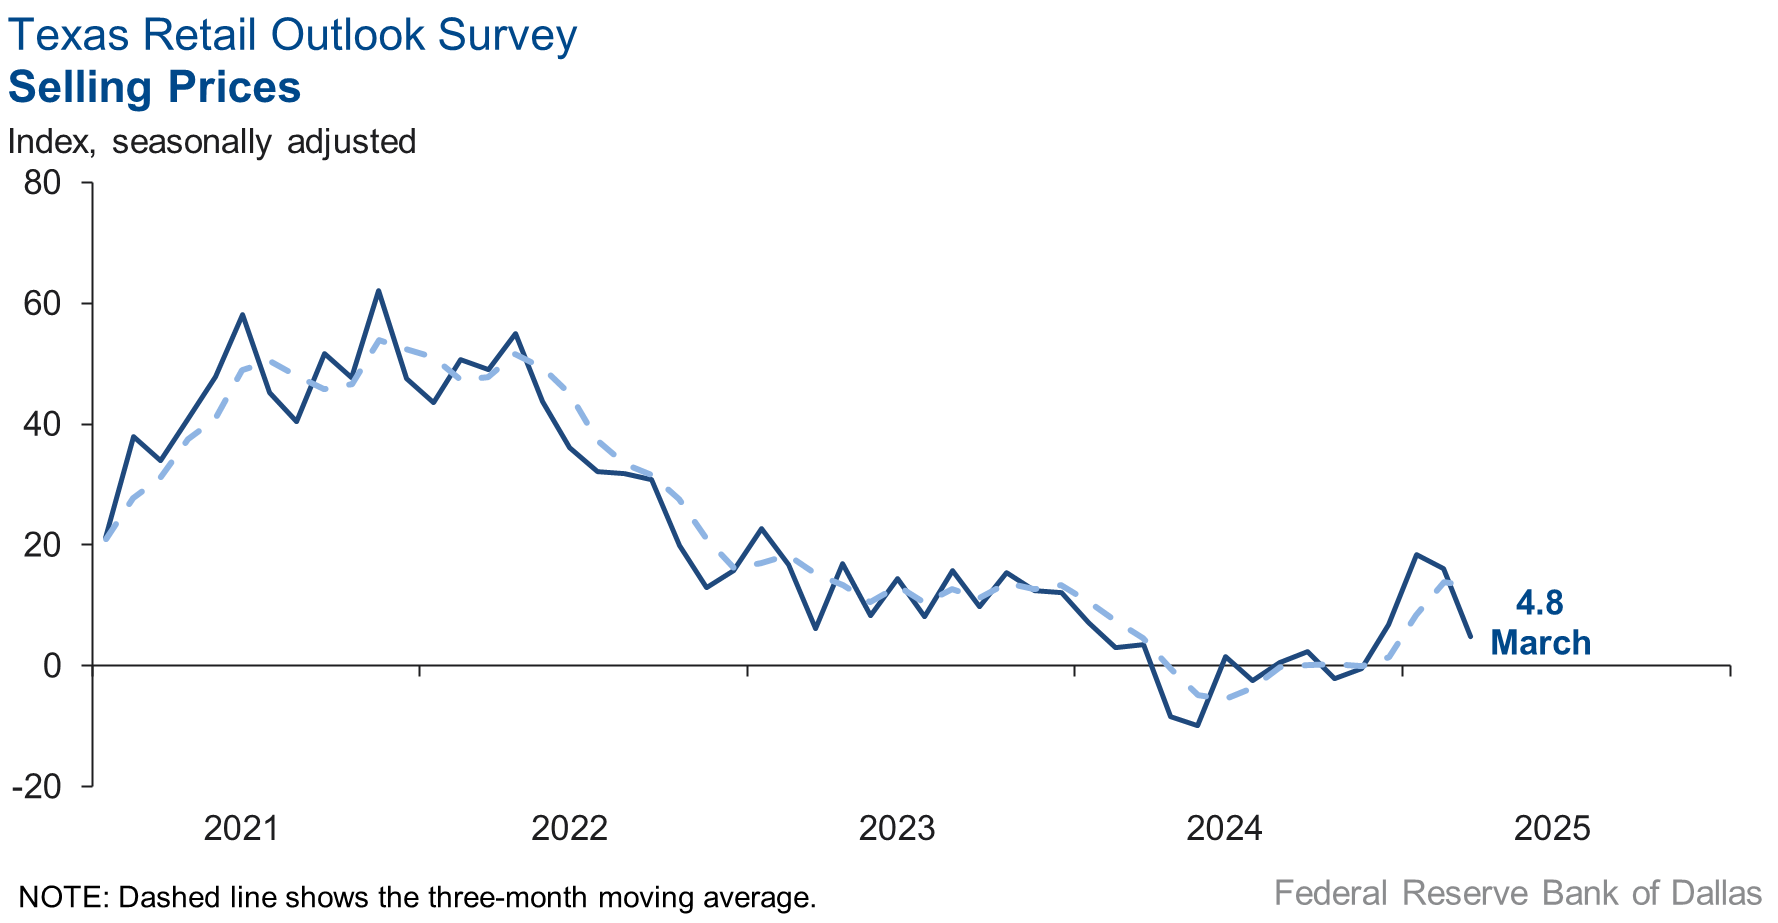
Price and wage pressures eased in March. The selling prices index fell 11 points to 4.8, while the input prices index decreased four points to 24.4. The wages and benefits index fell three points to 12.3.
Respondents showed mixed expectations regarding future business activity in March. While the future general business activity index increased to 6.9 from 3.7, the future company outlook index slid into negative territory. The future sales index fell 16 points to 18.6. Both the future employment index and the future capital expenditures index remained in positive territory.
Next release: April 29, 2025
Data were collected March 18–26, and 259 of the 375 Texas service sector business executives surveyed submitted responses. The Dallas Fed conducts the Texas Service Sector Outlook Survey monthly to obtain a timely assessment of the state’s service sector activity. Firms are asked whether revenue, employment, prices, general business activity and other indicators increased, decreased or remained unchanged over the previous month.
Survey responses are used to calculate an index for each indicator. Each index is calculated by subtracting the percentage of respondents reporting a decrease from the percentage reporting an increase. When the share of firms reporting an increase exceeds the share reporting a decrease, the index will be greater than zero, suggesting the indicator has increased over the prior month. If the share of firms reporting a decrease exceeds the share reporting an increase, the index will be below zero, suggesting the indicator has decreased over the prior month. An index will be zero when the number of firms reporting an increase is equal to the number of firms reporting a decrease. Data have been seasonally adjusted as necessary.
Data have been seasonally adjusted as necessary.
Texas Service Sector Outlook Survey
Historical data are available from January 2007 to the most current release month.
| Business Indicators Relating to Facilities and Products in Texas Current (versus previous month) | ||||||||
| Indicator | Mar Index | Feb Index | Change | Series Average | Trend* | % Reporting Increase | % Reporting No Change | % Reporting Decrease |
Revenue | 1.3 | 8.2 | –6.9 | 10.5 | 14(+) | 26.4 | 48.4 | 25.1 |
Employment | 2.2 | –0.1 | +2.3 | 6.1 | 1(+) | 12.4 | 77.4 | 10.2 |
Part–Time Employment | –1.7 | 1.0 | –2.7 | 1.3 | 1(–) | 4.1 | 90.1 | 5.8 |
Hours Worked | 0.8 | –1.0 | +1.8 | 2.6 | 1(+) | 7.9 | 85.0 | 7.1 |
Wages and Benefits | 10.3 | 11.1 | –0.8 | 15.7 | 58(+) | 16.2 | 77.9 | 5.9 |
Input Prices | 27.0 | 28.0 | –1.0 | 27.8 | 59(+) | 31.9 | 63.2 | 4.9 |
Selling Prices | 5.2 | 7.9 | –2.7 | 7.5 | 56(+) | 15.1 | 75.0 | 9.9 |
Capital Expenditures | 7.4 | 10.4 | –3.0 | 9.9 | 56(+) | 15.2 | 77.0 | 7.8 |
| General Business Conditions Current (versus previous month) | ||||||||
| Indicator | Mar Index | Feb Index | Change | Series Average | Trend** | % Reporting Improved | % Reporting No Change | % Reporting Worsened |
Company Outlook | –12.5 | 1.1 | –13.6 | 4.3 | 1(–) | 11.6 | 64.3 | 24.1 |
General Business Activity | –11.3 | 4.6 | –15.9 | 2.3 | 1(–) | 12.2 | 64.3 | 23.5 |
| Indicator | Mar Index | Feb Index | Change | Series Average | Trend* | % Reporting Increase | % Reporting No Change | % Reporting Decrease |
Outlook Uncertainty | 27.3 | 14.2 | +13.1 | 13.2 | 46(+) | 38.5 | 50.4 | 11.2 |
| Business Indicators Relating to Facilities and Products in Texas Future (six months ahead) | ||||||||
| Indicator | Mar Index | Feb Index | Change | Series Average | Trend* | % Reporting Increase | % Reporting No Change | % Reporting Decrease |
Revenue | 30.9 | 43.9 | –13.0 | 37.5 | 59(+) | 47.0 | 36.9 | 16.1 |
Employment | 14.9 | 25.7 | –10.8 | 23.1 | 59(+) | 27.0 | 60.9 | 12.1 |
Part–Time Employment | –1.5 | 5.6 | –7.1 | 6.6 | 1(–) | 7.2 | 84.1 | 8.7 |
Hours Worked | 4.6 | 9.5 | –4.9 | 5.9 | 59(+) | 9.8 | 85.0 | 5.2 |
Wages and Benefits | 27.7 | 37.3 | –9.6 | 37.5 | 59(+) | 35.8 | 56.0 | 8.1 |
Input Prices | 41.2 | 42.9 | –1.7 | 44.3 | 219(+) | 46.4 | 48.4 | 5.2 |
Selling Prices | 20.6 | 22.8 | –2.2 | 24.5 | 59(+) | 29.5 | 61.6 | 8.9 |
Capital Expenditures | 11.9 | 20.3 | –8.4 | 22.7 | 58(+) | 23.3 | 65.4 | 11.4 |
| General Business Conditions Future (six months ahead) | ||||||||
| Indicator | Mar Index | Feb Index | Change | Series Average | Trend** | % Reporting Improved | % Reporting No Change | % Reporting Worsened |
Company Outlook | –0.6 | 13.3 | –13.9 | 15.6 | 1(–) | 20.5 | 58.4 | 21.1 |
General Business Activity | –1.1 | 12.3 | –13.4 | 12.2 | 1(–) | 23.0 | 52.9 | 24.1 |
Historical data are available from January 2007 to the most current release month.
| Business Indicators Relating to Facilities and Products in Texas Retail (versus previous month) | ||||||||
| Indicator | Mar Index | Feb Index | Change | Series Average | Trend* | % Reporting Increase | % Reporting No Change | % Reporting Decrease |
| Retail Activity in Texas | ||||||||
Sales | –5.8 | 2.1 | –7.9 | 3.2 | 1(–) | 24.1 | 46.0 | 29.9 |
Employment | 10.2 | –1.5 | +11.7 | 1.6 | 1(+) | 13.9 | 82.4 | 3.7 |
Part–Time Employment | –2.2 | 2.8 | –5.0 | –1.5 | 1(–) | 2.0 | 93.8 | 4.2 |
Hours Worked | –5.0 | –0.4 | –4.6 | –2.2 | 4(–) | 2.2 | 90.6 | 7.2 |
Wages and Benefits | 12.3 | 15.0 | –2.7 | 11.2 | 56(+) | 18.5 | 75.3 | 6.2 |
Input Prices | 24.4 | 27.9 | –3.5 | 22.5 | 59(+) | 34.6 | 55.2 | 10.2 |
Selling Prices | 4.8 | 16.1 | –11.3 | 13.1 | 4(+) | 24.2 | 56.4 | 19.4 |
Capital Expenditures | 7.6 | 6.8 | +0.8 | 7.6 | 5(+) | 15.3 | 77.0 | 7.7 |
Inventories | –1.0 | –4.8 | +3.8 | 2.8 | 2(–) | 25.0 | 49.1 | 26.0 |
| Companywide Retail Activity | ||||||||
Companywide Sales | –11.0 | 15.0 | –26.0 | 4.4 | 1(–) | 20.1 | 48.8 | 31.1 |
Companywide Internet Sales | –1.6 | 7.4 | –9.0 | 3.9 | 1(–) | 12.3 | 73.8 | 13.9 |
| General Business Conditions, Retail Current (versus previous month) | ||||||||
| Indicator | Mar Index | Feb Index | Change | Series Average | Trend** | % Reporting Improved | % Reporting No Change | % Reporting Worsened |
Company Outlook | –4.9 | –3.2 | –1.7 | 1.4 | 2(–) | 14.7 | 65.7 | 19.6 |
General Business Activity | –2.9 | –4.9 | +2.0 | –2.6 | 3(–) | 16.4 | 64.3 | 19.3 |
| Outlook Uncertainty Current (versus previous month) | ||||||||
| Indicator | Mar Index | Feb Index | Change | Series Average | Trend* | % Reporting Increase | % Reporting No Change | % Reporting Decrease |
Outlook Uncertainty | 12.8 | 14.0 | –1.2 | 11.0 | 8(+) | 28.3 | 56.2 | 15.5 |
| Business Indicators Relating to Facilities and Products in Texas, Retail Future (six months ahead) | ||||||||
| Indicator | Mar Index | Feb Index | Change | Series Average | Trend* | % Reporting Increase | % Reporting No Change | % Reporting Decrease |
| Retail Activity in Texas | ||||||||
Sales | 18.6 | 34.1 | –15.5 | 30.4 | 22(+) | 37.0 | 44.6 | 18.4 |
Employment | 16.4 | 20.9 | –4.5 | 12.7 | 6(+) | 25.9 | 64.6 | 9.5 |
Part–Time Employment | 2.5 | 4.7 | –2.2 | 1.6 | 6(+) | 7.0 | 88.5 | 4.5 |
Hours Worked | –7.7 | –0.7 | –7.0 | 2.3 | 3(–) | 3.6 | 85.1 | 11.3 |
Wages and Benefits | 12.3 | 28.5 | –16.2 | 29.0 | 59(+) | 25.8 | 60.6 | 13.5 |
Input Prices | 35.0 | 41.1 | –6.1 | 33.8 | 59(+) | 42.5 | 50.0 | 7.5 |
Selling Prices | 26.8 | 28.9 | –2.1 | 28.5 | 59(+) | 39.0 | 48.8 | 12.2 |
Capital Expenditures | 16.7 | 5.8 | +10.9 | 16.6 | 16(+) | 27.2 | 62.3 | 10.5 |
Inventories | 9.9 | –5.4 | +15.3 | 10.7 | 1(+) | 29.6 | 50.7 | 19.7 |
| Companywide Retail Activity | ||||||||
Companywide Sales | 18.8 | 31.3 | –12.5 | 28.8 | 22(+) | 36.9 | 45.1 | 18.1 |
Companywide Internet Sales | 9.4 | 28.2 | –18.8 | 21.1 | 14(+) | 21.9 | 65.6 | 12.5 |
*Shown is the number of consecutive months of expansion or contraction in the underlying indicator. Expansion is indicated by a positive index reading and denoted by a (+) in the table. Contraction is indicated by a negative index reading and denoted by a (–) in the table.
**Shown is the number of consecutive months of improvement or worsening in the underlying indicator. Improvement is indicated by a positive index reading and denoted by a (+) in the table. Worsening is indicated by a negative index reading and denoted by a (–) in the table.
Data have been seasonally adjusted as necessary.
Texas Service Sector Outlook Survey
Texas Retail Outlook Survey
Texas Service Sector Outlook Survey
Comments from survey respondents
These comments are from respondents’ completed surveys and have been edited for publication.
- Erratic behavior by the current administration makes us increasingly uncertain about the economy and our business. Our business specializes in shopping malls, so if consumer spending dips, our business will suffer. If the price of building materials or tariffs for commercial real estate developers skyrocket, our business will suffer.
- Our company relies heavily on specialized subcontractors. The market for these resources had been tight throughout 2023 and the first half of 2024; however, it continues to soften, and many of these resources are communicating availability for the second half of this year. That makes us believe that broader demand for their services from our competitors is weakening.
- There is a lot of speculation regarding government regulations changing in many sectors as well as uncertainty being shared by clients due to this and cuts to the federal agencies.
- The increase in our uncertainty is based entirely upon the inconsistent and unclear policies of the current administration. The on-again-off-again tariffs, especially with regards to steel and aluminum, and inconsistent and probably unconstitutional immigration and deportation actions have pushed the markets into correction territory. Our business, which is the design of buildings, stands to be impacted by steel and aluminum tariffs and by immigration policy, since the construction industry workforce relies significantly on immigrant labor. Developers will not invest when faced with significant but uncertain increases in building materials and labor costs. They will hold off until costs stabilize in order to maximize their profit potential.
- Radical and erratic changes in U.S. government policies, budgets and funding priorities are creating uncertainty and havoc among government and industry clients.
- Energy clients are more optimistic, inflation worries have declined somewhat, but still there are concerns over the potential impact of tariffs on the energy sector.
- Uncertainty persists due to actions at the federal level.
- Development seems to be on hold pending ups and downs in Washington. Business uncertainty seems to be comparable to the period around the 9/11 crisis.
- We are still trying to understand the effects of the tariffs. In general, it feels like our customers are less worried than they were eight years ago. Tariffs did not have as big of an effect eight years ago as we thought they would. It seems like everyone is expecting the same small effect.
- The current DOGE reduction in federal workforce has placed a number of federal projects (large and small) on hold or canceled. There's a trickle-down impact on those of us who provide architectural and engineering services to the government. Projects are stalled, and remaining federal employees are bewildered as to how they will handle the workload with fewer people and where to get answers. Protocols and guidelines are being replaced, and there is a lot of confusion top to bottom. We generally support reduction in the federal workforce, but how the agencies will operate and be efficient is yet to be seen and is causing uncertainty and anxiety in the private sector. We hesitate to staff up or even hire replacements.
- While we are somewhat optimistic for future revenue, it is not linked to our current base of contracts. Per the presidential executive orders, most civilian government agencies have suspended contract award and renewals. We have had one order canceled and renewal delays from the Centers for Disease Control. One watch item is executive order on February 26, 2025, which requires agencies to review existing contracts and grants, with directives to terminate or modify them to reduce spending. The implications from the loss of federal contracts for small business suppliers and small business technical service firms are still unknown. We anticipate loss of high-end technical talent. The executive order on March 20, 2025 mandates the consolidation of procurement for common goods and services under the General Services Administration, which is not a new idea. However, under the current environment without a clearly defined plan, this will not be an easy transition.
- We are beginning to hear anecdotally of a slowdown in transactions, particularly bank lending.
- Until our current administration stops sending mixed messages, transactions in the real estate market will remain sluggish. This, coupled with developers and purchasers having a difficult time pricing real estate transactions due in part to the tariffs being imposed, has caused companies to take a pause.
- Our clients are, for the most part, cautiously optimistic, and we reflect that optimism.
- Tariffs are having an impact already.
- The uncertainty generated by the current administration has created a future that has absolutely no predictability or stability.
- We see a mixed picture in Texas. In 2024, our firm touched probably $12.5 billion worth of infrastructure projects, from land development to LNG facilities to skyscrapers. We are the engineer of record for the geotechnical scopes for most mega projects coming online in 2025. Many of the data centers are in our scope, mega factories, and we are at nearly every single LNG facility along the Gulf Coast. However, a few large projects for the first time in a year are said to be put on hold due to tariff concerns, waiting about three months before signaling whether or not projects will be mobilized. That being said, our company continues to hire, with record land development work across the state of Texas and particularly in the Houston and DFW regions.
- We are slower than during the recession or pandemic.
- Tariff uncertainty is causing buyers to slow.
- It is still early, however the economic uncertainty resulting from the chaotic and shifting policies from Washington has negatively impacted client behavior. A number of projects and activities have been delayed, or clients are taking more of a wait-and-see approach. For the most part, our clients are focused on domestic activities, and it is doubtful their businesses will be directly impacted by the aggressive tariff policies. It can only be assumed their response is the expectation tariffs will lead to price increases and increased inflationary pressures.
- We will be selling off what we can and closing the doors in 60 days.
- Tariffs will increase upward pressure on costs to operate businesses. The cost escalation and price increases of products are higher than our overall revenue increases, thus reducing margins.
- Interest rates not being lowered and the uncertainty of tariffs are definitely impacting our business.
- The uncertainty of how the new trade directives will affect the economy makes it hard to forecast the business environment.
- Real estate markets are not recovering as we expected, and mortgage lending is still slow.
- Pending and potential tariffs are not affecting our customers at this time, at least in the aerospace end of our business. However, this could change any time.
- The current style of government is causing tons of distress for our clients. We would all prefer that the negotiations went on behind closed doors as opposed to us seeing the back-and-forth in real time.
- We have general concern about the economy and the first quarter GDP.
- These last few months have been a lot about uncertainty, from the tariffs to rising unemployment due to layoffs. People are not sure of what the next change will be, and that is reflecting in everyone starting to hold back unnecessary spending. It may eventually be OK, but gaining certainty on what to expect is a necessity.
- The uncertain economic conditions are starting to impact leisure travel and group bookings for future dates.
- Growth has not materialized as anticipated during the first quarter of 2025.
- Federal and state policy changes are impacting us significantly. The threat of inflation due to tariffs and market uncertainty will hurt our bottom line.
- Concerns about immigration and federal funding cuts are impacting our workforce and our clients.
- What to say? Trade wars hurt everyone, starting with us.
- Obviously, the lack of consistent direction regarding tariffs is causing us all sorts of unknowns that then result in price increases from our suppliers as they fear tariff impacts and they are all trying to anticipate the impact on their business.
- The uncertainty regarding trade policy is greatly impacting our industry and our business. Government could really do a better job of signaling clearly what their intentions are and then sticking to them.
- We see spending falling in our sector. People are nervous about tariffs.
- We absolutely see a softening in the economy and in consumer demand in particular. If it persists, we will adjust.
- We see tariff uncertainty, both in energy (Canada and Mexico) and in the broader supply chain, steel, pipe, transformers.
- Tariffs are creating considerable uncertainty across a variety of fronts. The potential surcharge on Chinese-made ships will be a devastating hit to Texas ports and likely the Texas economy in general. Finally, all of South Texas is in a horrific drought that could lead to industry cutbacks by the fall. All in all, it’s a pretty pessimistic time right now.
- Continued uncertainty around tariffs, combined with an interest rate environment that remains tight, continues to generate uncertainty across our client base and within our company. This has effectively frozen spending and forward investment decisions throughout our industry, muting growth opportunities.
- The main issue remains uncertainty affecting companies’ budgets and ability to spend as was planned.
- We're worried about our European customers who may decide to stop doing business with American companies.
- Purchasing budgets of prospects and current customers are still tight in the marketplace. Hopefully, the decreasing regulations will improve confidence in making purchasing decisions. Global economic uncertainties will resolve and provide clarity on a return to economic prosperity.
- We are likely to see a slight decrease in business activity for the next two to three months, then an increase. Since we move international shipping containers, this will likely be due to warehouses increasing inventories in advance of tariffs.
- The market has hit a long paused since January. We are hoping that it will turn around after the dust settles.
- We have concerns about the hard cost of construction impacted by tariffs on Canadian lumber, along with appliances, mechanical equipment, electrical fixtures and flooring coming out of Mexico and China.
- Interest rates continue to hinder financed sales, which is about 75 percent of our business.
- Tariffs and immigration policies from the current administration are creating a lot of uncertainty in our business.
- Our apartment occupancy is shrinking as undocumented immigrants proactively leave to avoid losing their families and possessions. Qualified maintenance workers, which were already in short supply, are commanding absurd rates—if you can find them. Materials and supplies are going up just based on fear of tariffs. Meanwhile, we're having to lower rents to fill units. Considering how over-leveraged most rental property is, this is clearly not sustainable. Eventually, payments to mortgage bond holders will be missed and the economic effects will ripple.
- We are seeing more referrals that are related to maturity defaults relative to commercial real estate loans that are maturing or have matured, and the bank lender does not want to extend the maturity of an existing loan.
- We have had a slight revenue increase.
- There are a lot of variables that are making predictions more difficult to estimate. Cleaning up a mess is exciting and painful, there are always collateral repercussions. There is a good chance that the correct strategy is in place if we can just avoid a recession or disinflation. We may need some blood-stop powder and some extra gauze, and if we can avoid a war, then it seems the country and the economy will come through in positive condition.
- Clients are very worried about tariffs and very nervous about spending their marketing budgets. We provide marketing services. We also are concerned about tariff fallout on our vendor pricing and don't feel like we can pass those increases on to customers.
- Some of our clients are watching the economic climate in lieu of federal government activities. Construction is ongoing, but new jobs may be slowing somewhat. Time will tell.
- We service the manufacturing industry. Many sectors of it have been sluggish for the past six months or so. It has dramatically worsened over the past two months due to the threat of tariffs and concern over deterioration of the relationships between our country and Canada and Mexico. Most manufacturing companies are stopping capital expenditure plans due to policy uncertainty.
- We see weakness in lower income spending and lower commodity prices.
- Business is generally steady at levels common over the last 24 months, but it is off of the highs experienced in late 2021 through early 2023. The last two years have almost felt recessionary in our industry. We're eternally optimistic and do have growth plans in place for the year, but macroeconomic issues (tariffs, rates) outside of our control can certainly derail those. While we are not directly impacted by these two issues, they do impact our clients, which has a trickle-down effect to us.
- The recent market correction and tariff rhetoric have dampened spending slightly. Fear has been accelerating, albeit slightly.
- While there seems to remain a broad sense of uncertainty, retail cafe same-store sales were up 5.6 percent in February and up 7.1 percent year over year. March sales are also up 7.2 percent year over year. Wholesale sales are up 4.7 percent year over year driven primarily by grocery retail volume. Coffee tariffs loom large, particularly as spot prices shot up as much as 100 percent earlier this year, while now declining a bit, but only to levels that are far above 2024. We are experiencing price increases of all supplier goods and facing pressure from employees for higher pay.
- We are not being able to find employees.
- Tariff negotiations are causing short-term uncertainty in commodities markets and the consumer outlook. Retail traffic is down, but our customer count is up. Consumers are shopping value.
- We feel the uncertainty is the cause of people not spending.
- There is a lot of uncertainty due to the tariff situation related to imported products and, therefore, in terms of our customers’ ability to bid construction projects.
- The confidence level due to drought and Immigration and Customs Enforcement is hurting our business.
- U.S. import tariffs continue to weigh on conversations with our export restaurant customers. While nothing specific has materialized at this point, we expect our customers in Peru, Ecuador, Panama and Costa Rica could be pinched by higher retaliatory tariffs on U.S. goods being exported to those countries. China has hit back with significant tariffs on U.S. agriculture goods. This makes U.S. goods less attractive to the Chinese buyers, which could be indicative of similar patterns in the markets we trade. It is also hard to predict what might be targeted with retaliatory tariffs, so it remains to be seen what could impact our business. Counterintuitively, the action between China and the U.S. might actually lower the cost of chicken for the U.S. consumer, because China is such a large consumer of U.S. poultry. As U.S. chicken becomes less attractive to the foreign buyers, U.S. producers will be forced to keep product in the domestic market until production can be adjusted (assuming there is a domestic glut).
- A large number of our products come from China which may affect our business. Property taxes keep increasing. Art education in schools is decreasing. There’s nothing good on the horizon. Small retailers keep going out of business.
- We think the political uncertainty is definitely causing some concerns with buyers. As we come into the spring, our business typically picks up, so that somewhat masks what is going on. April has the potential to be tough because our vendors are telling us to expect big tariff surcharges, and customers are already balking at higher prices. Lots of uncertainty. We are being cautious with our inventory and attempting to draw down certain segments.
- Tariffs and uncertainty about the economy and markets has slowed our business in March.
- Our service departments are seeing a light decrease in service traffic at the dealerships. There is a softening of expenditures from the retail customer on vehicle maintenance, it appears.
- Everybody is talking about tariffs. It's so uncertain.
- Customers are uneasy about the future, causing them to delay or not buy appliances.
- Tariffs remain a concern since many medications and medical supplies are made in China.
- We are getting notifications from vendors that prices will be increasing by 3 to 5 percent.
- We feel like the overall business climate has improved with the new administration, but there is still some uncertainty. Maybe people are still holding back to see what happens with the economy, tariff challenges, war, etc.
Historical Data
Historical data can be downloaded dating back to January 2007.
Indexes
Download indexes for all indicators. For the definitions of all variables, see data definitions.
Texas Service Sector Outlook Survey |
Texas Retail Outlook Survey |
| Unadjusted | Unadjusted |
| Seasonally adjusted | Seasonally adjusted |
All Data
Download indexes and components of the indexes (percentage of respondents reporting increase, decrease, or no change). For the definitions of all variables, see data definitions.
Texas Service Sector Outlook Survey |
Texas Retail Outlook Survey |
| Unadjusted | Unadjusted |
| Seasonally adjusted | Seasonally adjusted |
Questions regarding the Texas Service Sector Outlook Survey can be addressed to Jesus Cañas at jesus.canas@dal.frb.org.
Sign up for our email alert to be automatically notified as soon as the latest Texas Service Sector Outlook Survey is released on the web.