Texas Manufacturing Outlook Survey

Growth in Texas manufacturing picks up pace in January; outlooks improve further
For this month’s survey, Texas business executives were asked supplemental questions on the labor market, federal government policies and financial conditions. Results for these questions from the Texas Manufacturing Outlook Survey, Texas Service Sector Outlook Survey and Texas Retail Outlook Survey have been released together. Read the special questions results.
This month’s data release also includes annual seasonal factor revisions. Once per year, the Federal Reserve Bank of Dallas revises the historical data for the Texas Manufacturing Outlook Survey after calculating new seasonal adjustment factors. Annual seasonal revisions result in slight changes in the seasonally adjusted series. Read more information on seasonal adjustment.
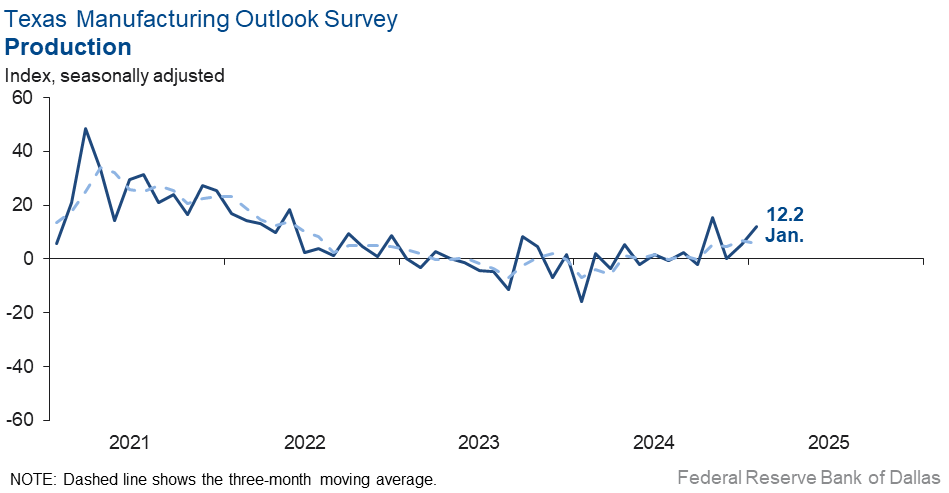
Texas factory activity picked up notably in January, according to business executives responding to the Texas Manufacturing Outlook Survey. The production index, a key measure of state manufacturing conditions, rose seven points to 12.2.
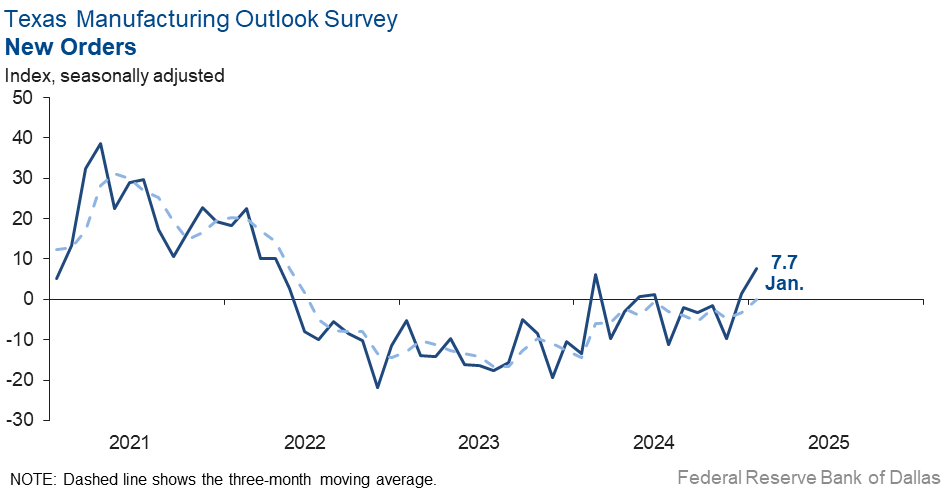
Other measures of manufacturing activity also moved higher this month. The new orders index rose six points to 7.7, its highest level since April 2022. The capacity utilization and shipments indexes moved up to 5.0 and 8.7, respectively, after near-zero readings in December.
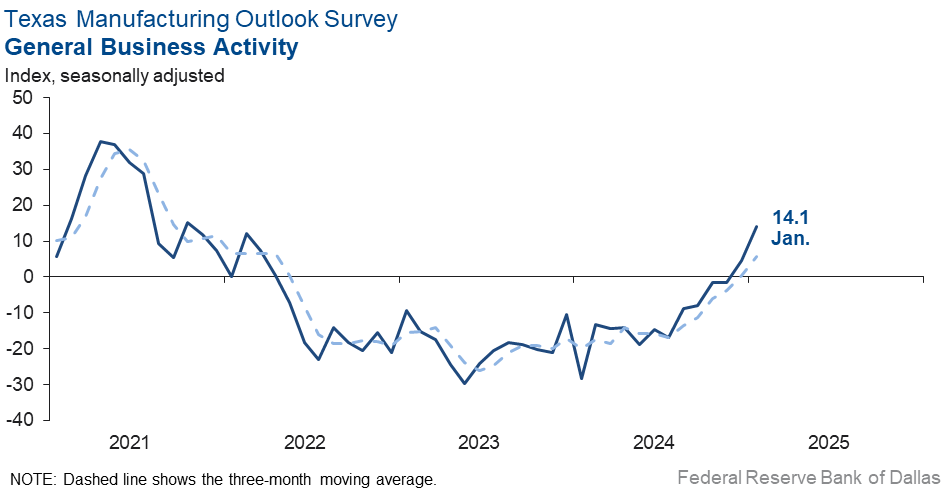
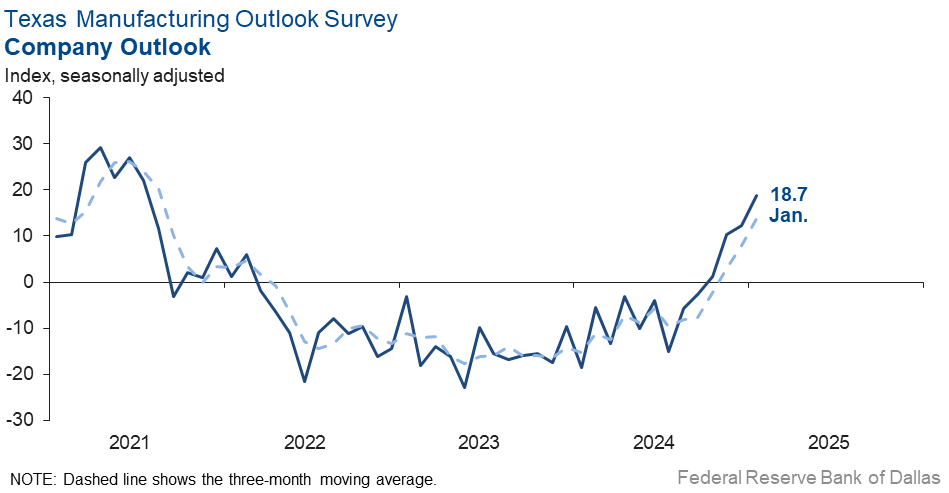
Perceptions of broader business conditions continued to improve in January. The general business activity index jumped 10 points to 14.1, its highest reading since October 2021. The company outlook index increased to 18.7, also a multiyear high. The outlook uncertainty index remained near zero, indicating uncertainty is neither rising nor falling.
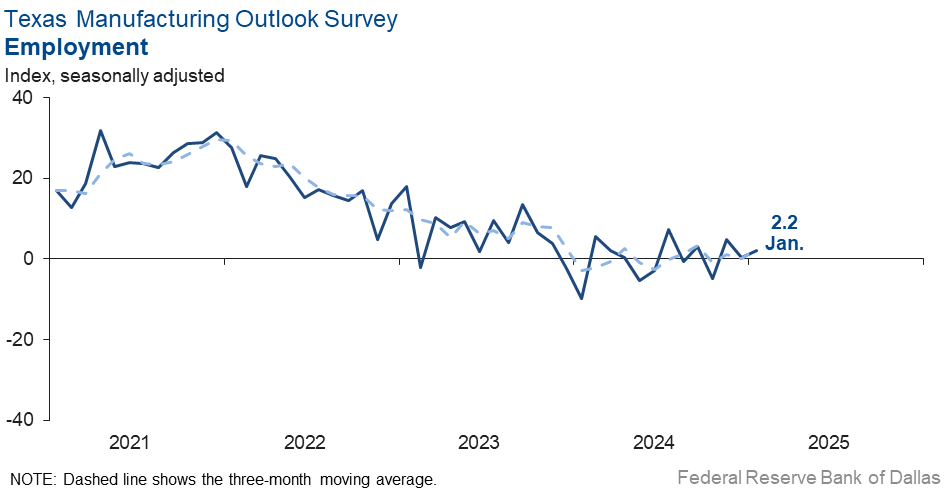
Labor market measures suggested employment and workweek length grew slightly this month. The employment index inched up two points to 2.2. Fourteen percent of firms noted net hiring, while 12 percent noted net layoffs. The hours worked index edged up to 1.9 from -0.5.
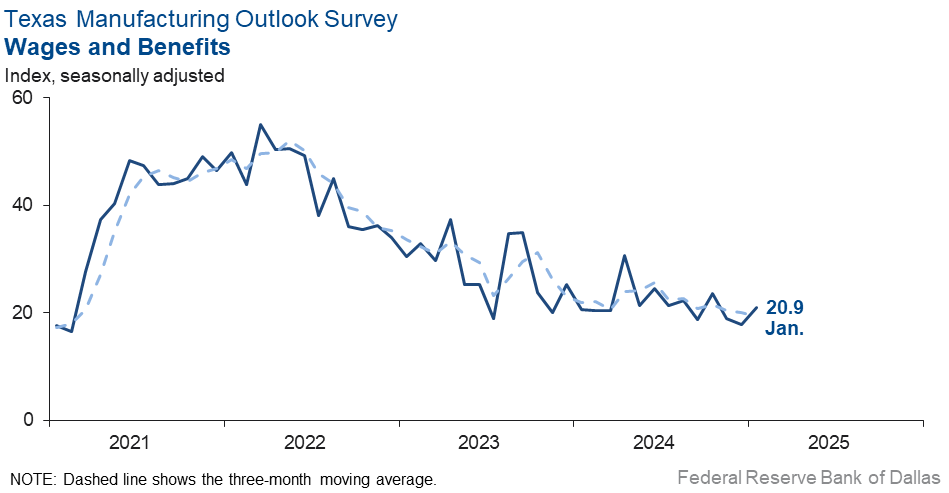
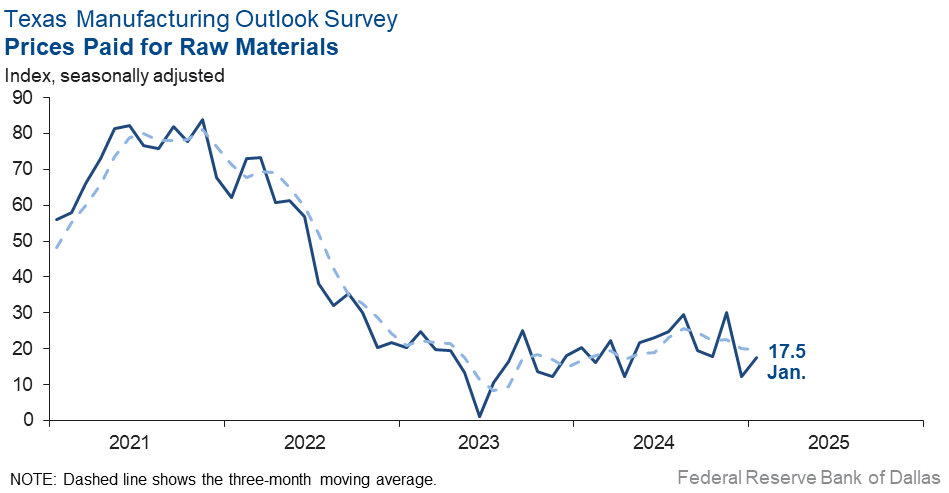
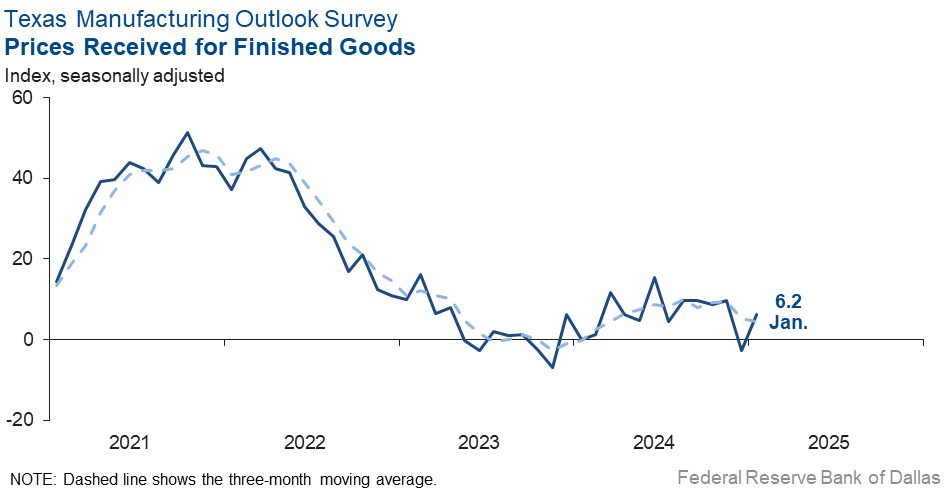
Upward pressure on prices and wages increased this month. The raw materials prices index rose five points to 17.5, and the finished goods prices index rose nine points to 6.2. The wages and benefits index ticked up to 20.9.
Expectations are for increased manufacturing activity six months from now. The future production index pushed up to 44.8 from 34.1. The future general business activity index rose to 35.5 from 20.6. Most other indexes of future manufacturing activity also pushed higher this month.
Next release: Monday, February 24
Data were collected Jan. 14–22, and 83 of the 122 Texas manufacturers surveyed submitted a response. The Dallas Fed conducts the Texas Manufacturing Outlook Survey monthly to obtain a timely assessment of the state’s factory activity. Firms are asked whether output, employment, orders, prices and other indicators increased, decreased or remained unchanged over the previous month.
Survey responses are used to calculate an index for each indicator. Each index is calculated by subtracting the percentage of respondents reporting a decrease from the percentage reporting an increase. When the share of firms reporting an increase exceeds the share reporting a decrease, the index will be greater than zero, suggesting the indicator has increased over the prior month. If the share of firms reporting a decrease exceeds the share reporting an increase, the index will be below zero, suggesting the indicator has decreased over the prior month. An index will be zero when the number of firms reporting an increase is equal to the number of firms reporting a decrease. Data have been seasonally adjusted as necessary.
Results summary
Historical data are available from June 2004 to the most current release month.
| Business Indicators Relating to Facilities and Products in Texas Current (versus previous month) | ||||||||
| Indicator | Jan Index | Dec Index | Change | Series Average | Trend* | % Reporting Increase | % Reporting No Change | % Reporting Decrease |
Production | 12.2 | 5.3 | +6.9 | 9.7 | 4(+) | 29.1 | 54.0 | 16.9 |
Capacity Utilization | 5.0 | –0.9 | +5.9 | 7.6 | 1(+) | 23.4 | 58.2 | 18.4 |
New Orders | 7.7 | 1.5 | +6.2 | 5.0 | 2(+) | 31.1 | 45.6 | 23.4 |
Growth Rate of Orders | 1.0 | –3.1 | +4.1 | –0.8 | 1(+) | 23.5 | 54.0 | 22.5 |
Unfilled Orders | –4.7 | –6.5 | +1.8 | –2.4 | 5(–) | 9.8 | 75.7 | 14.5 |
Shipments | 8.7 | 0.7 | +8.0 | 8.0 | 2(+) | 26.9 | 55.0 | 18.2 |
Delivery Time | –4.0 | –2.5 | –1.5 | 0.7 | 22(–) | 7.6 | 80.8 | 11.6 |
Finished Goods Inventories | –8.5 | 1.1 | –9.6 | –3.2 | 1(–) | 12.2 | 67.1 | 20.7 |
Prices Paid for Raw Materials | 17.5 | 12.1 | +5.4 | 27.1 | 57(+) | 22.0 | 73.5 | 4.5 |
Prices Received for Finished Goods | 6.2 | –2.6 | +8.8 | 8.6 | 1(+) | 11.5 | 83.3 | 5.3 |
Wages and Benefits | 20.9 | 17.9 | +3.0 | 21.2 | 57(+) | 23.2 | 74.6 | 2.3 |
Employment | 2.2 | 0.4 | +1.8 | 7.4 | 3(+) | 13.9 | 74.4 | 11.7 |
Hours Worked | 1.9 | –0.5 | +2.4 | 3.2 | 1(+) | 13.1 | 75.6 | 11.2 |
Capital Expenditures | 13.0 | 10.9 | +2.1 | 6.6 | 16(+) | 21.1 | 70.7 | 8.1 |
| General Business Conditions Current (versus previous month) | ||||||||
| Indicator | Jan Index | Dec Index | Change | Series Average | Trend** | % Reporting Improved | % Reporting No Change | % Reporting Worsened |
Company Outlook | 18.7 | 12.3 | +6.4 | 4.6 | 4(+) | 25.8 | 67.2 | 7.1 |
General Business Activity | 14.1 | 4.5 | +9.6 | 0.7 | 2(+) | 24.0 | 66.2 | 9.9 |
| Indicator | Jan Index | Dec Index | Change | Series Average | Trend* | % Reporting Increase | % Reporting No Change | % Reporting Decrease |
Outlook Uncertainty | 1.3 | 1.2 | +0.1 | 16.6 | 45(+) | 22.0 | 57.3 | 20.7 |
| Business Indicators Relating to Facilities and Products in Texas Future (six months ahead) | ||||||||
| Indicator | Jan Index | Dec Index | Change | Series Average | Trend* | % Reporting Increase | % Reporting No Change | % Reporting Decrease |
Production | 44.8 | 34.1 | +10.7 | 36.4 | 57(+) | 51.6 | 41.7 | 6.8 |
Capacity Utilization | 41.9 | 34.0 | +7.9 | 33.2 | 57(+) | 49.0 | 43.9 | 7.1 |
New Orders | 46.3 | 37.6 | +8.7 | 33.8 | 27(+) | 50.7 | 44.9 | 4.4 |
Growth Rate of Orders | 43.0 | 29.0 | +14.0 | 25.0 | 20(+) | 48.1 | 46.8 | 5.1 |
Unfilled Orders | 12.9 | 1.7 | +11.2 | 2.9 | 6(+) | 19.7 | 73.5 | 6.8 |
Shipments | 47.8 | 35.9 | +11.9 | 34.8 | 57(+) | 52.7 | 42.4 | 4.9 |
Delivery Time | 3.7 | 2.1 | +1.6 | –1.3 | 2(+) | 10.1 | 83.6 | 6.4 |
Finished Goods Inventories | –4.0 | –1.3 | –2.7 | –0.1 | 5(–) | 10.7 | 74.7 | 14.7 |
Prices Paid for Raw Materials | 39.9 | 25.1 | +14.8 | 33.3 | 58(+) | 42.3 | 55.2 | 2.4 |
Prices Received for Finished Goods | 35.6 | 25.9 | +9.7 | 20.9 | 57(+) | 39.5 | 56.6 | 3.9 |
Wages and Benefits | 36.7 | 39.6 | –2.9 | 39.3 | 57(+) | 36.7 | 63.3 | 0.0 |
Employment | 27.7 | 29.3 | –1.6 | 22.9 | 56(+) | 32.5 | 62.7 | 4.8 |
Hours Worked | 9.2 | 12.1 | –2.9 | 8.8 | 10(+) | 14.7 | 79.8 | 5.5 |
Capital Expenditures | 27.3 | 23.3 | +4.0 | 19.4 | 56(+) | 32.6 | 62.1 | 5.3 |
| General Business Conditions Future (six months ahead) | ||||||||
| Indicator | Jan Index | Dec Index | Change | Series Average | Trend** | % Reporting Increase | % Reporting No Change | % Reporting Worsened |
Company Outlook | 36.1 | 18.8 | +17.3 | 18.5 | 14(+) | 44.0 | 48.1 | 7.9 |
General Business Activity | 35.5 | 20.6 | +14.9 | 12.5 | 8(+) | 44.1 | 47.3 | 8.6 |
*Shown is the number of consecutive months of expansion or contraction in the underlying indicator. Expansion is indicated by a positive index reading and denoted by a (+) in the table. Contraction is indicated by a negative index reading and denoted by a (–) in the table.
**Shown is the number of consecutive months of improvement or worsening in the underlying indicator. Improvement is indicated by a positive index reading and denoted by a (+) in the table. Worsening is indicated by a negative index reading and denoted by a (–) in the table.
Data have been seasonally adjusted as necessary.
Comments from survey respondents
These comments are from respondents’ completed surveys and have been edited for publication.
- The outlook is improved because we are subcontractors to a large government grant that got a funding notice. There are some worries—one being the impact of the new administration on the existing grant structure.
- There are clear signs of markets starting to inflect up with the exception of automobiles. The China automobile market remains strong, all other markets are weak, and Europe is very weak.
- We are seeing generally good spirits among our customers. We continue to see pushback against price increases, and people are more aware of pricing than they had been in the past, especially during 2021–22. We continue to invest in new equipment to increase productivity. Wages continue to increase due to inflation. We definitely see more people looking for work than in the past, so our voluntary turnover is almost zero.
- We saw demand and production dip in November/December 2024 and are expecting a tick up in the first quarter. We do not expect a significant full year increase in production this year versus 2024.
- We are still waiting on some large projects to be released that have been on hold.
- We are not able to forecast even six months forward. Any changes will be based off the Fed, economy, and inflation. Two or three rate cuts in 2025 should offer sustained betterment. No further rate cuts and timing a longer pause than expected might be the best path forward for inflation but will definitely depress betterment for our business and customer demand.
- New customers and new orders from existing customers are driving production volume growth.
- Tariffs, tariffs, tariffs.
- The start of the year has been extremely positive with a sharp increase in volume of new orders received. With a positive business environment, we expect this trend to continue.
- There is a lot of chatter in the market about President Trump’s plans. We believe that they will turn into a robust economy over the next few months.
- The pall has lifted. Our industry is absolutely giddy with November's election outcome and the proposed Cabinet members hopefully soon to be confirmed. Personally, I feel our state is more optimistic now that an open border will close, common sense in policymaking will prevail, and free enterprise will be the beneficiary. Our phones are thankfully ringing like they haven't in quite some time.
- Inflation is killing us. With finished goods inventory and raw material inventories both substantially reduced, our cost of operation increased over 20 percent in 2024, which is disastrous considering we cannot raise prices to offset the costs.
- 2025 is going to be great.
- We have experienced weakness in orders for the last four weeks. Our outlook is starting to be affected.
- We are still in a low volume of activity funk with signs of things picking up soon. It's crazy how slow we have been over the past four months. Right now we are not hearing about many price increases; however, with the threat of tariffs, if they do occur, we will be forced to pass them through since our raw material costs subject to tariffs will increase.
- We have seen sales dip from December but improve year over year (to be expected as December is one of our busiest months). It seems peer companies and consumers are more optimistic about the economy this year versus last quarter but we aren't sure the impact potential tariffs may have on our raw materials.
- We are starting to see an improvement in the confidence of our customers with the new administration.
Historical Data
Historical data can be downloaded dating back to June 2004.
Indexes
Download indexes for all indicators. For the definitions of all variables, see Data Definitions.
| Unadjusted |
| Seasonally adjusted |
All Data
Download indexes and components of the indexes (percentage of respondents reporting increase, decrease, or no change). For the definitions of all variables, see Data Definitions.
| Unadjusted |
| Seasonally adjusted |
Questions regarding the Texas Business Outlook Surveys can be addressed to Emily Kerr at emily.kerr@dal.frb.org.
Sign up for our email alert to be automatically notified as soon as the latest Texas Manufacturing Outlook Survey is released on the web.