
Is inflation still slowing? Early 2025 data pivotal to outlook
January inflation data were stronger in 2023 and 2024 than forecasters expected, even after more encouraging results had been reported for the ends of 2022 and 2023. Rather than reflecting seasonal adjustment difficulties, this pattern may be caused by a large share of firms changing prices at the start of a new year.
If this is the case, first-quarter inflation data may exhibit greater persistence and sensitivity to swings in the business cycle. Whether early 2025 monthly inflation rates are similar to late 2024 or a repeat of the previous years’ surprises will be key to assessing the underlying momentum of inflation ahead.
Recent pattern of faster inflation early in the year
Inflation is typically measured as the change in a price index over a year. In thinking about the momentum and trajectory of inflation, it is also useful to consider how prices have changed over a shorter period, such as one month. These shorter-horizon inflation rates are seasonally adjusted (typical variation over the calendar year is removed from the series) and annualized (converted to the annual inflation rate if the increase was repeated for a full year).
Over the past three years, lower monthly inflation readings late in the calendar year have raised optimism that inflation was progressing toward the Federal Open Market Committee’s goal of a 2 percent annual rate (Chart 1).
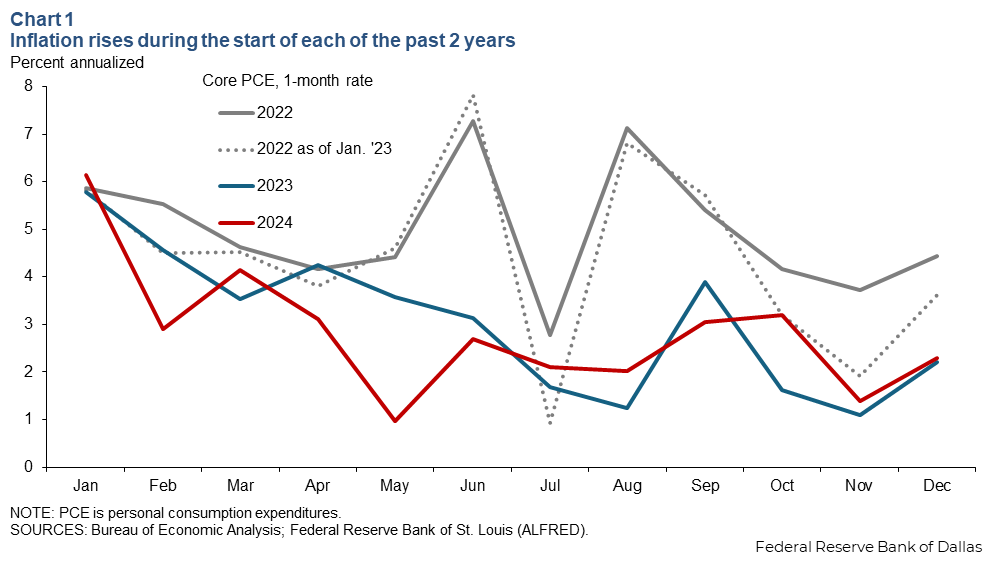
The personal consumption expenditures (PCE) price index, a measure of inflation, undergoes a series of revisions. Upon first release, annualized monthly core PCE rates (the growth rate of the personal consumption expenditures excluding food and energy price index) were around 3 percent from October to December 2022. These inflation readings were later revised higher, and January 2023 annualized monthly core PCE inflation was around 6 percent, surprising forecasters. Monthly inflation rates gradually slowed during 2023 and averaged below 2 percent in the final three months of the year.
Again, January 2024 brought a large upside surprise with annualized monthly core PCE inflation near 6 percent. Monthly core PCE inflation rates in 2024 roughly tracked 2023, and the 12-month core PCE inflation rate ended the year at 2.8 percent in December, only slightly below its 2023 end-of-year level of 3.0 percent.
Twelve-month inflation rates reflect an average of monthly inflation over the year. While the 12-month core PCE inflation rate stagnated, it was largely driven by the fast pace of monthly inflation early in 2024. Monthly core PCE inflation in the second half of 2024 was, once again, closer to 2 percent.
If monthly inflation rates average 2 percent over the early months of 2025, high monthly inflation rates from early 2024 would fall out of the 12-month window and show rapid progress. In this case, the 12-month rate would decline to around 2.1 percent by April. Alternatively, if the fast pace of monthly inflation from last year is repeated, the 12-month rate would be unchanged at 2.8 percent.
Most forecasters expect something in between these two scenarios, with a somewhat stronger January than the previous several months, and the 12-month rate declining to around 2.5 percent.
Upcoming inflation releases may be pivotal in assessing the trajectory of inflation. Is there reason to think they will be similarly strong as early 2023 and 2024?
Economists point to residual seasonality
Some analysts have attributed the pattern of stronger monthly inflation in January to residual seasonality, even before the last several years of high inflation. While the Bureau of Labor Statistics and Bureau of Economic Analysis adjust for the regular seasonal patterns in price changes, this is done to each item or category individually, and the categories are then aggregated to an overall price index. Because of this process, it is possible for a seasonal pattern to emerge at the aggregate level that is too small or inconsistent to be statistically significant at the more granular level.
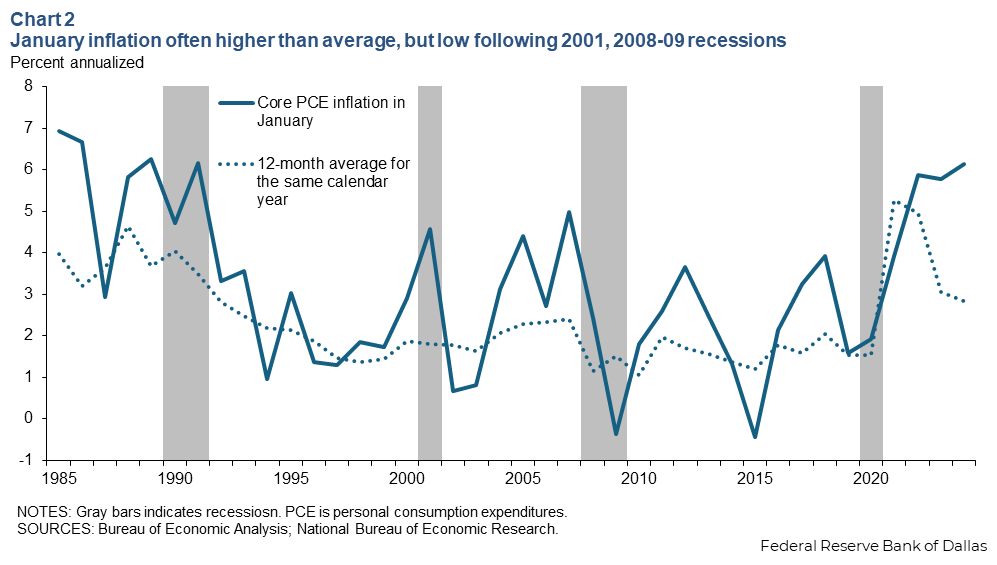
From 2000 to 2024, January core PCE inflation rates averaged 2.9 percent, compared with 2.1 percent for all months. However variation in January is also wide, and tests for residual seasonality show it is not statistically significant. Seasonal adjustment removes regular seasonal patterns, but that may not be what is happening in the January inflation data.
Chart 2 shows that January core PCE often runs hotter than the rest of the year. However, there are several years when it ran notably cooler, such as in 2002, 2003, 2009 and 2015. Three of these years fall during or immediately following recessions, raising the question whether January inflation is more cyclical rather than consistently higher in other months.
A similar explanation could be that a firm’s pricing needs build up over the year, and the turn of the calendar provides a clear date to implement price changes. This provides a mechanism by which January inflation may be more sensitive to past inflation—or more persistent.
First quarter inflation more sensitive to persistence, change in slack
To test for these effects, a regression is estimated to predict one-quarter core PCE inflation using lagged four-quarter core PCE inflation, a measure of labor market slack and the change in labor market slack over the last year.
Inflation rates are detrended using forecasters’ long-run inflation expectations. The coefficients in the regression, including the constant, are allowed to differ by quarter. The estimation sample covers 1985 through 2024, excluding 2020 and 2021 so the pandemic and initial inflation surge do not dominate the estimation results. The slack variable is an aggregate of seven labor market tightness indicators scaled to match the Congressional Budget Office’s estimated unemployment gap.
Chart 3 shows the estimated coefficients by quarter. The left-most panel shows the constant is highest in the first quarter, reflecting a somewhat higher core inflation average early in the year.
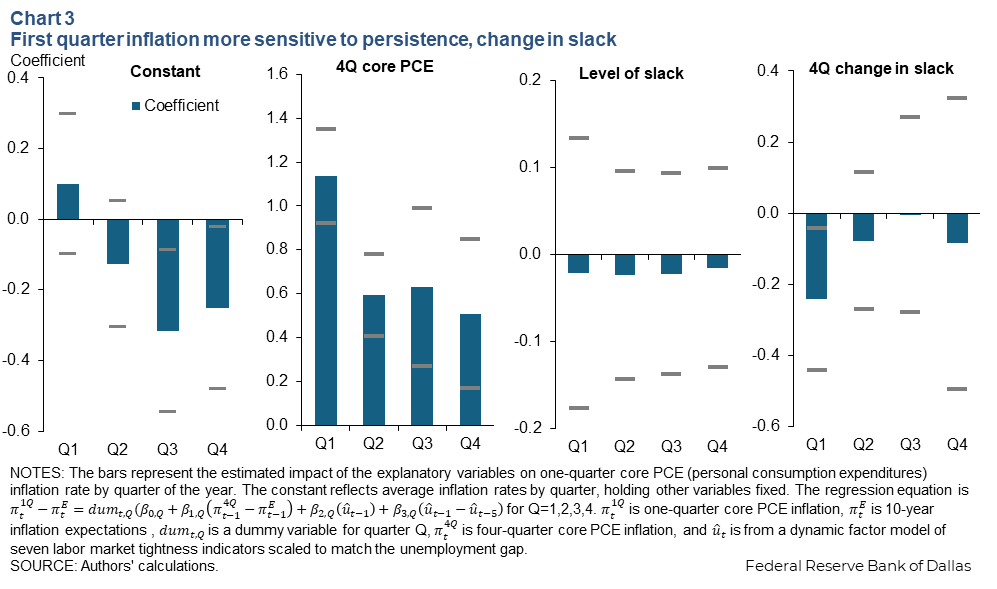
The right two panels show the level of labor market slack does not have much of a predictive effect on inflation in any quarter. There is a statistically significant negative coefficient on the change in slack for the first quarter data (right-most chart) that is not present in the other quarters. This is consistent with the observation that January inflation has been especially weak around recessions and otherwise faster than in other months.
The second panel shows an even more stark contrast for the coefficients on lagged four-quarter core PCE inflation. The coefficient is near 1 for the first-quarter data, indicating a strong persistence effect, and around 0.5 in other quarters. When inflation has been elevated over the past year, it is more likely to present itself in the first quarter than in other quarters.
Stronger sensitivity in the first quarter to persistence and changes in the business cycle may be driven by a higher likelihood for firms to change prices at the start of the year. This may reflect annual repricing decisions to catch up with higher input costs. But if demand has weakened, businesses may be unable to pass on those costs to consumers.
Near-term outlook for a small bump, but caution is reasonable
The regression below predicts mildly elevated core PCE inflation in the first quarter of 2025, at around 2.7 percent annualized, as greater persistence in first-quarter inflation is somewhat offset by easing labor market tightness over the past year (Chart 4). If the labor market remains stable at current conditions and long-run inflation expectations remain anchored, this regression would predict more muted inflation readings in the rest of the year and near 2 percent for 2025 as a whole.

However, caution may still be warranted until early 2025 inflation readings are released. The regression underpredicted the first quarter of 2024, and there is uncertainty regarding how much the labor market has actually cooled. The greater sensitivity of first-quarter core PCE inflation to persistence and the state of the business cycle should render those months of data more informative about the underlying momentum of inflation.
If it turns out inflation is more persistent than previously thought or overall demand is too elevated for inflation to converge to 2 percent, the results suggest that such concerns would more likely manifest early in the year. Further, the slower monthly pace in the second half of the year is not necessarily as encouraging as similar readings would be early in the year.
If instead early 2025 inflation data are subdued, similar to late 2024, 12-month inflation rates would make considerable progress toward the 2 percent goal in only a few months and signal economic conditions likely consistent with price stability.
About the authors

Tyler Atkinson is a senior business economist in the Research Department of the Federal Reserve Bank of Dallas.

Ron Mau is a senior business economist at the Federal Reserve Bank of Dallas.