
Texas Service Sector Outlook Survey
Growth in Texas service sector activity continues despite surge in uncertainty
For this month’s survey, Texas business executives were asked supplemental questions on demand, labor and U.S. trade policy. Results for these questions from the Texas Manufacturing Outlook Survey, Texas Service Sector Outlook Survey and Texas Retail Outlook Survey have been released together. Read the special questions results.
Texas service sector activity increased in February, according to business executives responding to the Texas Service Sector Outlook Survey. The revenue index, a key measure of state service sector conditions, ticked up three points to 8.2, indicative of a below-average pace of growth.
Labor market measures suggested no growth in employment and workweeks in February. The employment index edged up to -0.1 from -1.4, with the near-zero reading suggestive of no change in employment last month. The part-time employment index fell four points to 1.0, while the hours-worked index decreased to -1.0 from 3.6.
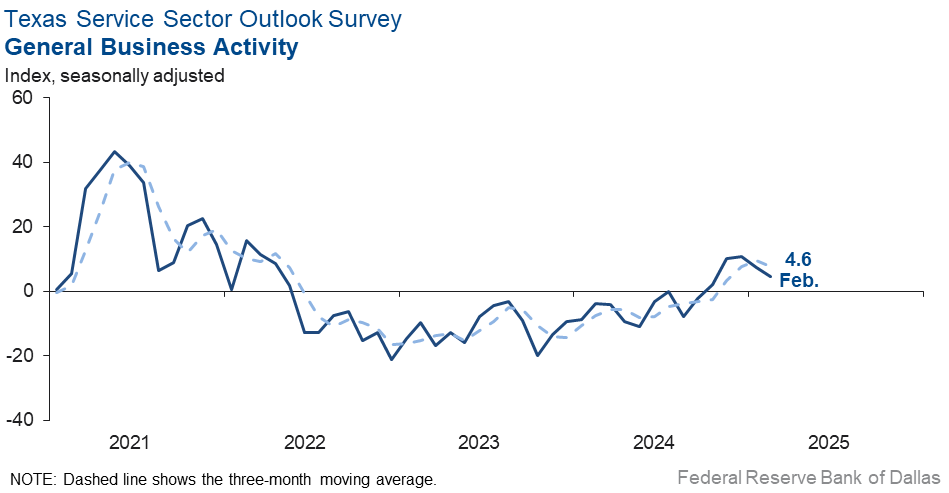
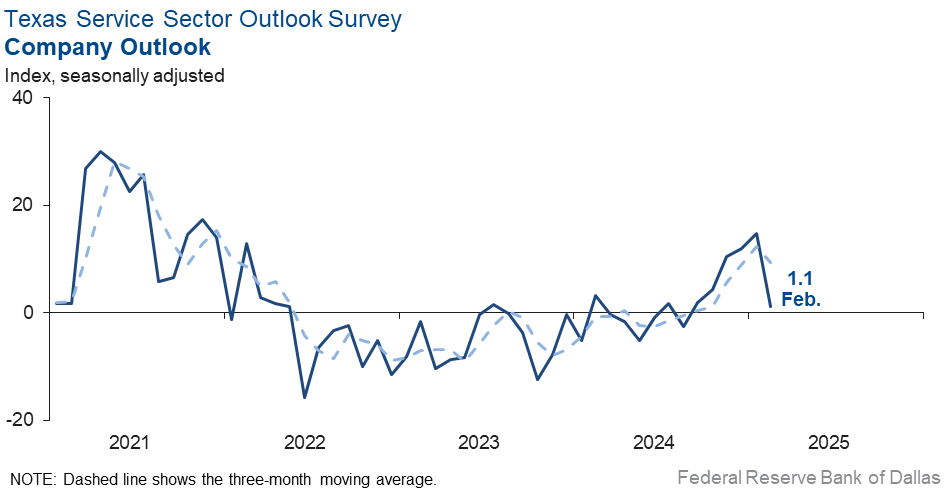
Optimism around the outlook faded and uncertainty rose in February. The general business activity index remained positive but slipped to 4.6 from 7.4. Outlooks retreated sharply as the company outlook index fell 14 points to a near-zero reading of 1.1. The outlook uncertainty index shot up to 14.2 from 3.0.
Selling price and wage growth eased, while input price pressures held steady in February. The selling prices index fell six points to 7.9, while the input prices index was unchanged at 28.0. The wages and benefits index fell five points to 11.1.
Respondents’ expectations regarding future business activity also downshifted in February. The future general business activity index remained in positive territory but fell from 31.2 to 12.3, while the future revenue index dropped 11 points to 43.9. Other future service-sector activity indexes such as employment and capital expenditures also fell but remained in positive territory, reflecting expectations for slower growth in the next six months.

Texas Retail Outlook Survey
Texas retail sales growth recovers
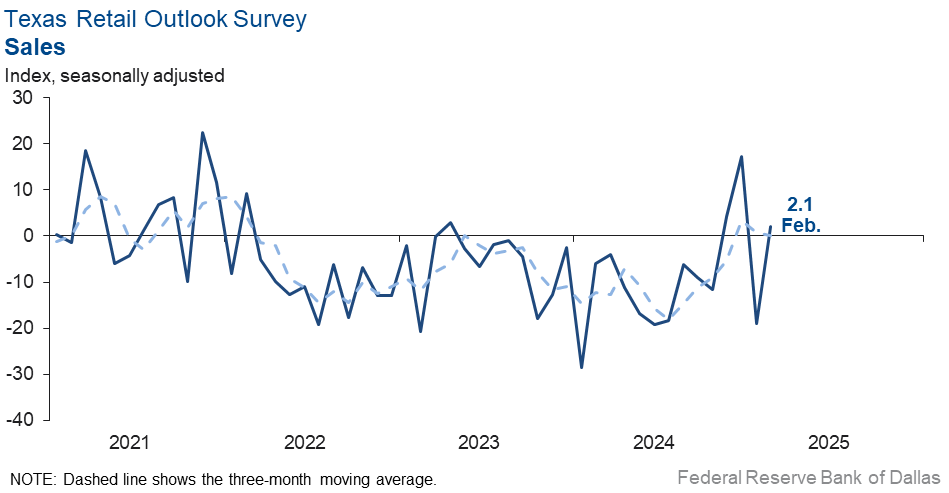
Retail sales activity increased in February, according to business executives responding to the Texas Retail Outlook Survey. The sales index, a key measure of state retail activity, increased to 2.1 from -19.0. Retailers’ inventories fell over the month, with the February index at -4.8, down from 11.5 in January.
Retail sector labor market indicators suggested flat employment while workweeks stabilized. The employment index increased to -1.5 from -9.1. The part-time employment index fell four points to 2.8, and the hours-worked index increased four points to -0.4
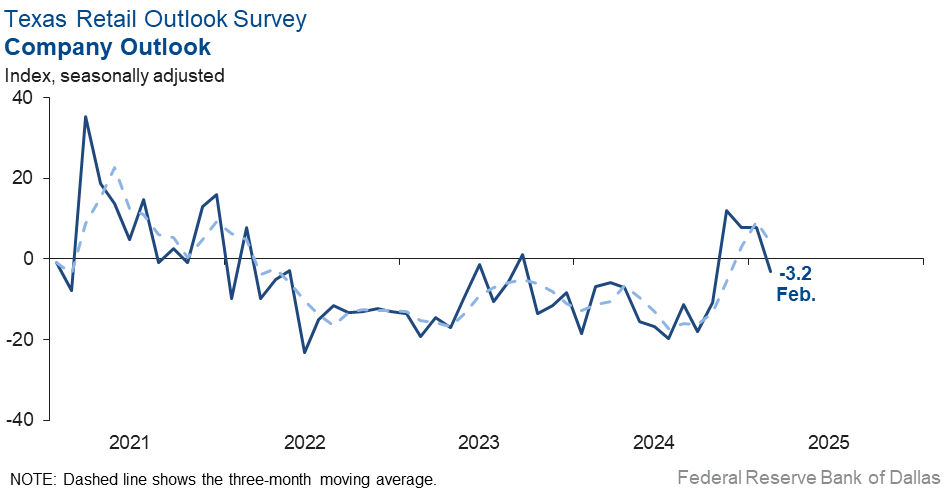
Perceptions of broader business conditions worsened in February. The general business activity index remained unchanged at -4.9, while the company outlook index fell to -3.2 from 7.7. Uncertainty about the outlooks increased, with the index rising eight points to 14.0.
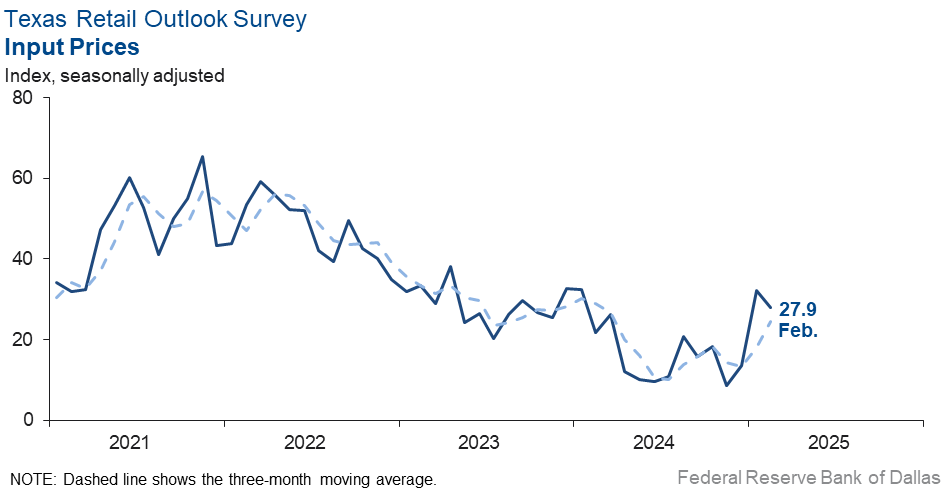
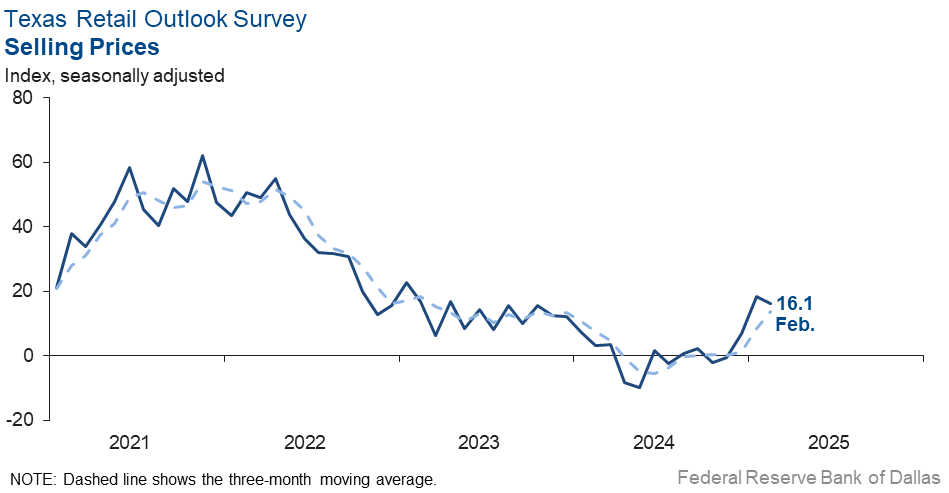
Price pressures eased some, while wages continued to increase in February. The selling price index fell two points to 16.1, while the input price index decreased four points to 27.9. The wages and benefits index increased three points to 15.0.
Expectations for future retail sector business conditions downshifted sharply in February. The future general business activity index remained positive but fell 16 points to 3.7, while the future sales index fell 18 points to 34.1. Both the future employment index and the future capital expenditures index fell but remained in positive territory, suggesting much more modest improvement in retail activity in the next six months.
Next release: April 1, 2025
Data were collected February 11–19, and 255 of the 379 Texas service sector business executives surveyed submitted responses. The Dallas Fed conducts the Texas Service Sector Outlook Survey monthly to obtain a timely assessment of the state’s service sector activity. Firms are asked whether revenue, employment, prices, general business activity and other indicators increased, decreased or remained unchanged over the previous month.
Survey responses are used to calculate an index for each indicator. Each index is calculated by subtracting the percentage of respondents reporting a decrease from the percentage reporting an increase. When the share of firms reporting an increase exceeds the share reporting a decrease, the index will be greater than zero, suggesting the indicator has increased over the prior month. If the share of firms reporting a decrease exceeds the share reporting an increase, the index will be below zero, suggesting the indicator has decreased over the prior month. An index will be zero when the number of firms reporting an increase is equal to the number of firms reporting a decrease. Data have been seasonally adjusted as necessary.
Data have been seasonally adjusted as necessary.
Texas Service Sector Outlook Survey
Historical data are available from January 2007 to the most current release month.
| Business Indicators Relating to Facilities and Products in Texas Current (versus previous month) | ||||||||
| Indicator | Feb Index | Jan Index | Change | Series Average | Trend* | % Reporting Increase | % Reporting No Change | % Reporting Decrease |
Revenue | 8.2 | 5.7 | +2.5 | 10.6 | 13(+) | 27.4 | 53.4 | 19.2 |
Employment | –0.1 | –1.4 | +1.3 | 6.1 | 2(–) | 12.0 | 75.9 | 12.1 |
Part–Time Employment | 1.0 | 4.5 | –3.5 | 1.4 | 2(+) | 4.4 | 92.2 | 3.4 |
Hours Worked | –1.0 | 3.6 | –4.6 | 2.6 | 1(–) | 5.0 | 89.0 | 6.0 |
Wages and Benefits | 11.1 | 15.7 | –4.6 | 15.7 | 57(+) | 15.0 | 81.1 | 3.9 |
Input Prices | 28.0 | 27.4 | +0.6 | 27.8 | 58(+) | 32.4 | 63.2 | 4.4 |
Selling Prices | 7.9 | 13.7 | –5.8 | 7.6 | 55(+) | 16.6 | 74.7 | 8.7 |
Capital Expenditures | 10.4 | 12.5 | –2.1 | 9.9 | 55(+) | 13.8 | 82.8 | 3.4 |
| General Business Conditions Current (versus previous month) | ||||||||
| Indicator | Feb Index | Jan Index | Change | Series Average | Trend** | % Reporting Improved | % Reporting No Change | % Reporting Worsened |
Company Outlook | 1.1 | 14.8 | –13.7 | 4.4 | 6(+) | 19.1 | 62.9 | 18.0 |
General Business Activity | 4.6 | 7.4 | –2.8 | 2.4 | 5(+) | 18.2 | 68.2 | 13.6 |
| Indicator | Feb Index | Jan Index | Change | Series Average | Trend* | % Reporting Increase | % Reporting No Change | % Reporting Decrease |
Outlook Uncertainty | 14.2 | 3.0 | +11.2 | 13.0 | 45(+) | 29.8 | 54.6 | 15.6 |
| Business Indicators Relating to Facilities and Products in Texas Future (six months ahead) | ||||||||
| Indicator | Feb Index | Jan Index | Change | Series Average | Trend* | % Reporting Increase | % Reporting No Change | % Reporting Decrease |
Revenue | 43.9 | 55.0 | –11.1 | 37.5 | 58(+) | 56.1 | 31.7 | 12.2 |
Employment | 25.7 | 35.7 | –10.0 | 23.1 | 58(+) | 37.3 | 51.1 | 11.6 |
Part–Time Employment | 5.6 | 7.1 | –1.5 | 6.6 | 9(+) | 11.3 | 83.0 | 5.7 |
Hours Worked | 9.5 | 11.8 | –2.3 | 5.9 | 58(+) | 13.6 | 82.3 | 4.1 |
Wages and Benefits | 37.3 | 45.6 | –8.3 | 37.5 | 58(+) | 40.6 | 56.1 | 3.3 |
Input Prices | 42.9 | 43.4 | –0.5 | 44.3 | 218(+) | 48.3 | 46.2 | 5.4 |
Selling Prices | 22.8 | 24.1 | –1.3 | 24.5 | 58(+) | 32.4 | 58.0 | 9.6 |
Capital Expenditures | 20.3 | 24.2 | –3.9 | 22.8 | 57(+) | 26.4 | 67.5 | 6.1 |
| General Business Conditions Future (six months ahead) | ||||||||
| Indicator | Feb Index | Jan Index | Change | Series Average | Trend** | % Reporting Improved | % Reporting No Change | % Reporting Worsened |
Company Outlook | 13.3 | 35.4 | –22.1 | 15.7 | 15(+) | 29.8 | 53.7 | 16.5 |
General Business Activity | 12.3 | 31.2 | –18.9 | 12.2 | 10(+) | 29.9 | 52.5 | 17.6 |
Historical data are available from January 2007 to the most current release month.
| Business Indicators Relating to Facilities and Products in Texas Retail (versus previous month) | ||||||||
| Indicator | Feb Index | Jan Index | Change | Series Average | Trend* | % Reporting Increase | % Reporting No Change | % Reporting Decrease |
| Retail Activity in Texas | ||||||||
Sales | 2.1 | –19.0 | +21.1 | 3.2 | 1(+) | 26.8 | 48.5 | 24.7 |
Employment | –1.5 | –9.1 | +7.6 | 1.5 | 2(–) | 8.2 | 82.1 | 9.7 |
Part–Time Employment | 2.8 | 6.4 | –3.6 | –1.5 | 4(+) | 3.7 | 95.4 | 0.9 |
Hours Worked | –0.4 | –4.8 | +4.4 | –2.2 | 3(–) | 2.4 | 94.8 | 2.8 |
Wages and Benefits | 15.0 | 12.2 | +2.8 | 11.2 | 55(+) | 15.0 | 85.0 | 0.0 |
Input Prices | 27.9 | 32.2 | –4.3 | 22.5 | 58(+) | 40.4 | 47.0 | 12.5 |
Selling Prices | 16.1 | 18.5 | –2.4 | 13.1 | 3(+) | 28.8 | 58.5 | 12.7 |
Capital Expenditures | 6.8 | 6.4 | +0.4 | 7.6 | 4(+) | 9.7 | 87.4 | 2.9 |
Inventories | –4.8 | 11.5 | –16.3 | 2.8 | 1(–) | 15.0 | 65.2 | 19.8 |
| Companywide Retail Activity | ||||||||
Companywide Sales | 15.0 | –7.0 | +22.0 | 4.5 | 1(+) | 27.6 | 59.8 | 12.6 |
Companywide Internet Sales | 7.4 | –7.1 | +14.5 | 3.9 | 1(+) | 16.4 | 74.6 | 9.0 |
| General Business Conditions, Retail Current (versus previous month) | ||||||||
| Indicator | Feb Index | Jan Index | Change | Series Average | Trend** | % Reporting Improved | % Reporting No Change | % Reporting Worsened |
Company Outlook | –3.2 | 7.7 | –10.9 | 1.4 | 1(–) | 16.0 | 64.8 | 19.2 |
General Business Activity | –4.9 | –4.5 | –0.4 | –2.6 | 2(–) | 10.7 | 73.7 | 15.6 |
| Outlook Uncertainty Current (versus previous month) | ||||||||
| Indicator | Feb Index | Jan Index | Change | Series Average | Trend* | % Reporting Increase | % Reporting No Change | % Reporting Decrease |
Outlook Uncertainty | 14.0 | 5.7 | +8.3 | 11.0 | 7(+) | 27.9 | 58.2 | 13.9 |
| Business Indicators Relating to Facilities and Products in Texas, Retail Future (six months ahead) | ||||||||
| Indicator | Feb Index | Jan Index | Change | Series Average | Trend* | % Reporting Increase | % Reporting No Change | % Reporting Decrease |
| Retail Activity in Texas | ||||||||
Sales | 34.1 | 51.6 | –17.5 | 30.4 | 21(+) | 47.4 | 39.2 | 13.3 |
Employment | 20.9 | 28.9 | –8.0 | 12.7 | 5(+) | 29.7 | 61.5 | 8.8 |
Part–Time Employment | 4.7 | 0.9 | +3.8 | 1.6 | 5(+) | 9.9 | 84.9 | 5.2 |
Hours Worked | –0.7 | –1.0 | +0.3 | 2.4 | 2(–) | 4.8 | 89.7 | 5.5 |
Wages and Benefits | 28.5 | 31.9 | –3.4 | 29.1 | 58(+) | 31.6 | 65.3 | 3.1 |
Input Prices | 41.1 | 35.1 | +6.0 | 33.8 | 58(+) | 46.2 | 48.7 | 5.1 |
Selling Prices | 28.9 | 15.7 | +13.2 | 28.5 | 58(+) | 36.8 | 55.3 | 7.9 |
Capital Expenditures | 5.8 | 17.3 | –11.5 | 16.6 | 15(+) | 16.0 | 73.8 | 10.2 |
Inventories | –5.4 | 12.2 | –17.6 | 10.7 | 1(–) | 16.4 | 61.8 | 21.8 |
| Companywide Retail Activity | ||||||||
Companywide Sales | 31.3 | 38.3 | –7.0 | 28.8 | 21(+) | 41.8 | 47.8 | 10.5 |
Companywide Internet Sales | 28.2 | 33.4 | –5.2 | 21.1 | 13(+) | 31.3 | 65.6 | 3.1 |
| General Business Conditions, Retail Future (six months ahead) | ||||||||
| Indicator | Feb Index | Jan Index | Change | Series Average | Trend** | % Reporting Improved | % Reporting No Change | % Reporting Worsened |
Company Outlook | 14.2 | 22.0 | –7.8 | 15.1 | 5(+) | 29.3 | 55.6 | 15.1 |
General Business Activity | 3.7 | 19.4 | –15.7 | 10.5 | 5(+) | 23.9 | 55.9 | 20.2 |
*Shown is the number of consecutive months of expansion or contraction in the underlying indicator. Expansion is indicated by a positive index reading and denoted by a (+) in the table. Contraction is indicated by a negative index reading and denoted by a (–) in the table.
**Shown is the number of consecutive months of improvement or worsening in the underlying indicator. Improvement is indicated by a positive index reading and denoted by a (+) in the table. Worsening is indicated by a negative index reading and denoted by a (–) in the table.
Data have been seasonally adjusted as necessary.
Texas Service Sector Outlook Survey


Texas Retail Outlook Survey


Texas Service Sector Outlook Survey
Comments from survey respondents
These comments are from respondents’ completed surveys and have been edited for publication.
- The election of the current administration has increased our optimism about market conditions and a return to more favorable business conditions.
- We are hoping things will improve, but the 25 percent tariffs on steel and aluminum are not going to help.
- We’ve had a slow start on a new initiative that hasn't launched as projected.
- The speed and unpredictable nature of executive orders and other changes from the current administration are creating a sense of anxiety for at least half of my workforce.
- The new administration bump is fading as reality sets in. Tariffs, if not just a negotiating tactic, are a terrible idea. We were feeling a lot more confident at the beginning of the year than now given the new executive orders about tariffs and return-to-office.
- The job market has freed up. We were able to hire two engineers that will start in March. This will give us some much-needed relief. We will be able to focus better on growing the company.
- We are concerned about more price increases related to tariffs.
- Discussions related to freezing or disrupting federal infrastructure and transportation funding have been extremely disruptive to our industry. Any uncertainty in federal funding (awarded, obligated, and just the future potential thereof) is creating major disruptions at all levels. The steel and aluminum tariffs will increase costs as U.S. suppliers will increase prices to match the pass-through costs from non-domestic steel.
- Costs associated with business and health insurance drive the need to increase prices. Health care insurance is up 19 percent. Business insurance excluding professional liability is up 28 percent. The title insurance industry in Texas is facing a decrease in premiums. The commissioner for the Texas Department of Insurance has initiated a 10 percent reduction in premiums. She claims this is to make homeownership more affordable. Title insurance is a one-time premium that is paid at closing. We are not sure how reducing our premiums by 10 percent will make homeownership more affordable. This will cost our industry greatly. Our work force will decrease, which will affect the turnaround time for our product.
- The current administration’s actions regarding federal agencies have introduced too much unpredictability to our daily operations.
- We are seeing some public sector projects being placed on hold for lack of funding or uncertainty resulting from the new administration's goal to reduce government waste. We think for the long term such reduction is a good thing.
- Due to uncertainty about inflation, general business activity has slowed down. Owners of office buildings and multi-family properties are beginning to realize their projects are in trouble due to the increase in interest rates and lack of increase in rental income. We are experiencing multiple cancellations of contracts and refinances for commercial properties. Until we see some clarity in this market, it is going to be sluggish at best.
- The new administration has brought with it a feeling of optimism and that businesses can thrive again.
- The cost of construction materials like steel and concrete are extremely uncertain in light of quickly changing tax situations and import-export fees. While we have work under contract, this will catch up and slow construction. Masonry is available locally, but there is a shortage of masons.
- The uncertainty changes by the minute with each day bringing an endless onslaught of cultural, financial and regulatory chaos from the federal government. It is growing more and more impossible to plan reliably for the immediate term, much less so for anything further out.
- We’re waiting for the federal government restructuring dust to settle down.
- February revenue significantly decreased. We are a bit busier with new roles to fill now, but overall, we are very slow on all fronts.
- Fallout from the new administration's policies is having multiple impacts; tariffs are impacting the cost of doing business, and politics is impacting travel.
- Current administration actions add uncertainty, which we think will have significant consequences such as higher costs and inflation.
- The economy seems to be recovering, with an increase in service requests for the aviation and military sectors. The industrial sector has shown stability, with no significant changes since the last survey. Notably, the energy sector has remained stagnant for over a year. Large-scale projects, such as infrastructure projects, are being delayed by months.
- A majority of our funding is tied to federal contracts, so we are concerned about cuts the Department of Government Efficiency is making.
- Federal government changes and executive actions have greatly increased uncertainty for higher education, especially in areas of funded research, endowment management and student support.
- We have concerns regarding recent executive orders on federal funding.
- I believe the new administration in Washington is creating uncertainty about a variety of subjects. Thus far, there’s no significant damage but a lot of concern. We’ll see how the next six months play out.
- We think the biggest disruption in Texas could be in the immigrant labor pool that is so important to blue-collar industries in our state. If these workers choose to self-deport, it will cause a significant increase in labor costs and consumer prices in Texas.
- We’re still waiting for the tariffs initiative to be resolved.
- There are no real changes on the ground at this point, but there’s definitely a more uncertain outlook for six months from now than there had been, as inflation seems to be picking up rather than abating and the potential for a tariff war seems to be increasing.
- Government Department of Defense budget approval and potential reductions make more uncertainty for us short and longer term.
- Access to capital is unchanged (still difficult) yet the regulatory environment seems to be getting better. There are indicators that our clients will be more open to purchasing new technologies to improve their performance than they were last year, which should help our industry.
- Rural markets remain steady and metropolitan/urban markets have realized some increased activity. We are generally seeing an increase in optimism and signs of excitement as the broad strokes of the new administration start to surface. Interest rates have stalled and continue to have a hold on potential projects including home purchases.
- We are beginning to see inquiries from commercial real estate investors who have been dormant for many months. It appears that shorter-term lenders who have been extending loans with maturity defaults are becoming less accommodating, which will increase the number of investment sales and refinancings as owners are forced to restructure balance sheets.
- The enduring high-interest-rate environment, combined with extreme domestic political uncertainty, has materially impacted our freedom to operate and confidence in the macroeconomic environment going forward. Similarly, these uncertainties have significantly reduced our customers' willingness to purchase and take risk on new solutions. There now seems as if there is an increasing risk of stagflation given the disconnect between the Federal Reserve and the White House, as well as the uncertainty around trade policy created by the current administration.
- Uncertainty is increasing because of the threats of tariffs and inconsistent communications around tariff strategies and objectives. This is impacting our client companies in the manufacturing and construction sectors tremendously, and they are putting most capital expenditures plans on hold and taking actions to reduce costs, which will impact our revenues.
- There’s still a shortage of houses on the market
- We have concern for how the ban on DEI initiatives will impact our industry.
- At a national gathering of multifamily investment leaders last month, we sensed some realization and resignation that the can has been kicked to the end of the road. Upside-down loans are being extended, and those that are ready to dump seem willing to accept 10 percent to 15 percent discounts. Everyday money brokers are begging us to put their cash to work, but bid/ask spreads are still too high. We think the market will improve significantly by year-end as long as the economy is not derailed by ignorance and ineptitude.
- Business activity softened in January following momentum from the last quarter of 2024. Consumers seem to be a little more cautious on home purchases. We expect this to be temporary, but we’re uncertain as to timing.
- The new administration is creating a lot of uncertainty related to costs in our market. Labor is hard to find, and the current immigration policies will make it harder. Tariffs will also increase our material costs and possibly put us in a negative position on projects.
- We are in expansion mode, adding additional coverages, and our client base is receptive to the widened services in power generation advisory and mergers and acquisitions.
- General business conditions have become more unpredictable due to threatened or actual imposition of across-the-board tariffs, the possibility of widespread illegal immigrant deportations and the threat of international conflict. While we believe our company outlook may remain the same for the next six months, we are not that sure about the longer term due to factors described above.
- Both tariffs and high interest rates negatively impact the returns we can achieve for our clients, which therefore risks slowing the flow of capital.
- Generally speaking, we are seeing a seasonal decrease in sales volumes, but surprisingly are nonetheless up over January 2024 revenue. Challenges include a slight increase in the cost of products. Applicant numbers for open positions remain higher than a year ago and steady, so the labor market seems to have cooled.
- The cost of business is higher as we have to pay property taxes in January. Selling prices are lower as we run promotions due to competition.
- We had a challenging year in 2024 toward the end, and our 2025 outlook is negative. The thoughts of tariffs and deportations hurt a small business such as ours. We have a large agriculture and minority customer base, and posturing by the new administration makes them all nervous.
- We are talking with a salesman/contractor who should help us drive new business. We anticipate bringing on new business in the late first quarter.
- January is off to a slow start, but that isn't unusual. We are optimistic that President Trump will create a pro-business climate. How quickly his administration can make a difference is the question.
- New vehicle unit sales have declined a little more than the normal seasonal change. Used vehicle unit sales have increased a little more than the normal seasonal change.
- Stagnant business environment.
- There is a renewed spirit of optimism in the business world.
- After over 10 years, we have closed our flagship brick-and-mortar store location due to exponential lease increases. We do have one remaining physical location and various business expansions happening in 2025. So, with the uncertainty caused by losing our top revenue-producing location, we are optimistic that the changes and expansions in 2025 will be profitable.
- We feel much better about the business environment since Trump has been elected.
Historical Data
Historical data can be downloaded dating back to January 2007.
Indexes
Download indexes for all indicators. For the definitions of all variables, see data definitions.
Texas Service Sector Outlook Survey |
Texas Retail Outlook Survey |
| Unadjusted | Unadjusted |
| Seasonally adjusted | Seasonally adjusted |
All Data
Download indexes and components of the indexes (percentage of respondents reporting increase, decrease, or no change). For the definitions of all variables, see data definitions.
Texas Service Sector Outlook Survey |
Texas Retail Outlook Survey |
| Unadjusted | Unadjusted |
| Seasonally adjusted | Seasonally adjusted |
Questions regarding the Texas Service Sector Outlook Survey can be addressed to Jesus Cañas at jesus.canas@dal.frb.org.
Sign up for our email alert to be automatically notified as soon as the latest Texas Service Sector Outlook Survey is released on the web.