
Texas Service Sector Outlook Survey
Texas service activity improves, but moderate growth continues
For this month’s survey, Texas business executives were asked supplemental questions about the labor market and financial conditions. Results for these questions from the Texas Manufacturing Outlook Survey, Texas Service Sector Outlook Survey and Texas Retail Outlook Survey have been released together. Read the special questions results.
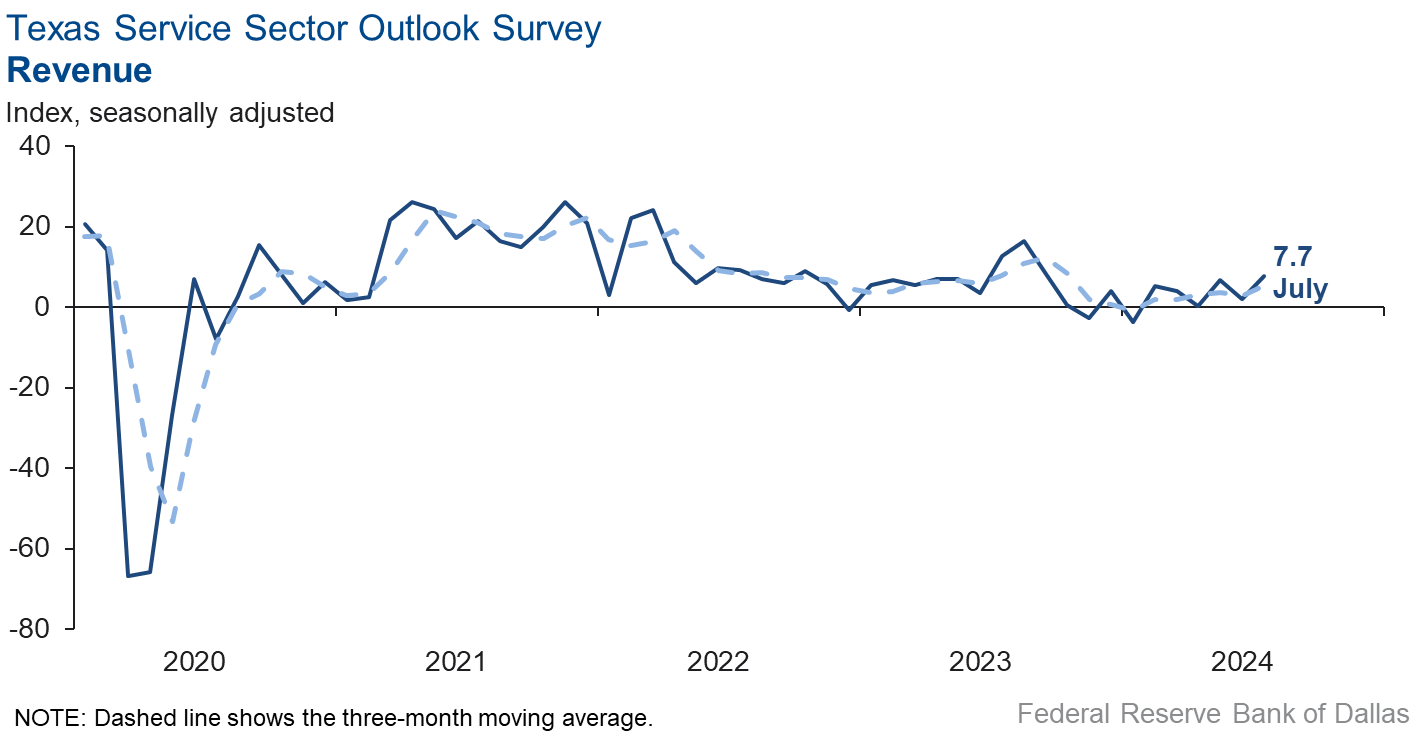
Texas service sector activity expanded at a faster pace in July than the prior month, according to business executives responding to the Texas Service Sector Outlook Survey. The revenue index, a key measure of state service sector conditions, increased to 7.7 in July from 1.9 in June.
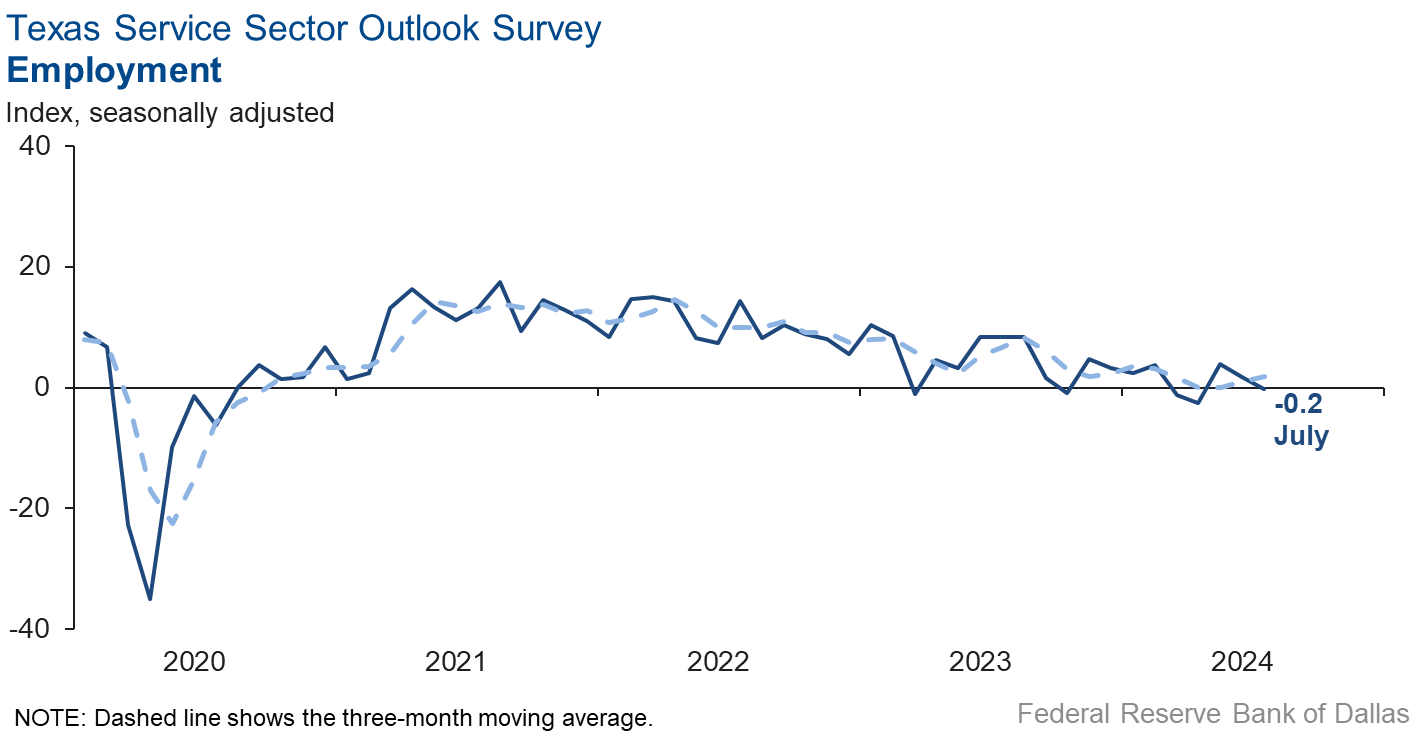
Labor market measures suggested no growth in employment in July, and no change in hours worked. The employment index fell from 1.8 to -0.2. The near-zero reading signals little change in employment much like the prior period. The part-time employment index improved slightly to -2.3. The hours-worked index was unchanged at -0.9.
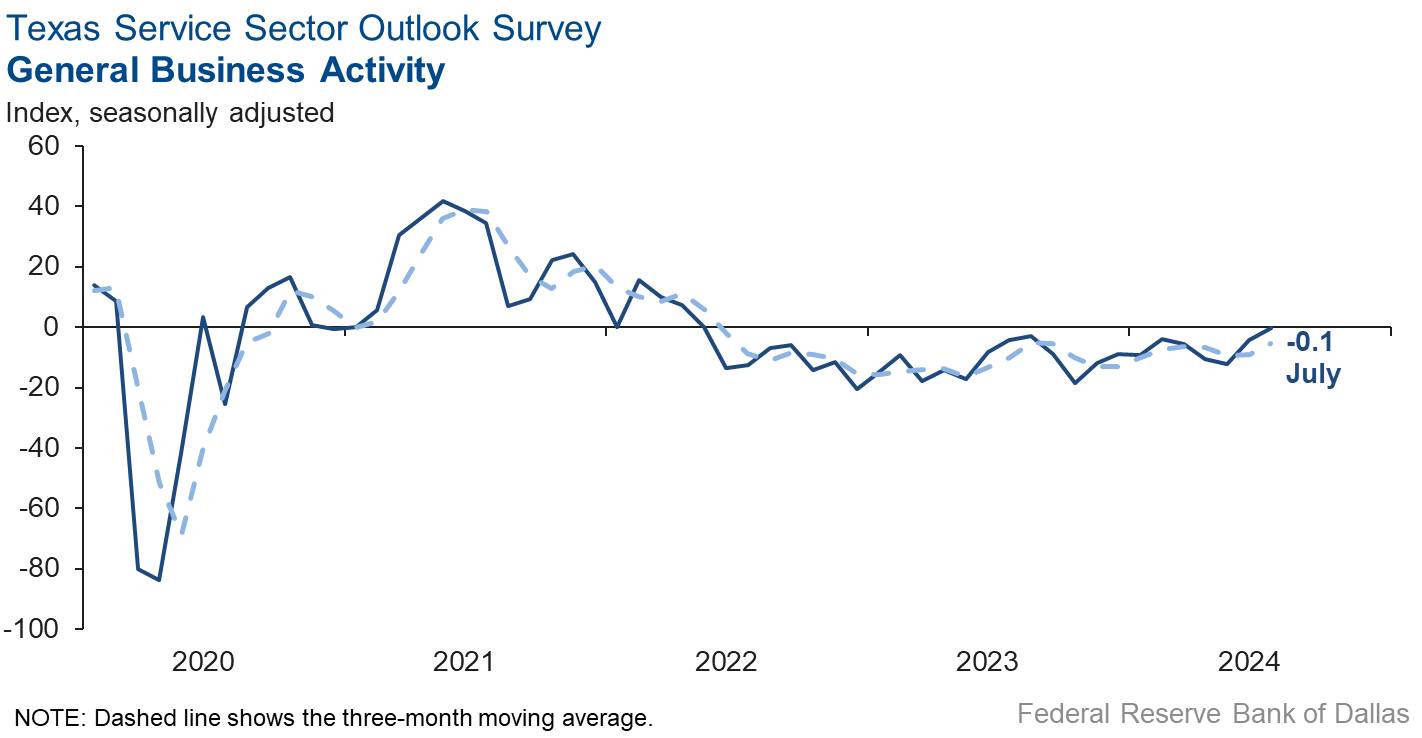
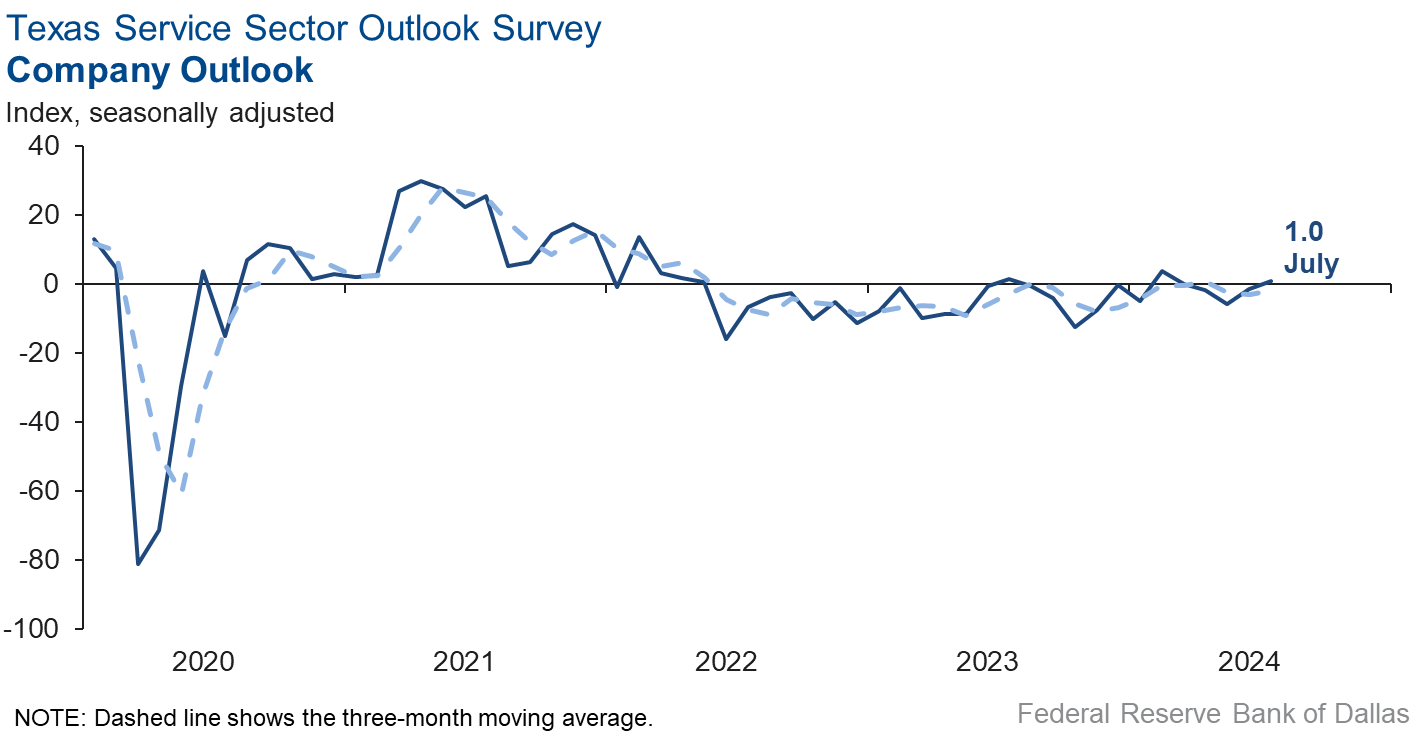
Perceptions of broader business conditions were basically unchanged in July compared to last month when pessimism waned slightly. The general business activity index increased from -4.1 to -0.1, with the near-zero reading signaling little change in perceptions of broader business conditions over the prior period. The company outlook index also improved from -1.3 to 1.0. The outlook uncertainty index fell from 13.6 to 8.4.
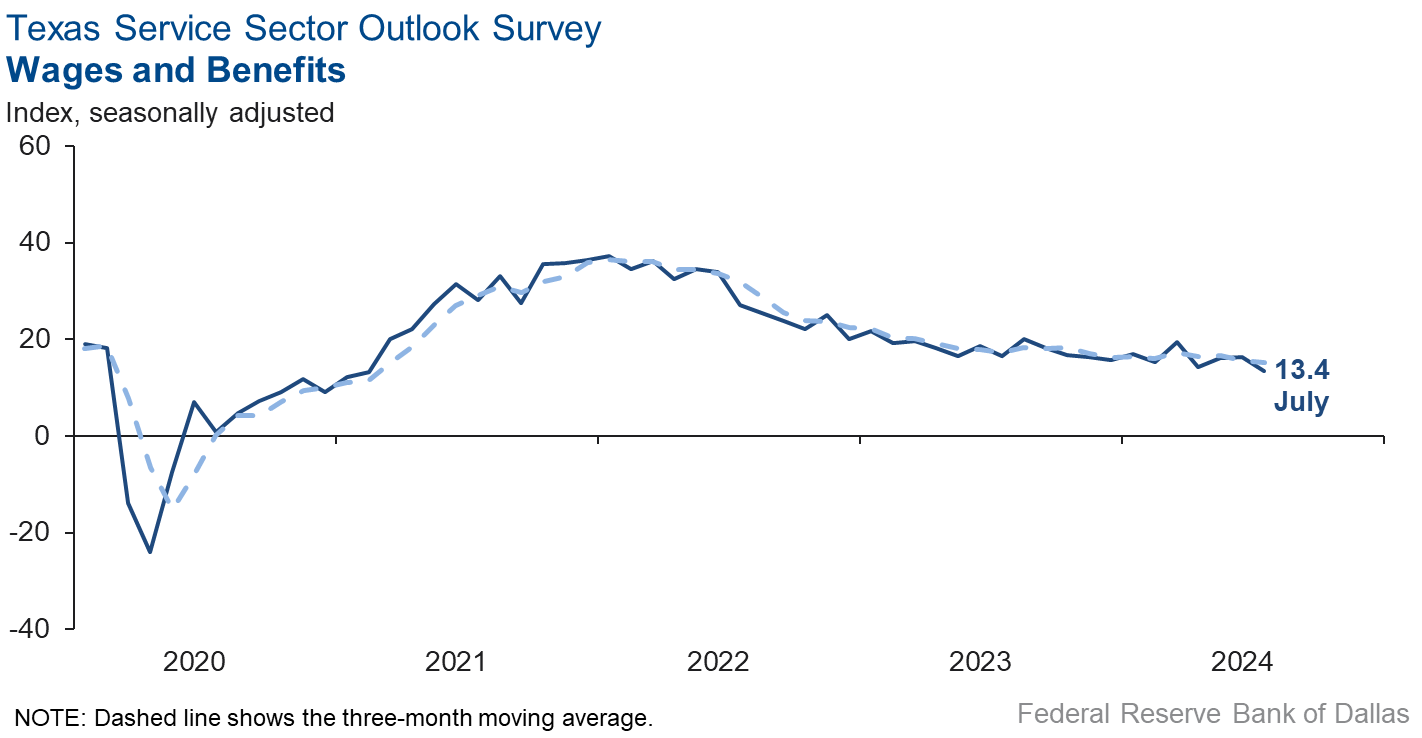
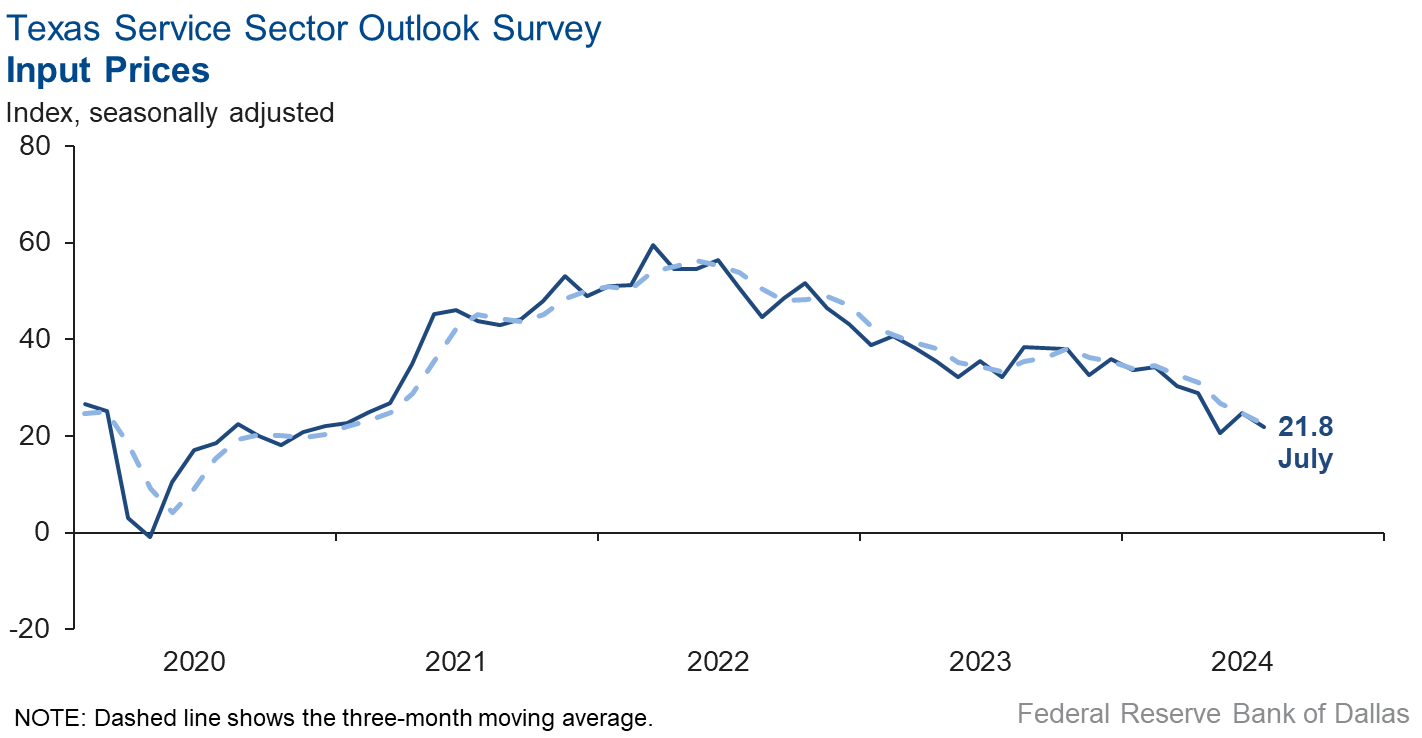
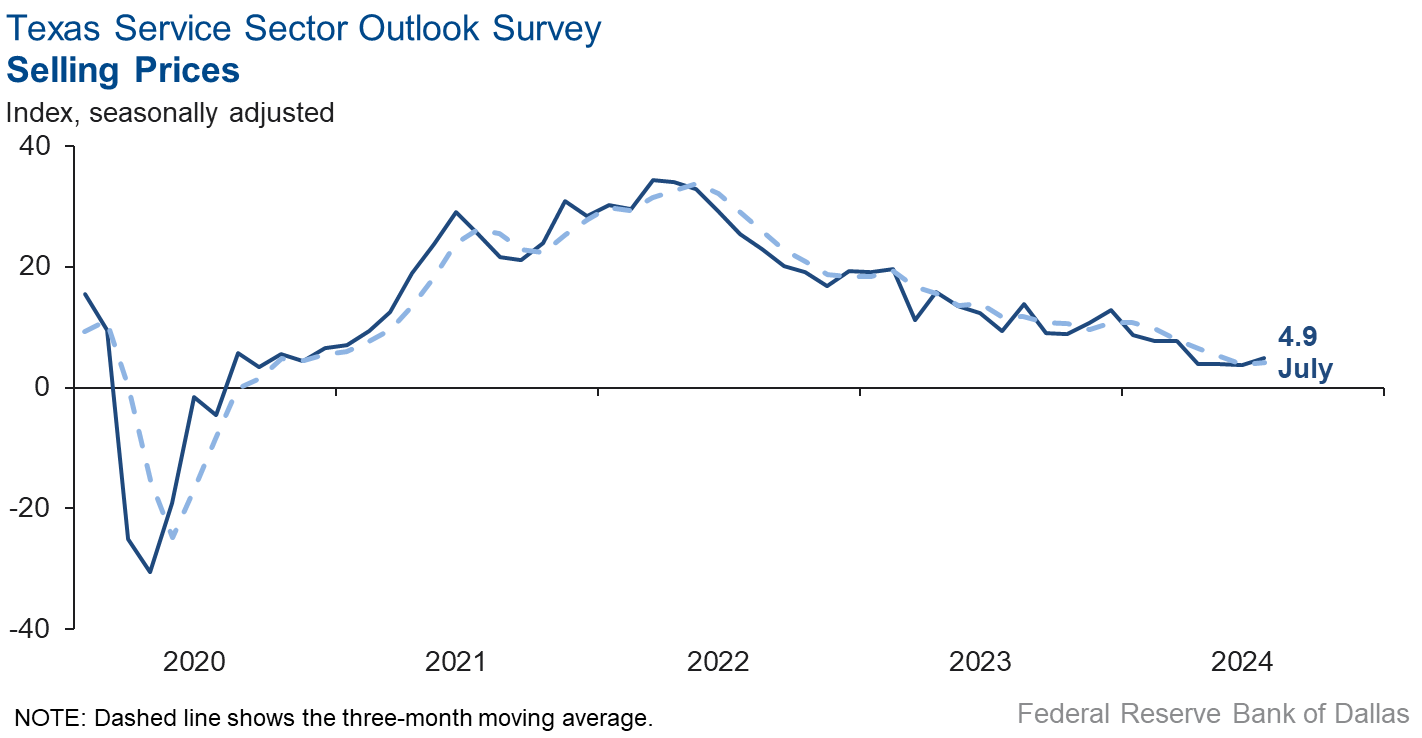
Input price and wage pressures eased slightly, while selling price pressures remained the same in July. The input price index fell from 24.7 to 21.8 and the wages and benefits index moved down from 16.4 to 13.4. The selling price index was basically unchanged at 4.9.
Respondents’ expectations regarding future business activity reflected more optimism in July. The future general business activity index improved, increasing from 3.0 to 19.1. The future revenue index increased five points to 35.7. Other future service-sector activity indexes such as employment and capital expenditures remained in positive territory and increased, reflecting expectations for growth in the next six months.

Texas Retail Outlook Survey
Texas retail sales continue falling
Retail sales activity declined in July, according to business executives responding to the Texas Retail Outlook Survey. The sales index, a key measure of state retail activity, remained the same at -18.1 in July, indicating retail sales fell at about the same pace as the previous month. Retailers’ inventories fell over the month, with the July index at -7.7.
Retail labor market indicators suggested a contraction in employment and workweeks in July. The employment index fell further to -6.5 from -4.0, while the part-time employment index increased to 0.3. The hours worked index continued in negative territory and fell from -8.6 to -12.3.
Retailers continued to perceive a worsening of broader business conditions in July. The general business activity index remained in negative territory but improved from -22.7 to -18.3. The company outlook index fell from -17.3 to -20.3. Uncertainty around the outlook stabilized in July.
Selling price growth fell in July, while input price growth remained the same, and wage pressures fell considerably from the prior month. The selling price index dropped from 1.9 to -2.1. The input price index was unchanged at 11.3 , and the wages and benefits index moved down from 13.7 to 6.3.
Expectations for future business conditions in retail improved in July. The future general business activity index moved into positive territory, increasing from -6.4 to 17.0. The future sales index improved to 30.9. Other indexes of future retail activity such as employment and capital expenditures were mixed, with the future employment index turning negative for the first time since April 2020 and the capital expenditures index remaining positive.
Next release: August 27, 2024
Data were collected July 16–24, and 259 of the 406 Texas service sector business executives surveyed submitted responses. The Dallas Fed conducts the Texas Service Sector Outlook Survey monthly to obtain a timely assessment of the state’s service sector activity. Firms are asked whether revenue, employment, prices, general business activity and other indicators increased, decreased or remained unchanged over the previous month.
Survey responses are used to calculate an index for each indicator. Each index is calculated by subtracting the percentage of respondents reporting a decrease from the percentage reporting an increase. When the share of firms reporting an increase exceeds the share reporting a decrease, the index will be greater than zero, suggesting the indicator has increased over the prior month. If the share of firms reporting a decrease exceeds the share reporting an increase, the index will be below zero, suggesting the indicator has decreased over the prior month. An index will be zero when the number of firms reporting an increase is equal to the number of firms reporting a decrease.
Data have been seasonally adjusted as necessary.
Texas Service Sector Outlook Survey
Historical data are available from January 2007 to the most current release month.
| Business Indicators Relating to Facilities and Products in Texas Current (versus previous month) | ||||||||
| Indicator | Jul Index | Jun Index | Change | Series Average | Trend* | % Reporting Increase | % Reporting No Change | % Reporting Decrease |
Revenue | 7.7 | 1.9 | +5.8 | 10.6 | 6(+) | 29.4 | 49.0 | 21.7 |
Employment | –0.2 | 1.8 | –2.0 | 6.3 | 1(–) | 11.4 | 77.0 | 11.6 |
Part–Time Employment | –2.3 | –3.7 | +1.4 | 1.4 | 3(–) | 4.2 | 89.3 | 6.5 |
Hours Worked | –0.9 | 0.7 | –1.6 | 2.6 | 1(–) | 7.7 | 83.7 | 8.6 |
Wages and Benefits | 13.4 | 16.4 | –3.0 | 15.8 | 50(+) | 17.3 | 78.8 | 3.9 |
Input Prices | 21.8 | 24.7 | –2.9 | 27.9 | 51(+) | 27.5 | 66.8 | 5.7 |
Selling Prices | 4.9 | 3.8 | +1.1 | 7.6 | 48(+) | 15.5 | 73.9 | 10.6 |
Capital Expenditures | 6.0 | 7.4 | –1.4 | 9.9 | 48(+) | 14.2 | 77.6 | 8.2 |
| General Business Conditions Current (versus previous month) | ||||||||
| Indicator | Jul Index | Jun Index | Change | Series Average | Trend** | % Reporting Improved | % Reporting No Change | % Reporting Worsened |
Company Outlook | 1.0 | –1.3 | +2.3 | 4.3 | 1(+) | 14.9 | 71.2 | 13.9 |
General Business Activity | –0.1 | –4.1 | +4.0 | 2.3 | 26(–) | 16.1 | 67.7 | 16.2 |
| Indicator | Jul Index | Jun Index | Change | Series Average | Trend* | % Reporting Increase | % Reporting No Change | % Reporting Decrease |
Outlook Uncertainty | 8.4 | 13.6 | –5.2 | 13.4 | 38(+) | 20.6 | 67.2 | 12.2 |
| Business Indicators Relating to Facilities and Products in Texas Future (six months ahead) | ||||||||
| Indicator | Jul Index | Jun Index | Change | Series Average | Trend* | % Reporting Increase | % Reporting No Change | % Reporting Decrease |
Revenue | 35.7 | 30.9 | +4.8 | 37.3 | 51(+) | 49.1 | 37.5 | 13.4 |
Employment | 17.8 | 16.1 | +1.7 | 23.0 | 51(+) | 28.7 | 60.4 | 10.9 |
Part–Time Employment | 3.7 | 3.3 | +0.4 | 6.6 | 2(+) | 10.3 | 83.1 | 6.6 |
Hours Worked | 6.7 | 3.5 | +3.2 | 5.8 | 51(+) | 10.7 | 85.3 | 4.0 |
Wages and Benefits | 35.6 | 36.9 | –1.3 | 37.4 | 51(+) | 38.4 | 58.8 | 2.8 |
Input Prices | 32.5 | 38.1 | –5.6 | 44.5 | 211(+) | 39.8 | 52.9 | 7.3 |
Selling Prices | 18.9 | 13.4 | +5.5 | 24.6 | 51(+) | 29.4 | 60.1 | 10.5 |
Capital Expenditures | 16.6 | 14.4 | +2.2 | 22.9 | 50(+) | 25.9 | 64.9 | 9.3 |
| General Business Conditions Future (six months ahead) | ||||||||
| Indicator | Jul Index | Jun Index | Change | Series Average | Trend** | % Reporting Improved | % Reporting No Change | % Reporting Worsened |
Company Outlook | 20.5 | 8.8 | +11.7 | 15.4 | 9(+) | 31.6 | 57.3 | 11.1 |
General Business Activity | 19.1 | 3.0 | +16.1 | 11.9 | 3(+) | 31.8 | 55.5 | 12.7 |
Historical data are available from January 2007 to the most current release month.
| Business Indicators Relating to Facilities and Products in Texas Retail (versus previous month) | ||||||||
| Indicator | Jul Index | Jun Index | Change | Series Average | Trend* | % Reporting Increase | % Reporting No Change | % Reporting Decrease |
| Retail Activity in Texas | ||||||||
Sales | –18.1 | –18.8 | +0.7 | 3.4 | 15(–) | 22.0 | 37.8 | 40.1 |
Employment | –6.5 | –4.0 | –2.5 | 1.7 | 5(–) | 4.0 | 85.5 | 10.5 |
Part–Time Employment | 0.3 | –1.2 | +1.5 | –1.5 | 1(+) | 7.2 | 85.9 | 6.9 |
Hours Worked | –12.3 | –8.6 | –3.7 | –2.2 | 7(–) | 3.6 | 80.5 | 15.9 |
Wages and Benefits | 6.3 | 13.7 | –7.4 | 11.3 | 48(+) | 10.1 | 86.1 | 3.8 |
Input Prices | 11.3 | 10.0 | +1.3 | 22.6 | 51(+) | 27.6 | 56.1 | 16.3 |
Selling Prices | –2.1 | 1.9 | –4.0 | 13.4 | 1(–) | 21.6 | 54.7 | 23.7 |
Capital Expenditures | –1.5 | 4.4 | –5.9 | 7.7 | 1(–) | 12.5 | 73.5 | 14.0 |
Inventories | –7.7 | 0.7 | –8.4 | 2.7 | 1(–) | 20.6 | 51.1 | 28.3 |
| Companywide Retail Activity | ||||||||
Companywide Sales | –14.5 | –15.5 | +1.0 | 4.6 | 4(–) | 21.6 | 42.3 | 36.1 |
Companywide Internet Sales | 1.5 | –6.1 | +7.6 | 4.0 | 1(+) | 18.6 | 64.3 | 17.1 |
| General Business Conditions, Retail Current (versus previous month) | ||||||||
| Indicator | Jul Index | Jun Index | Change | Series Average | Trend** | % Reporting Improved | % Reporting No Change | % Reporting Worsened |
Company Outlook | –20.3 | –17.3 | –3.0 | 1.6 | 10(–) | 6.0 | 67.7 | 26.3 |
General Business Activity | –18.3 | –22.7 | +4.4 | –2.5 | 13(–) | 9.5 | 62.7 | 27.8 |
| Outlook Uncertainty Current (versus previous month) | ||||||||
| Indicator | Jul Index | Jun Index | Change | Series Average | Trend* | % Reporting Increase | % Reporting No Change | % Reporting Decrease |
Outlook Uncertainty | 0.0 | 7.3 | –7.3 | 11.0 | 1() | 14.0 | 72.0 | 14.0 |
| Business Indicators Relating to Facilities and Products in Texas, Retail Future (six months ahead) | ||||||||
| Indicator | Jul Index | Jun Index | Change | Series Average | Trend* | % Reporting Increase | % Reporting No Change | % Reporting Decrease |
| Retail Activity in Texas | ||||||||
Sales | 30.9 | 18.6 | +12.3 | 30.5 | 14(+) | 38.7 | 53.5 | 7.8 |
Employment | –2.1 | 12.5 | –14.6 | 12.8 | 1(–) | 10.6 | 76.6 | 12.7 |
Part–Time Employment | –0.4 | –5.6 | +5.2 | 1.6 | 2(–) | 8.5 | 82.6 | 8.9 |
Hours Worked | 3.9 | 0.4 | +3.5 | 2.4 | 3(+) | 7.3 | 89.3 | 3.4 |
Wages and Benefits | 26.8 | 30.2 | –3.4 | 29.1 | 51(+) | 27.9 | 71.0 | 1.1 |
Input Prices | 14.9 | 23.1 | –8.2 | 33.8 | 51(+) | 29.8 | 55.3 | 14.9 |
Selling Prices | 8.6 | 5.9 | +2.7 | 28.8 | 51(+) | 27.7 | 53.2 | 19.1 |
Capital Expenditures | 22.2 | 19.6 | +2.6 | 16.8 | 8(+) | 33.7 | 54.8 | 11.5 |
Inventories | 20.6 | 7.6 | +13.0 | 10.7 | 9(+) | 32.5 | 55.6 | 11.9 |
| Companywide Retail Activity | ||||||||
Companywide Sales | 22.8 | 9.5 | +13.3 | 29.0 | 14(+) | 34.0 | 54.8 | 11.2 |
Companywide Internet Sales | 16.2 | 9.8 | +6.4 | 21.2 | 6(+) | 24.3 | 67.6 | 8.1 |
| General Business Conditions, Retail Future (six months ahead) | ||||||||
| Indicator | Jul Index | Jun Index | Change | Series Average | Trend** | % Reporting Improved | % Reporting No Change | % Reporting Worsened |
Company Outlook | 9.2 | 1.1 | +8.1 | 15.0 | 6(+) | 24.9 | 59.4 | 15.7 |
General Business Activity | 17.0 | –6.4 | +23.4 | 10.3 | 1(+) | 28.3 | 60.4 | 11.3 |
*Shown is the number of consecutive months of expansion or contraction in the underlying indicator. Expansion is indicated by a positive index reading and denoted by a (+) in the table. Contraction is indicated by a negative index reading and denoted by a (–) in the table.
**Shown is the number of consecutive months of improvement or worsening in the underlying indicator. Improvement is indicated by a positive index reading and denoted by a (+) in the table. Worsening is indicated by a negative index reading and denoted by a (–) in the table.
Data have been seasonally adjusted as necessary.
Texas Service Sector Outlook Survey
Texas Retail Outlook Survey


Texas Service Sector Outlook Survey
Comments from survey respondents
These comments are from respondents’ completed surveys and have been edited for publication.
- It feels like the economy is getting better.
- We expect Permian Basin oil demand to grow 200 million to 300 million barrels per day across 2024. More volume drives our expectations for revenue growth.
- Bad local cotton crop expected due to bad weather.
- Our industry has seen an increase in activity and a hairline increase in selling prices.
- We think some good news on the inflation front provides hope for a soft landing and maybe even a potential rate cut that could spur additional business.
- New advanced, customer-built, do-it-yourself lessons via software capabilities have been offered for mixed reality training with AI assisted metrics. More training opportunities are emerging within the Department of Defense, showing interest in the development of apps. New and more advanced software and licensing are the main reasons for a better outlook, not current economic conditions.
- There is still a high amount of uncertainty about rate cuts and, subsequently, cost of capital. Simultaneously, we are wary that consumer spending will not hold up over the next six month unless something changes or there is more liquidity in the system. The election and the impact that will have on economic policy and rates are also adding to the uncertainty and ambiguity. We are hesitant to forward-invest until the Federal Reserve behavior and economic data suggest the economy has achieved some sort of soft landing.
- The political climate has intensified the feeling of uncertainty, especially after the assassination attempt on former President Trump. Economically, the rural markets are fairly steady but not robust. The most prevalent inflationary pressure across the board is the increase in insurance premiums including health insurance for employee coverage. Auto, homeowners' coverage and liability insurance premiums have been substantial. We are beginning to hear of lower income families dropping or not renewing coverage of their homes. The interest rate on residential real estate, combined with escrow for insurance and taxes, is increasing debt service coverage for anyone financing a home.
- Business is stable. Insurance increases are moderating somewhat. All eyes are on the November election currently.
- The presidential election causes uncertainty. House inventory remains low.
- Interest rates in the form of mortgage rates are the question mark. Lower rates are good for our business.
- We finished 1Q 2024 down 2 percent compared to 1Q 2023. The second quarter was even slower, ending down 9.6 percent. We averaged over 10 percent growth in revenue per year for over 65 years, so that makes us think these quarterly reports are more than just an anomaly. We think the Federal Reserve has finally gotten this economy pulled back; whether they have killed it or not is yet to be seen.
- This is the worst month we have had since the Great Recession. It was even worse than the first month of the pandemic. There are almost no new starts on multi-family or self-storage, and building permits are well down. We have seen increased activity in new prospects, leads, as well as deals. We suspect this is due to a combination of sales and marketing efforts, as well as the slight easing in inflation, which has, in turn, likely improved business and consumer confidence.
- The pace of business activity has slowed down. Operating cost has increased, including the cost of software subscriptions and facility maintenance. Also, there’s been a loss in productivity due to hurricane preparation and summertime vacation. There is a general sense of a loss of momentum and uncertainty.
- Changes in the presidential race have created significant added uncertainty as to the future regulatory climate in the energy sector.
- The real estate market has been stagnated for the past year and a half and will remain so until interest rates stabilize. We are hoping this is the bottom, but until regional banks find a way to begin making loans, the real estate market will not recover. We are at a breaking point if the banks start taking property back and cannot find a way to make loans.
- We are a recruiting company. Our retained search side has been a little busier this month than last month, and we hope to have even more work in August and for the second half of the year. Our outsource recruiting side has been the same this month versus last month, but we hope it will grow.
- The bottom has fallen out of the professional-level hiring market. Clients are not hiring or are very slow to make decisions. The cost of money for our clients (and for us) is preventing us from hiring and optimizing production in our businesses. We are living on the edge of recession and truly need the Federal Reserve to take action and start to lower rates. Layoffs are imminent.
- There is still pressure on wages and the ability to hire employees at line-level blue collar work.
- We are concerned about interest rates, but economic activity seems strong.
- We were dramatically affected by Hurricane Beryl and the power outages this month. Then we were affected by the Crowdstrike update issue as well. We lost significant business due to these factors in July.
- Weather has been the real negative factor for our business.
- Hurricane Beryl caused a drastic change in our business, increasing our occupancy and revenue dramatically over the previous month and same time last year. We also experienced some damage that caused us to have some capital expenses, but minimal for the most part.
- In our market, we manage three hotels, one downtown and two on the northside of our city. The two on the northside are performing as expected. Downtown demand has been sluggish. Factors that are contributing to this issue include a lack of group business and construction throughout our downtown area. For the first time in a while, we have had a restaurant on the riverwalk close due to the lack of demand. Based on our advance bookings, this will continue to play out until we get into fall.
- We are seeing a softening in sales to the construction market.
- The best words to describe retail are stagnant or grinding day to day.
- We have a challenging business model. We are seeing margin compression. Inventories are abnormally high and the cost-to-carry is severely impacting profitability. Affordability is a major issue and ongoing concern.
- Demand for new and used vehicles continues to be strong. Inventory growth has slowed down and is starting to plateau.
- Retail is struggling.
- The lumber market is weak, and sales seem to be flat from month to month, with no real signs of improving.
- There is very little activity. The combination of steel prices decreasing and the promise of lower interest rates sometime in the future is causing everyone to delay.
Historical Data
Historical data can be downloaded dating back to January 2007.
Indexes
Download indexes for all indicators. For the definitions of all variables, see data definitions.
Texas Service Sector Outlook Survey |
Texas Retail Outlook Survey |
| Unadjusted | Unadjusted |
| Seasonally adjusted | Seasonally adjusted |
All Data
Download indexes and components of the indexes (percentage of respondents reporting increase, decrease, or no change). For the definitions of all variables, see data definitions.
Texas Service Sector Outlook Survey |
Texas Retail Outlook Survey |
| Unadjusted | Unadjusted |
| Seasonally adjusted | Seasonally adjusted |
Questions regarding the Texas Service Sector Outlook Survey can be addressed to Jesus Cañas at jesus.canas@dal.frb.org.
Sign up for our email alert to be automatically notified as soon as the latest Texas Service Sector Outlook Survey is released on the web.