Texas Manufacturing Outlook Survey

Texas manufacturing activity falters amid increased uncertainty
For this month’s survey, Texas business executives were asked supplemental questions on demand, labor and U.S. trade policy. Results for these questions from the Texas Manufacturing Outlook Survey, Texas Service Sector Outlook Survey and Texas Retail Outlook Survey have been released together. Read the special questions results.
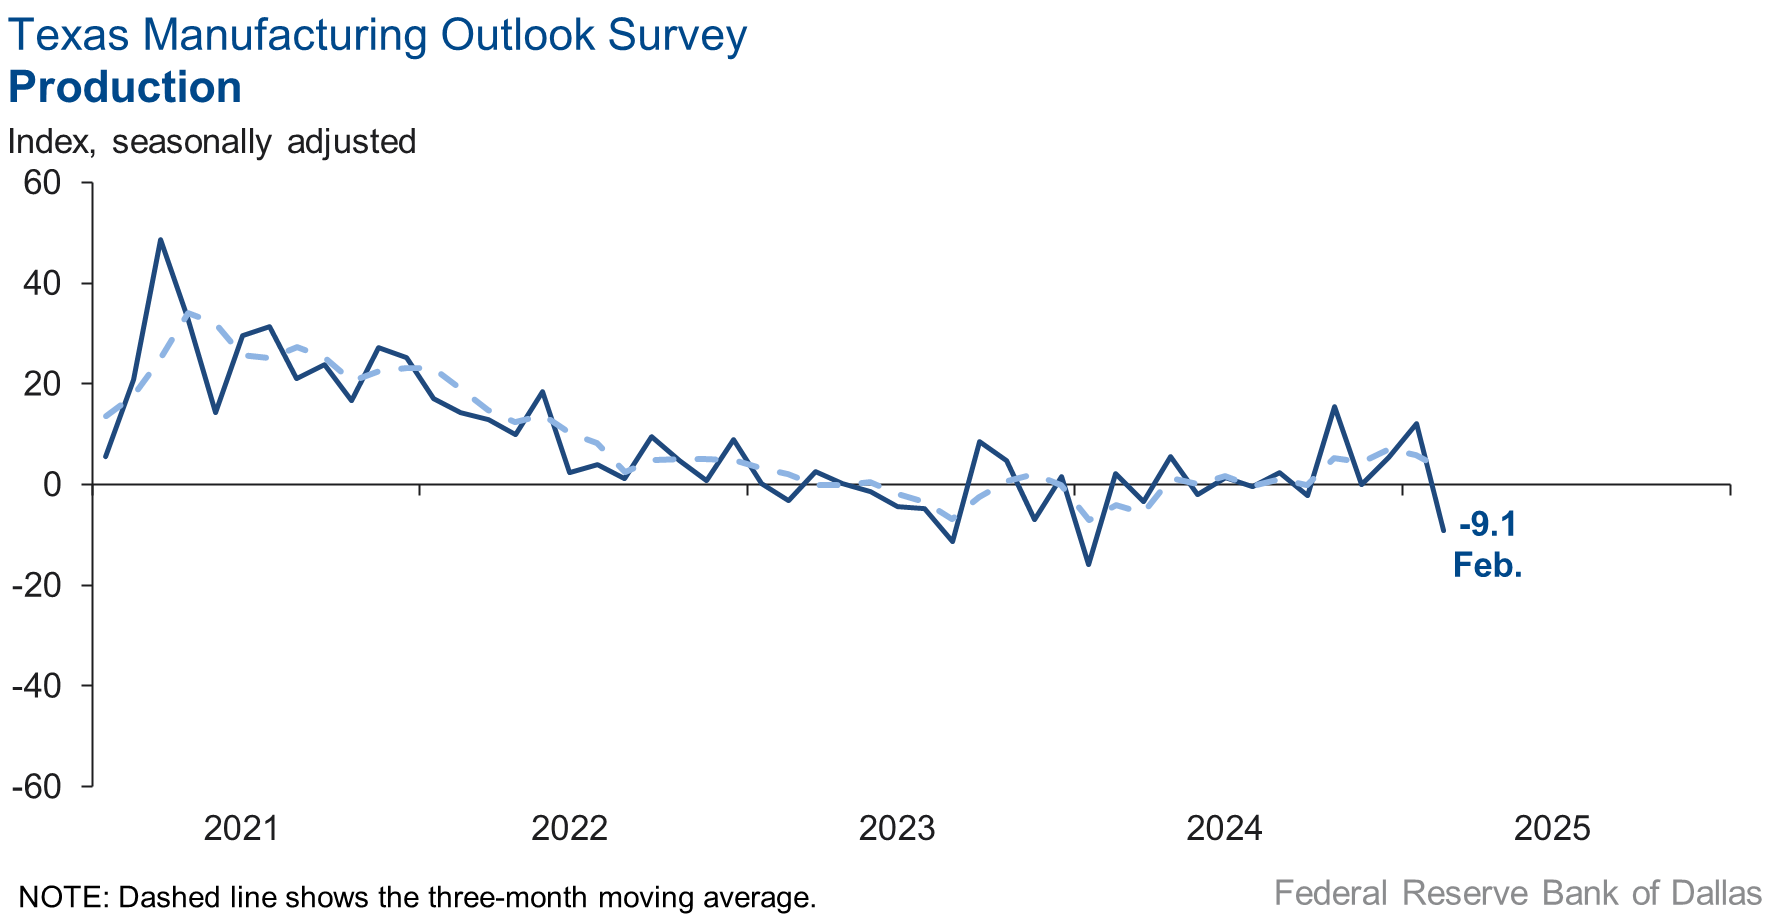
Texas factory activity fell in February after rising notably in January, according to business executives responding to the Texas Manufacturing Outlook Survey. The production index, a key measure of state manufacturing conditions, fell 21 points to -9.1.
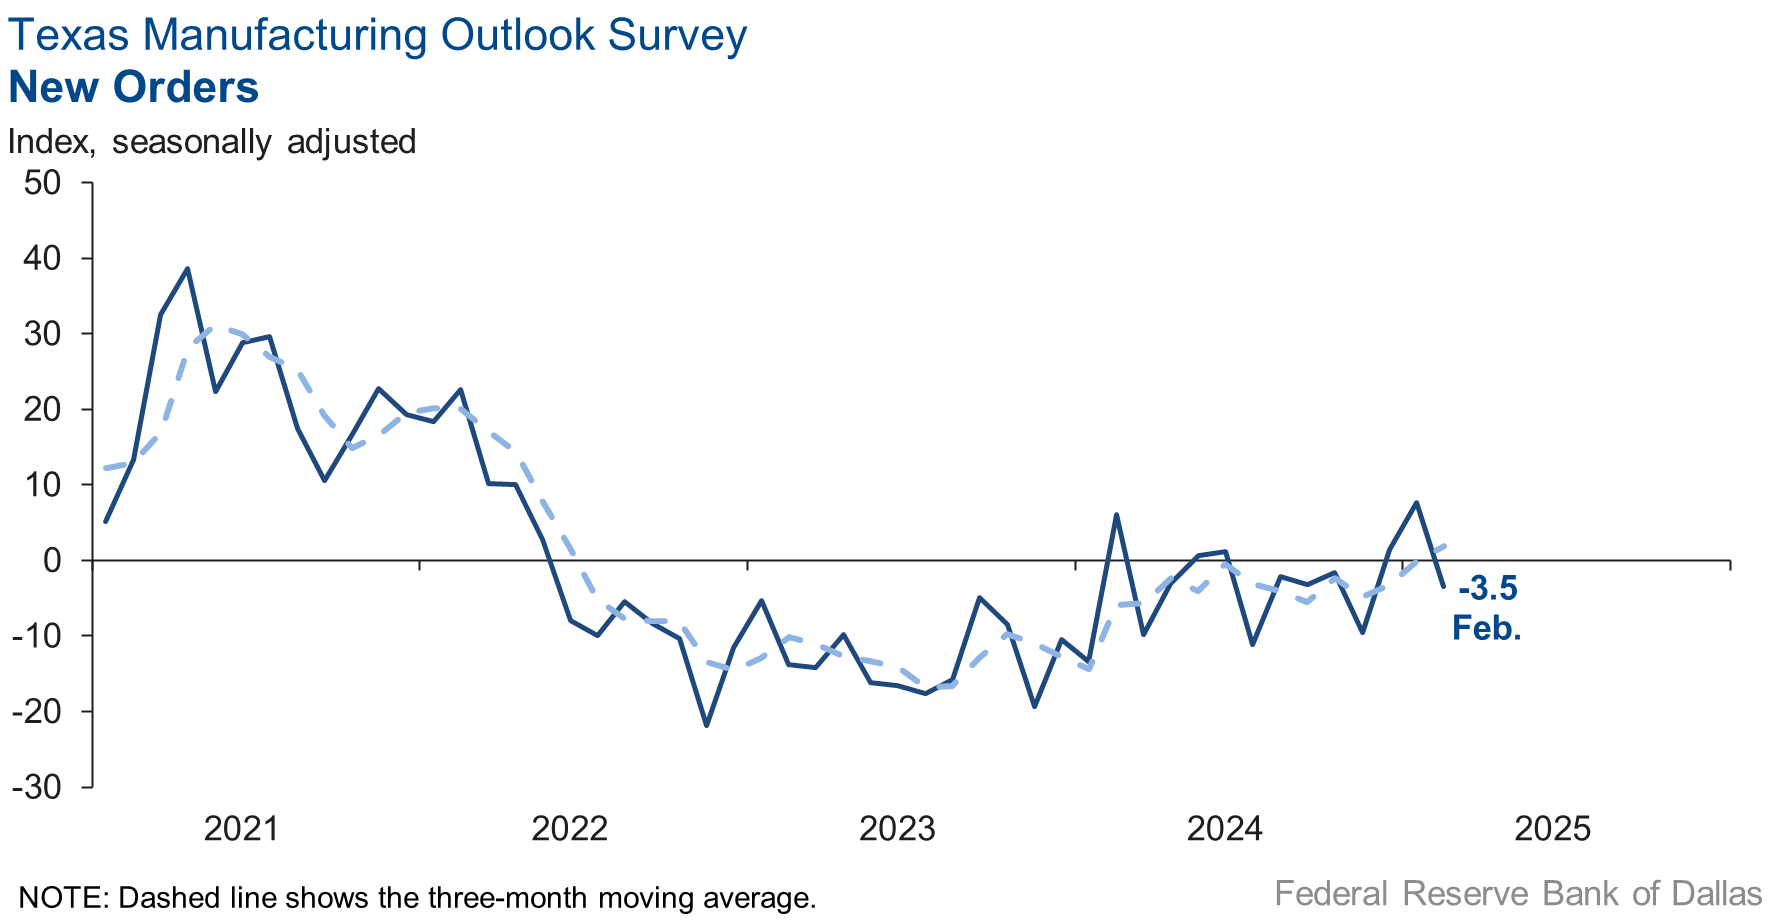
Other measures of manufacturing activity also declined this month. The new orders index fell 11 points to -3.5, and the capacity utilization index slid 14 points to -8.7. The shipments index remained positive but edged down to 5.6.
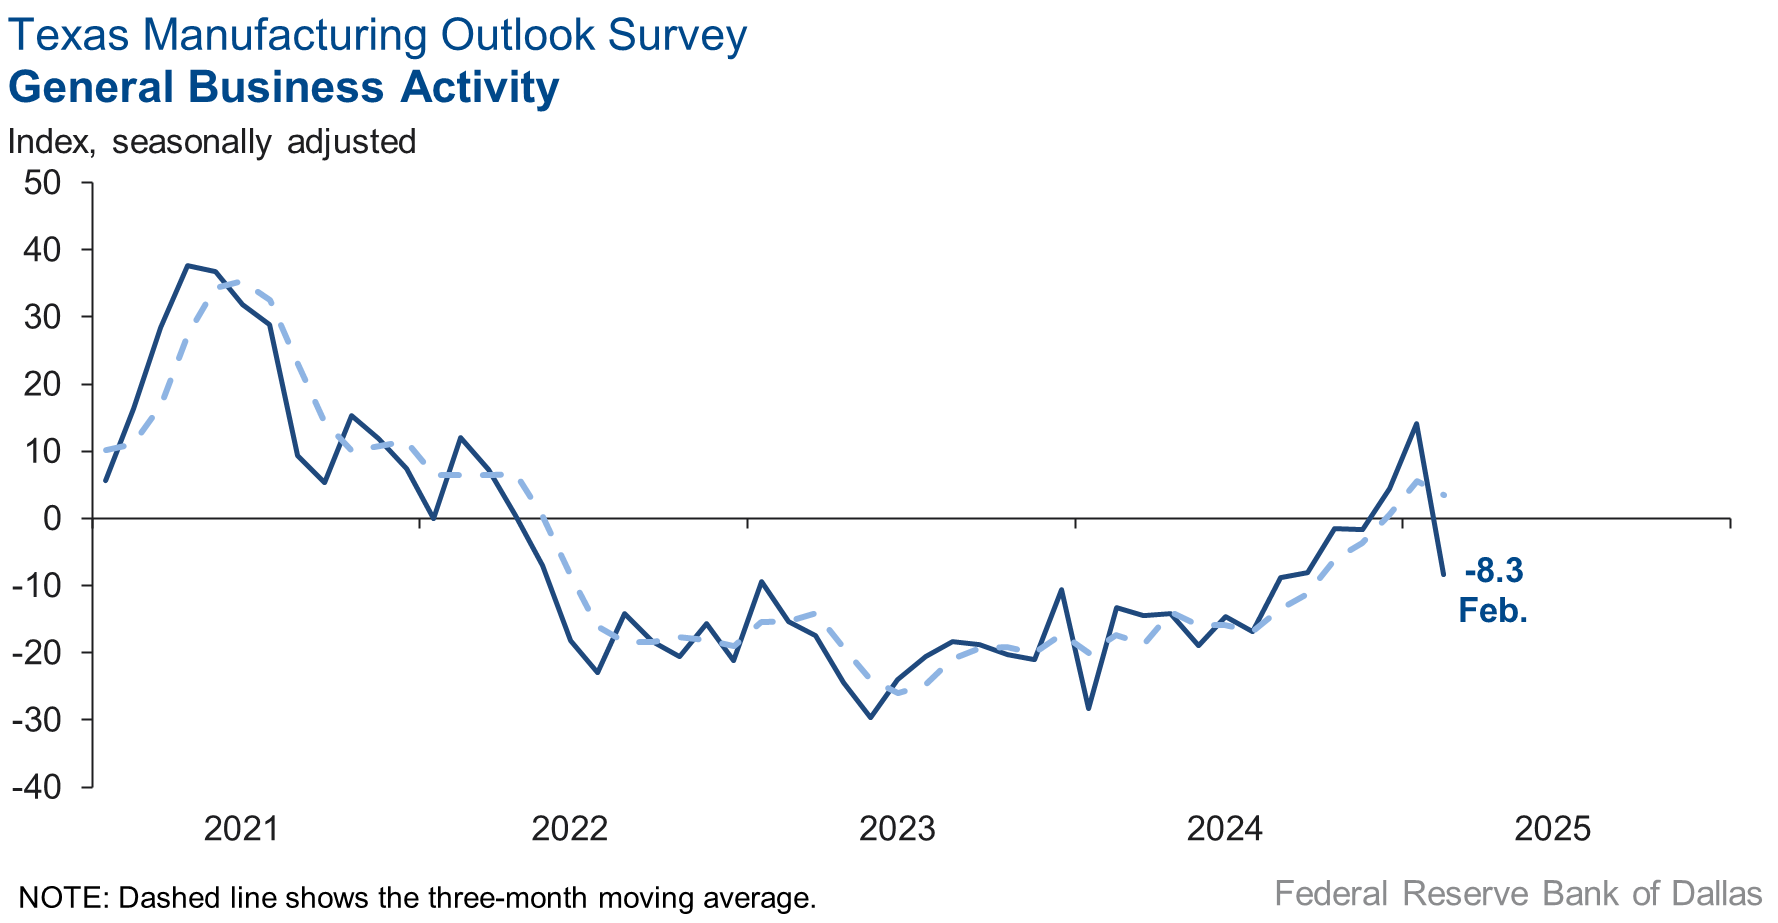
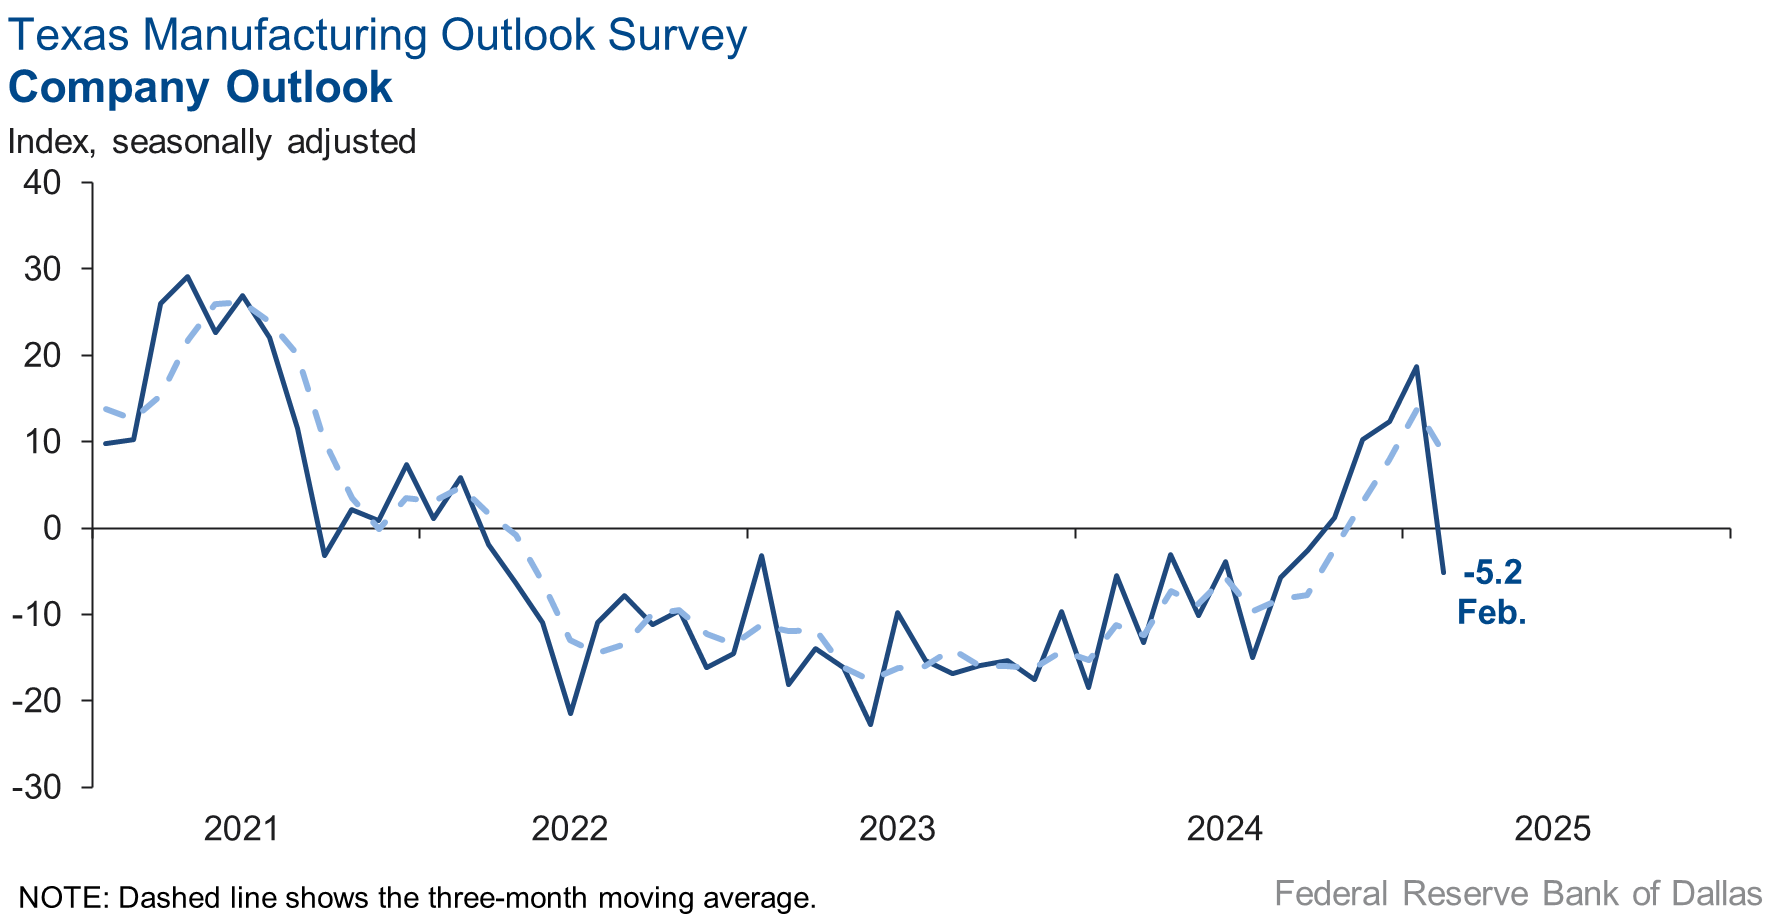
Perceptions of broader business conditions worsened in February. The general business activity index tumbled 22 points to -8.3, and the company outlook index fell 24 points to -5.2. The outlook uncertainty index shot up to 29.2 from a near-zero reading last month, reaching a seven-month high.
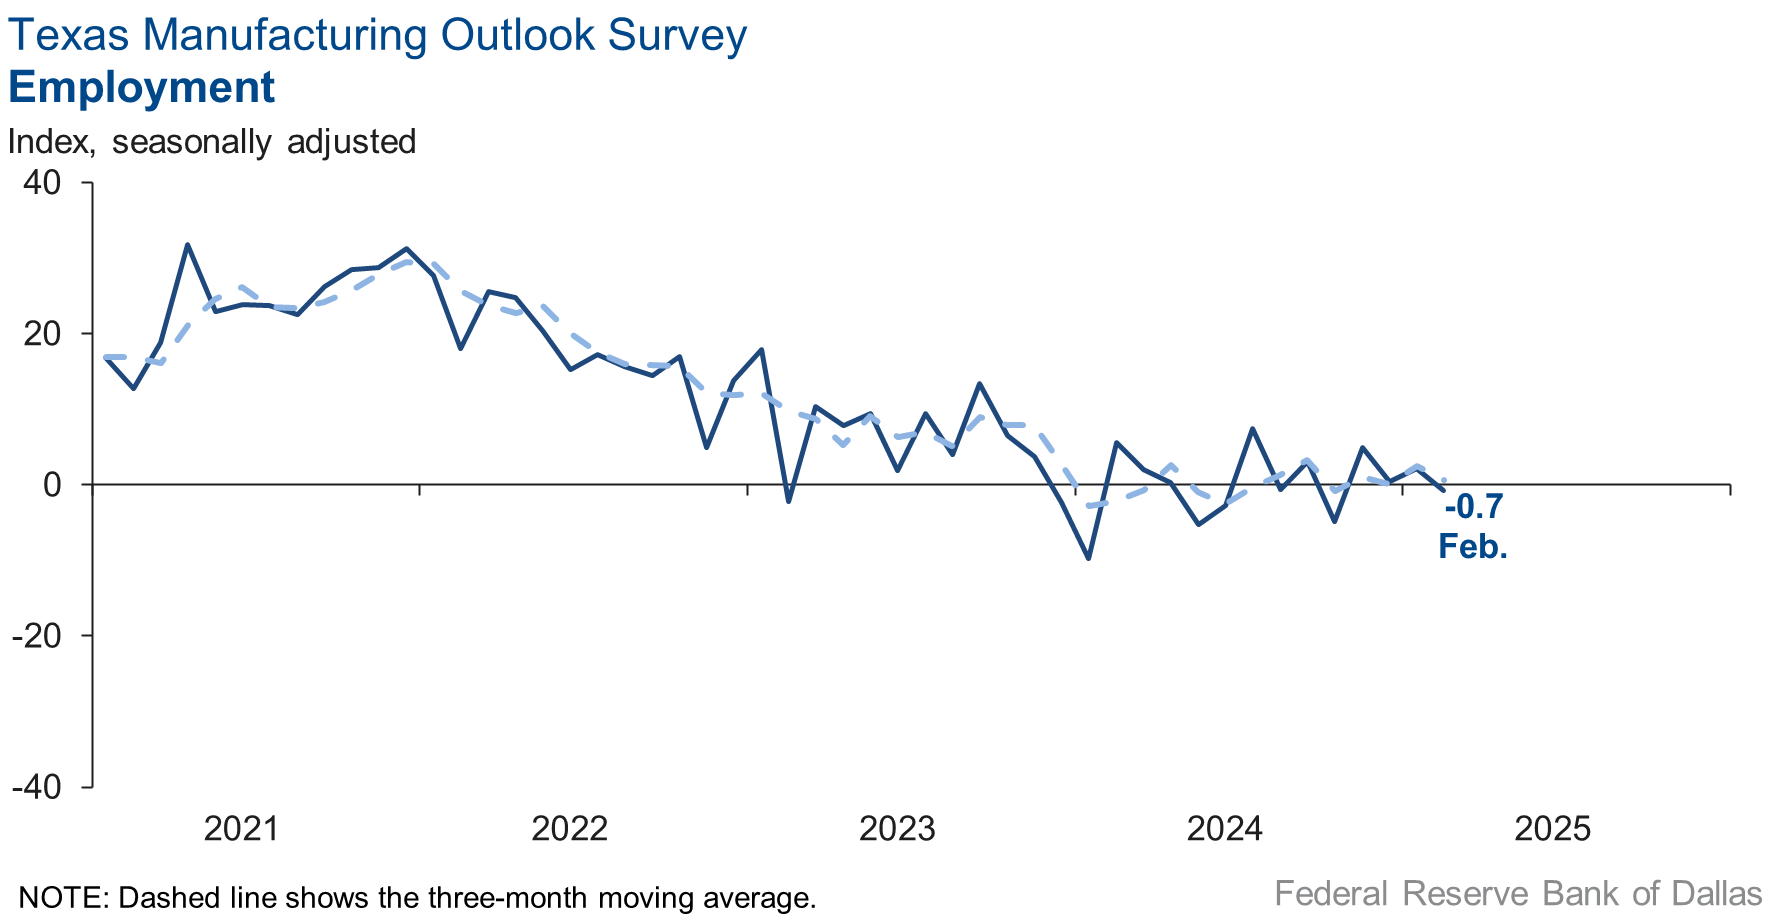
Labor market measures suggested flat head counts and shorter workweeks this month. The employment index came in near zero, with 12 percent of firms noting net hiring and an equal share noting net layoffs. The hours worked index slipped to -14.2, its lowest reading since mid-2020.
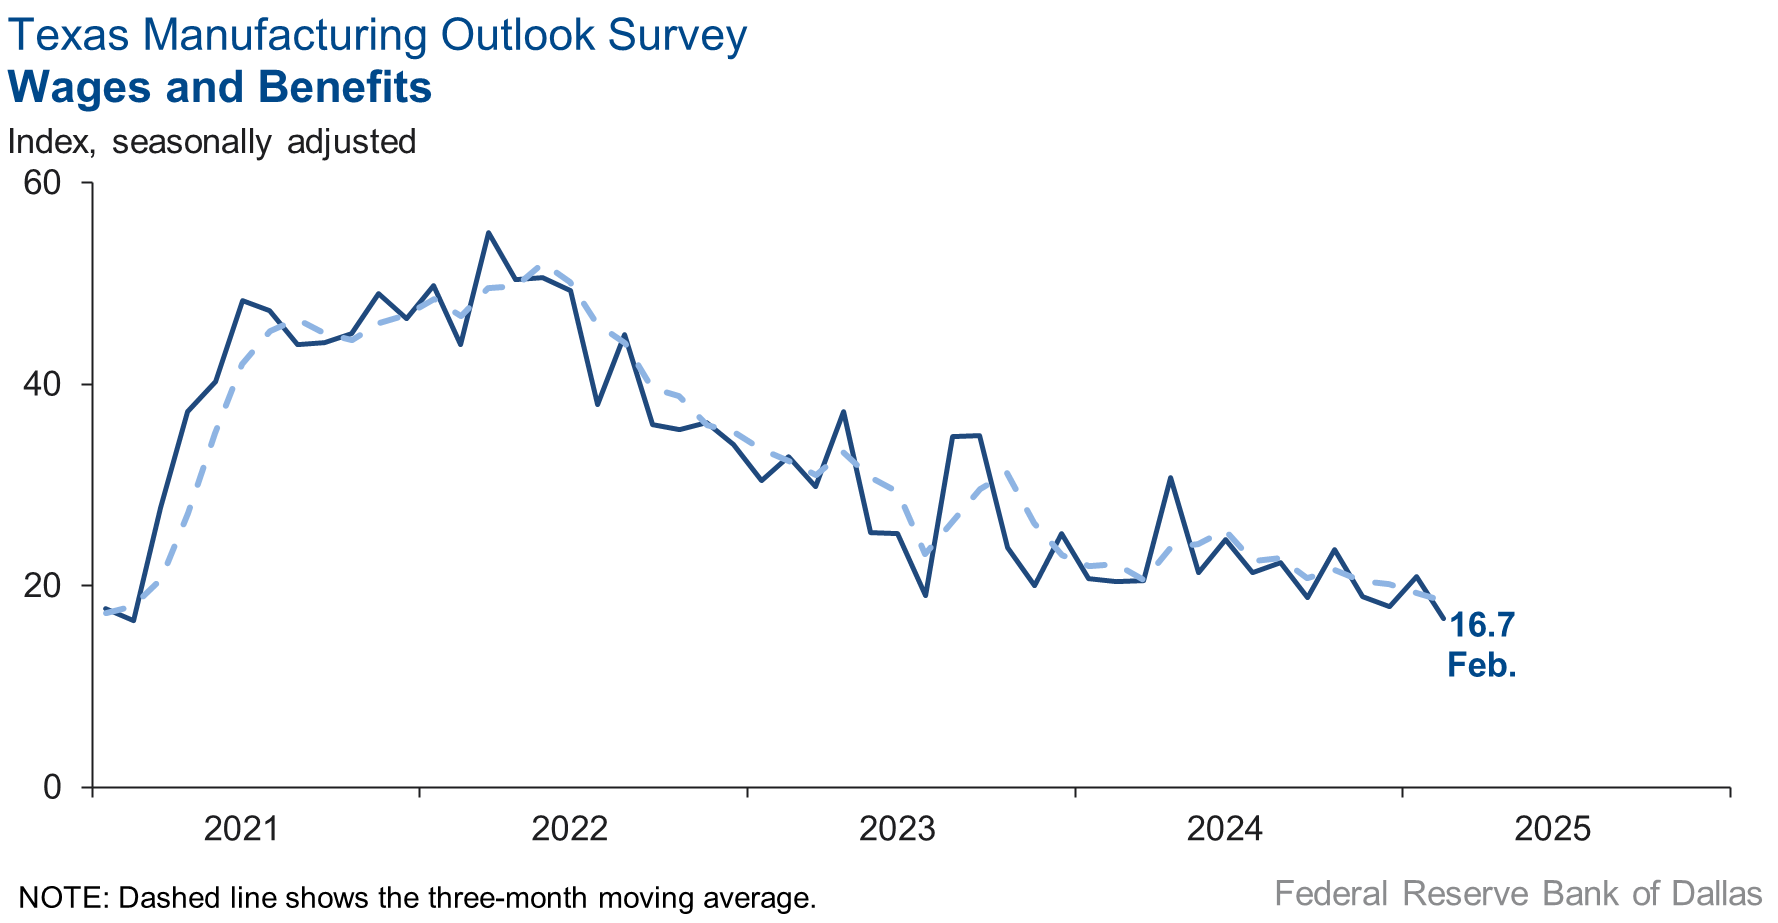
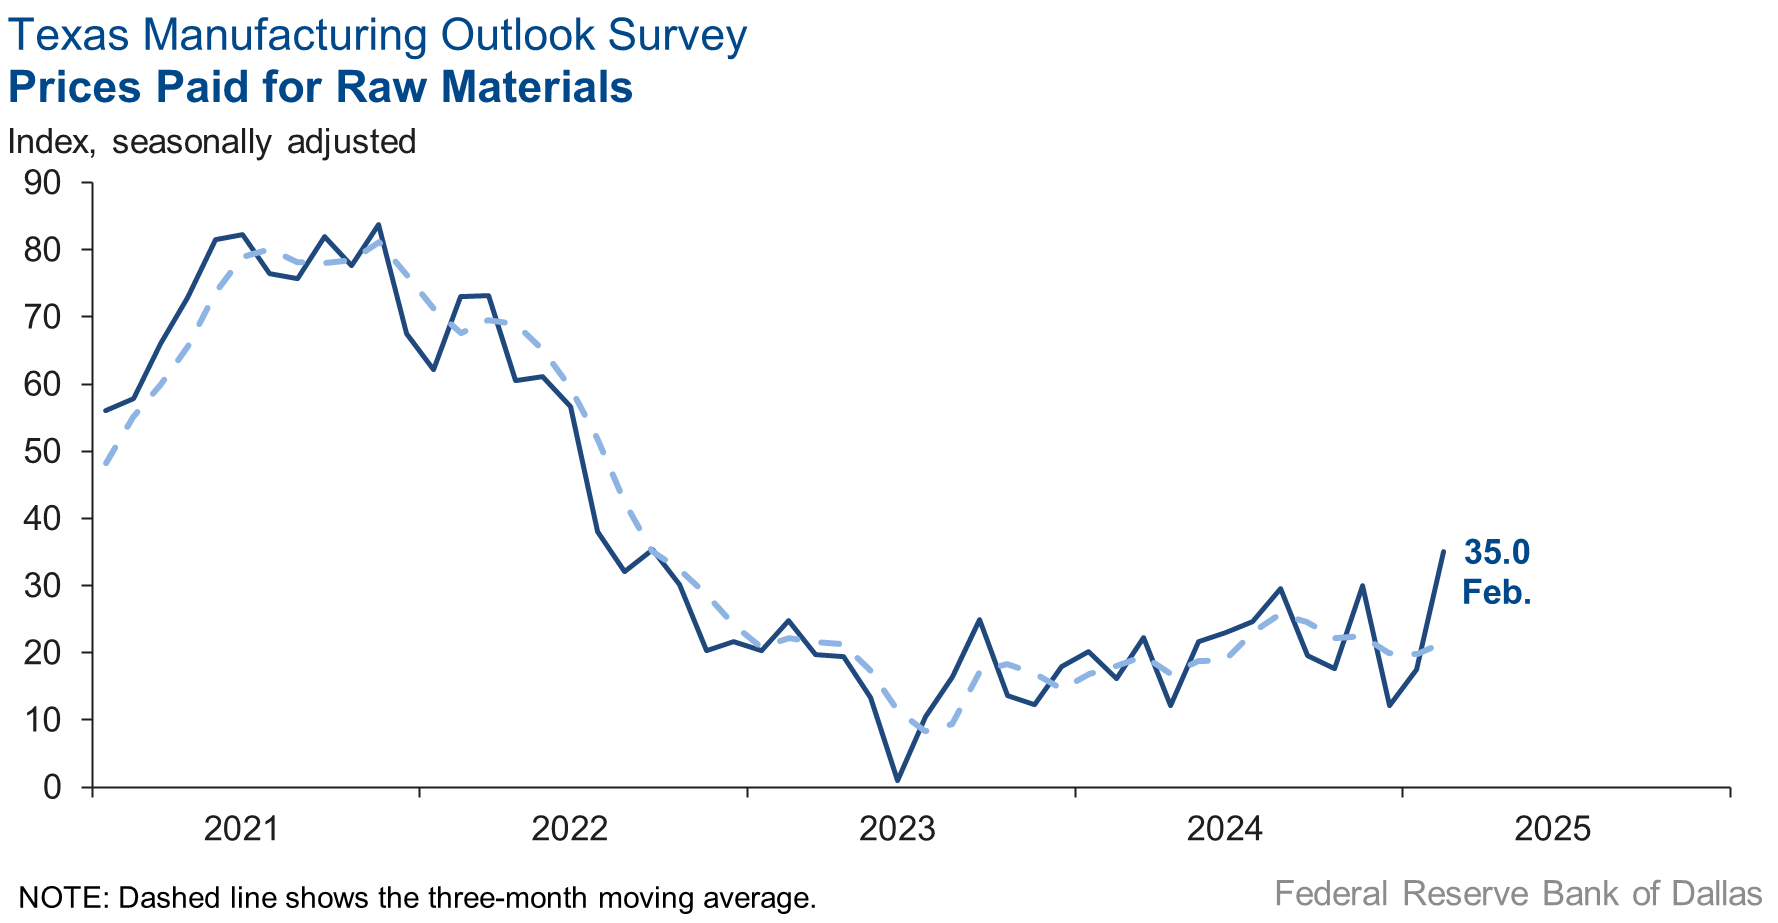
Input cost pressures intensified in February, while wage pressures retreated slightly. The raw materials prices index pushed up 18 points to 35.0, a multiyear high. The finished goods prices index inched up to 7.8, near its average level. The wages and benefits index edged down to 16.7 from 20.9.
Expectations are for increased manufacturing activity six months from now, though the future indexes retreated from elevated January levels. The future production index fell to 28.3 from 44.8, and the future general business activity index fell to 7.7 from 35.5. Other indexes of future manufacturing activity also fell this month but remained positive.
Next release: Monday, March 31
Data were collected Feb. 11–19, and 89 of the 118 Texas manufacturers surveyed submitted a response. The Dallas Fed conducts the Texas Manufacturing Outlook Survey monthly to obtain a timely assessment of the state’s factory activity. Firms are asked whether output, employment, orders, prices and other indicators increased, decreased or remained unchanged over the previous month.
Survey responses are used to calculate an index for each indicator. Each index is calculated by subtracting the percentage of respondents reporting a decrease from the percentage reporting an increase. When the share of firms reporting an increase exceeds the share reporting a decrease, the index will be greater than zero, suggesting the indicator has increased over the prior month. If the share of firms reporting a decrease exceeds the share reporting an increase, the index will be below zero, suggesting the indicator has decreased over the prior month. An index will be zero when the number of firms reporting an increase is equal to the number of firms reporting a decrease. Data have been seasonally adjusted as necessary.
Results summary
Historical data are available from June 2004 to the most current release month.
| Business Indicators Relating to Facilities and Products in Texas Current (versus previous month) | ||||||||
| Indicator | Feb Index | Jan Index | Change | Series Average | Trend* | % Reporting Increase | % Reporting No Change | % Reporting Decrease |
Production | –9.1 | 12.2 | –21.3 | 9.6 | 1(–) | 19.3 | 52.3 | 28.4 |
Capacity Utilization | –8.7 | 5.0 | –13.7 | 7.5 | 1(–) | 18.0 | 55.3 | 26.7 |
New Orders | –3.5 | 7.7 | –11.2 | 5.0 | 1(–) | 25.8 | 44.8 | 29.3 |
Growth Rate of Orders | –7.5 | 1.0 | –8.5 | –0.8 | 1(–) | 20.6 | 51.3 | 28.1 |
Unfilled Orders | –9.9 | –4.7 | –5.2 | –2.4 | 6(–) | 9.2 | 71.7 | 19.1 |
Shipments | 5.6 | 8.7 | –3.1 | 8.0 | 3(+) | 28.9 | 47.8 | 23.3 |
Delivery Time | –6.3 | –4.0 | –2.3 | 0.7 | 23(–) | 7.7 | 78.3 | 14.0 |
Finished Goods Inventories | –9.1 | –8.5 | –0.6 | –3.2 | 2(–) | 13.6 | 63.6 | 22.7 |
Prices Paid for Raw Materials | 35.0 | 17.5 | +17.5 | 27.1 | 58(+) | 39.4 | 56.2 | 4.4 |
Prices Received for Finished Goods | 7.8 | 6.2 | +1.6 | 8.6 | 2(+) | 15.2 | 77.4 | 7.4 |
Wages and Benefits | 16.7 | 20.9 | –4.2 | 21.2 | 58(+) | 20.8 | 75.1 | 4.1 |
Employment | –0.7 | 2.2 | –2.9 | 7.4 | 1(–) | 11.7 | 75.9 | 12.4 |
Hours Worked | –14.2 | 1.9 | –16.1 | 3.1 | 1(–) | 9.1 | 67.6 | 23.3 |
Capital Expenditures | 8.6 | 13.0 | –4.4 | 6.6 | 17(+) | 19.7 | 69.2 | 11.1 |
| General Business Conditions Current (versus previous month) | ||||||||
| Indicator | Feb Index | Jan Index | Change | Series Average | Trend** | % Reporting Improved | % Reporting No Change | % Reporting Worsened |
Company Outlook | –5.2 | 18.7 | –23.9 | 4.6 | 1(–) | 19.2 | 56.5 | 24.4 |
General Business Activity | –8.3 | 14.1 | –22.4 | 0.7 | 1(–) | 17.8 | 56.1 | 26.1 |
| Indicator | Feb Index | Jan Index | Change | Series Average | Trend* | % Reporting Increase | % Reporting No Change | % Reporting Decrease |
Outlook Uncertainty | 29.2 | 1.3 | +27.9 | 16.8 | 46(+) | 41.6 | 46.1 | 12.4 |
| Business Indicators Relating to Facilities and Products in Texas Future (six months ahead) | ||||||||
| Indicator | Feb Index | Jan Index | Change | Series Average | Trend* | % Reporting Increase | % Reporting No Change | % Reporting Decrease |
Production | 28.3 | 44.8 | –16.5 | 36.3 | 58(+) | 41.6 | 45.1 | 13.3 |
Capacity Utilization | 28.4 | 41.9 | –13.5 | 33.2 | 58(+) | 40.8 | 46.8 | 12.4 |
New Orders | 25.8 | 46.3 | –20.5 | 33.8 | 28(+) | 39.0 | 47.8 | 13.2 |
Growth Rate of Orders | 19.6 | 43.0 | –23.4 | 25.0 | 21(+) | 36.3 | 46.9 | 16.7 |
Unfilled Orders | –1.4 | 12.9 | –14.3 | 2.9 | 1(–) | 15.6 | 67.4 | 17.0 |
Shipments | 32.1 | 47.8 | –15.7 | 34.8 | 58(+) | 40.6 | 50.9 | 8.5 |
Delivery Time | 0.5 | 3.7 | –3.2 | –1.3 | 3(+) | 8.4 | 83.7 | 7.9 |
Finished Goods Inventories | 4.8 | –4.0 | +8.8 | –0.1 | 1(+) | 18.1 | 68.7 | 13.3 |
Prices Paid for Raw Materials | 59.0 | 39.9 | +19.1 | 33.4 | 59(+) | 60.0 | 39.0 | 1.0 |
Prices Received for Finished Goods | 42.0 | 35.6 | +6.4 | 21.0 | 58(+) | 46.9 | 48.1 | 4.9 |
Wages and Benefits | 39.5 | 36.7 | +2.8 | 39.3 | 58(+) | 41.8 | 55.9 | 2.3 |
Employment | 16.5 | 27.7 | –11.2 | 22.9 | 57(+) | 29.6 | 57.3 | 13.1 |
Hours Worked | 8.8 | 9.2 | –0.4 | 8.8 | 11(+) | 16.2 | 76.4 | 7.4 |
Capital Expenditures | 21.1 | 27.3 | –6.2 | 19.5 | 57(+) | 28.6 | 63.9 | 7.5 |
| General Business Conditions Future (six months ahead) | ||||||||
| Indicator | Feb Index | Jan Index | Change | Series Average | Trend** | % Reporting Increase | % Reporting No Change | % Reporting Worsened |
Company Outlook | 13.9 | 36.1 | –22.2 | 18.5 | 15(+) | 33.2 | 47.4 | 19.3 |
General Business Activity | 7.7 | 35.5 | –27.8 | 12.5 | 9(+) | 25.6 | 56.5 | 17.9 |
*Shown is the number of consecutive months of expansion or contraction in the underlying indicator. Expansion is indicated by a positive index reading and denoted by a (+) in the table. Contraction is indicated by a negative index reading and denoted by a (–) in the table.
**Shown is the number of consecutive months of improvement or worsening in the underlying indicator. Improvement is indicated by a positive index reading and denoted by a (+) in the table. Worsening is indicated by a negative index reading and denoted by a (–) in the table.
Data have been seasonally adjusted as necessary.

Comments from survey respondents
These comments are from respondents’ completed surveys and have been edited for publication.
- The dynamic tariff situation is one for us to follow and seek to understand. The approach to improve export tariffs for U.S. companies seeking to deliver goods in foreign countries is good, and we believe the current tactic of reciprocal tariffs could drive improvement for U.S. export competitiveness.
- Tariff threats and uncertainty are extremely disruptive.
- Keep lowering interest rates, please.
- The overall effects of administrative change have stalled consumer and customer spending.
- We are uncertain as to the full impact of tariffs related to our business. We procure parts from overseas. We have lost business opportunities for production of goods that goes to other countries as a result of tariffs. We may see new opportunities for products built elsewhere for companies who wish to shift manufacturing to the U.S. to avoid tariffs. There is much uncertainty at the moment as to how this will shake out.
- With some of the new Buy America changes and tariffs incoming, we are looking at closing the business.
- We are seeing broad signals of demand cyclically recovering. Personal electronics, communications equipment and enterprise business are now several quarters into a cyclical recovery. We are seeing industrial and automotive inventories cleaned out, and our revenues are returning to consumption.
- We are starting to see old requests for quotations starting to receive purchase orders. We are still having issues filling positions.
- We are still in a low-volume period but are holding steady as we’ve flexed down capacity and costs accordingly.
- President Trump’s freeze on government contracts has had a dramatic impact on us. USAID [United States Agency for International Development] is our major customer. That aside, it needed to happen.
- The current political environment under President Trump has increased the uncertainty of the consumer market. As a food manufacturer, we have noticed small customers are struggling (unable to pay bills on time), and the larger national customers have reduced their purchases. Imposing tariffs on our major trading partners will lead to higher consumer prices. The items we import are preparing to raise prices. I have more uncertainty about the future business/consumer environment than ever before in my 40 years of operating businesses.
- The back-and-forth tariff talk has been very stressful, but it has not been disruptive so far.
- Immigration laws and raids [are affecting our business].
- We are experiencing up-and-down waves. Hopefully, it will pick back up now that the election is over.
- The phone is ringing. There's some trepidation about inflation and tariff impact, but we have confidence that orders are about to come. More importantly, our industry feels better in general about where our country is going as a whole. The direction provides hope for the long term, even if the cash register is not rattling quite yet.
- Last month was our best month in over a year. We are seeing much more business activity and expect this trend to continue. We are finally seeing a bright future for our business.
- Sales volumes have been trending downward in the last 28 months. We have cut hours to 36 per week, and it is not enough to get profitable. Next week, we are cutting further to 32 hours and laying off three people. The uncertainty in tariff threats and general chaos of another Trump presidency is weighing heavy on our business. All customers are decreasing or pushing out orders—taking a wait-and-see posture. Automotive OEM [original equipment manufacturer] and aftermarket represents 72 percent of our sales. The outlook from automotive OEM is that production should begin to pick up in second quarter 2025, but no firm increases have been promised. The outlook is bleak.
- It is very hard to plan. Interest rates? Tariffs? Wow.
- Currently it is very slow, and we started reduced production hours in the plant. Orders are also very slow. A price increase in the industry has been delayed 30 days due to softness.
- Customers, vendors and ourselves are all trying to get ahead of anticipated global trade challenges. It is stressing capacities, especially with production personnel.
- The proposed 25 percent tariffs on steel imports will directly and favorably improve the bottom line as a domestic steel manufacturer. However, uncertainty is sky high.
- It is A Tale of Two Cities. February was down compared with January, but our outlook remains positive due to the 25 percent Section 232 tariff on aluminum. This tariff is expected to slow the influx of foreign aluminum from Mexico and other countries. Currently, a significant amount of aluminum is being dumped into the U.S. market, with many countries subsidizing their exports to gain a competitive edge. The bottom line: If the tariffs remain in place, they will benefit our industry. However, if they are reversed, many companies in our sector will struggle to survive.
- Production improvements are directly related to capital expenditures in 2024 and continuing in 2025. Raw materials are expected to increase due to impending tariffs.
- It's so weird how we are slow as molasses right now, yet a year ago, we were very busy at this time. I'm very worried about the possible tariffs affecting some of our material costs, which we will have no choice but to pass along to our customers. This is a terrible policy decision and hopefully will not be very long lived.
- No major change from January. We made the decision a few months ago to purchase more inventory than usual, and the negative cash impact of making this larger purchase was worth minimizing uncertainty about future pricing and impacts of tariffs. (We import from overseas.)
- The new tariffs will have a big impact on the demand for our products. This applies primarily to the 25 percent on goods from Mexico. The impact of the additional 25 percent for steel and aluminum will also be detrimental to demand, the extent of which is still being evaluated.
- The Trump tariff situation is creating uncertainty about our future material costs later this year.
- I was expecting a pickup in business activity in third quarter 2025 and now think it will be first quarter 2026.
Historical Data
Historical data can be downloaded dating back to June 2004.
Indexes
Download indexes for all indicators. For the definitions of all variables, see Data Definitions.
| Unadjusted |
| Seasonally adjusted |
All Data
Download indexes and components of the indexes (percentage of respondents reporting increase, decrease, or no change). For the definitions of all variables, see Data Definitions.
| Unadjusted |
| Seasonally adjusted |
Questions regarding the Texas Business Outlook Surveys can be addressed to Emily Kerr at emily.kerr@dal.frb.org.
Sign up for our email alert to be automatically notified as soon as the latest Texas Manufacturing Outlook Survey is released on the web.