Texas Manufacturing Outlook Survey

Texas manufacturing activity remains flat in July amid weakening demand
For this month’s survey, Texas business executives were asked supplemental questions on the labor market and financial conditions. Results for these questions from the Texas Manufacturing Outlook Survey, Texas Service Sector Outlook Survey and Texas Retail Outlook Survey have been released together. Read the special questions results.
Texas factory activity was flat again in July, according to business executives responding to the Texas Manufacturing Outlook Survey. The production index, a key measure of state manufacturing conditions, held fairly steady at -1.3, with the near-zero reading signaling little change in output from June.
Other measures of manufacturing activity weakened this month. The new orders index dropped 12 points to -12.8 in July, signaling a pullback in demand. The capacity utilization and shipments indexes also slipped, falling to -10.0 and -16.3, respectively.
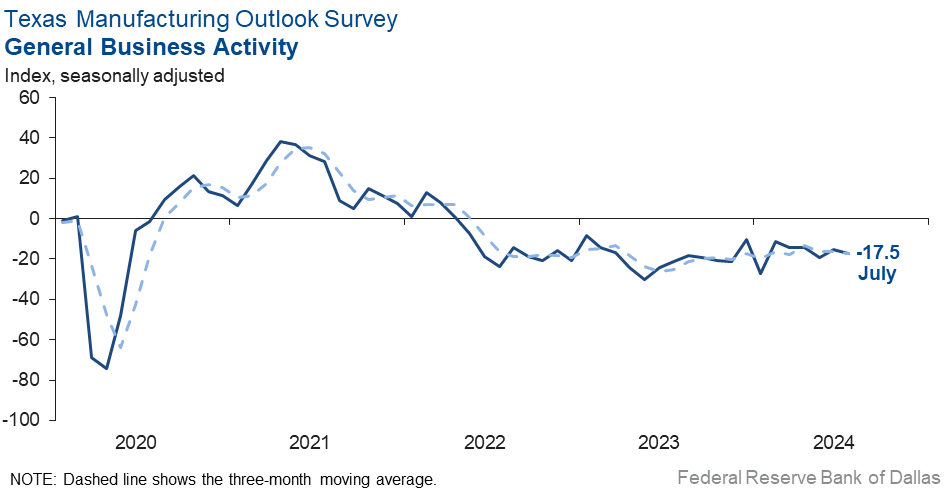
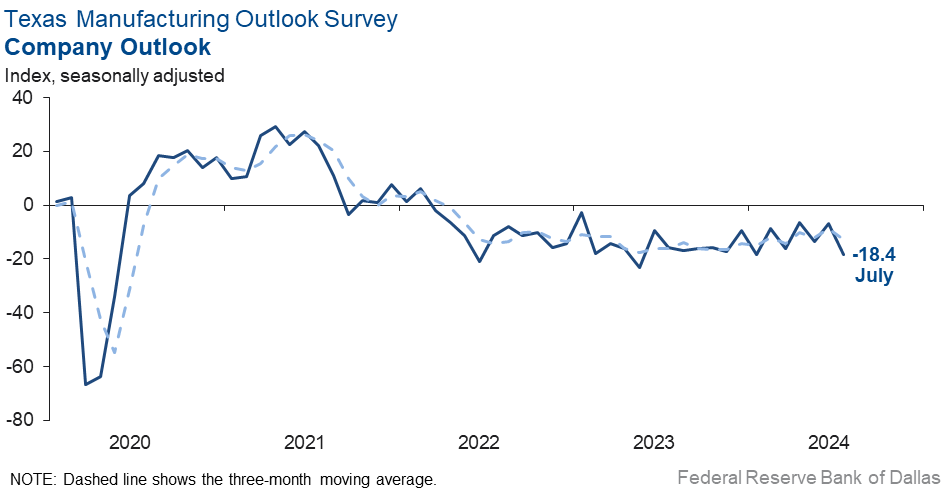
Perceptions of broader business conditions continued to worsen in July. The general business activity index inched down to -17.5 and the company outlook index stumbled 12 points to -18.4. The outlook uncertainty index shot up to 30.7, its highest reading since fall 2022.
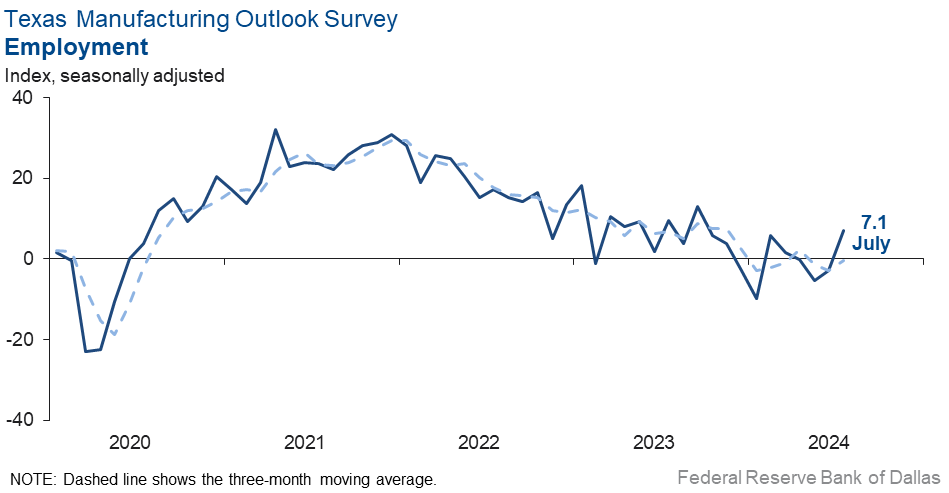
Labor market measures suggested employment increases but shorter workweeks this month. The employment index posted a 10-point gain, rising to 7.1 and its highest level in 10 months. Nineteen percent of firms noted net hiring, while 12 percent noted net layoffs. The hours worked index remained negative and fell to -13.8 from -5.0.
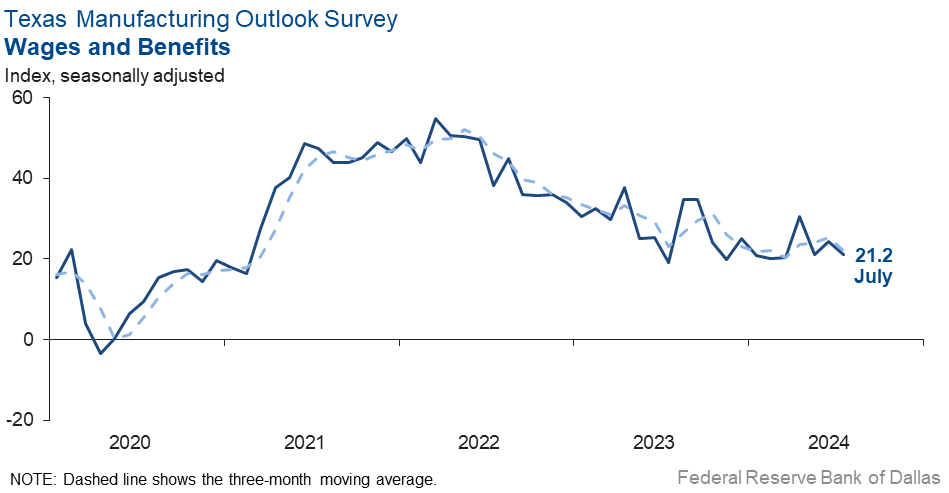
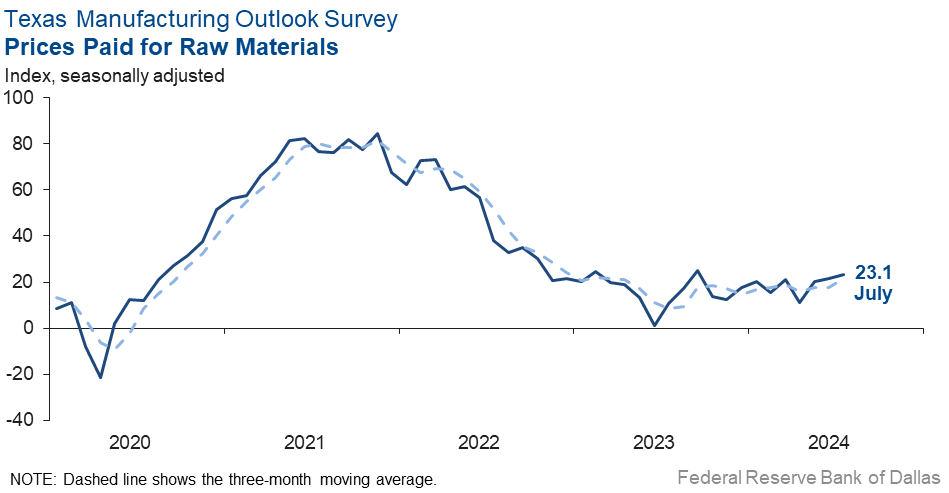
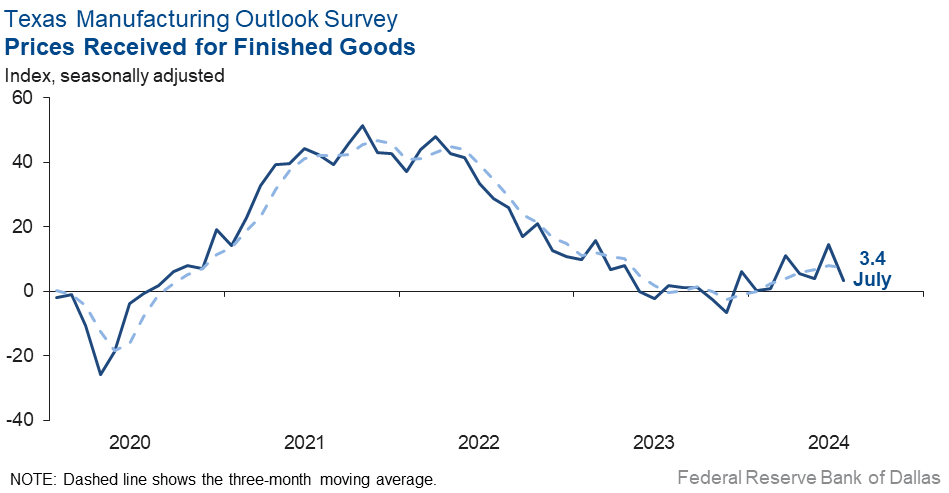
Upward pressure on prices and wages continued in July. The wages and benefits index edged down to 21.2, a reading in line with the historical average. The raw materials prices index was mostly unchanged at 23.1, while the finished goods prices index slid down 11 points to 3.4.
Expectations regarding future manufacturing activity mostly pushed up this month. The future production index rose five points to 32.0, and the future general business activity index rose nine points to 21.6, its highest reading since fall 2021. Most other indexes of future manufacturing activity also rose in July.
Next release: Monday, August 26
Data were collected July 16–24, and 80 of the 125 Texas manufacturers surveyed submitted a response. The Dallas Fed conducts the Texas Manufacturing Outlook Survey monthly to obtain a timely assessment of the state’s factory activity. Firms are asked whether output, employment, orders, prices and other indicators increased, decreased or remained unchanged over the previous month.
Survey responses are used to calculate an index for each indicator. Each index is calculated by subtracting the percentage of respondents reporting a decrease from the percentage reporting an increase. When the share of firms reporting an increase exceeds the share reporting a decrease, the index will be greater than zero, suggesting the indicator has increased over the prior month. If the share of firms reporting a decrease exceeds the share reporting an increase, the index will be below zero, suggesting the indicator has decreased over the prior month. An index will be zero when the number of firms reporting an increase is equal to the number of firms reporting a decrease. Data have been seasonally adjusted as necessary.
Results summary
Historical data are available from June 2004 to the most current release month.
| Business Indicators Relating to Facilities and Products in Texas Current (versus previous month) | ||||||||
| Indicator | Jul Index | Jun Index | Change | Series Average | Trend* | % Reporting Increase | % Reporting No Change | % Reporting Decrease |
Production | –1.3 | 0.7 | –2.0 | 9.8 | 1(–) | 27.5 | 43.6 | 28.8 |
Capacity Utilization | –10.0 | –4.8 | –5.2 | 7.8 | 3(–) | 18.8 | 52.4 | 28.8 |
New Orders | –12.8 | –1.3 | –11.5 | 5.1 | 5(–) | 23.8 | 39.6 | 36.6 |
Growth Rate of Orders | –16.6 | –4.3 | –12.3 | –0.7 | 3(–) | 16.9 | 49.6 | 33.5 |
Unfilled Orders | –26.6 | –4.7 | –21.9 | –2.2 | 10(–) | 5.7 | 62.0 | 32.3 |
Shipments | –16.3 | 2.8 | –19.1 | 8.1 | 1(–) | 20.8 | 42.2 | 37.1 |
Delivery Time | –5.3 | –3.2 | –2.1 | 0.9 | 16(–) | 8.9 | 76.9 | 14.2 |
Finished Goods Inventories | –5.0 | –2.5 | –2.5 | –3.2 | 4(–) | 16.3 | 62.5 | 21.3 |
Prices Paid for Raw Materials | 23.1 | 21.5 | +1.6 | 27.2 | 51(+) | 32.4 | 58.3 | 9.3 |
Prices Received for Finished Goods | 3.4 | 14.4 | –11.0 | 8.6 | 8(+) | 12.4 | 78.6 | 9.0 |
Wages and Benefits | 21.2 | 24.3 | –3.1 | 21.2 | 51(+) | 23.1 | 75.0 | 1.9 |
Employment | 7.1 | –2.9 | +10.0 | 7.5 | 1(+) | 19.3 | 68.5 | 12.2 |
Hours Worked | –13.8 | –5.0 | –8.8 | 3.2 | 10(–) | 8.6 | 69.1 | 22.4 |
Capital Expenditures | 0.8 | 0.9 | –0.1 | 6.5 | 10(+) | 18.4 | 64.0 | 17.6 |
| General Business Conditions Current (versus previous month) | ||||||||
| Indicator | Jul Index | Jun Index | Change | Series Average | Trend** | % Reporting Improved | % Reporting No Change | % Reporting Worsened |
Company Outlook | –18.4 | –6.9 | –11.5 | 4.5 | 29(–) | 12.4 | 56.8 | 30.8 |
General Business Activity | –17.5 | –15.1 | –2.4 | 0.8 | 27(–) | 13.6 | 55.3 | 31.1 |
| Indicator | Jul Index | Jun Index | Change | Series Average | Trend* | % Reporting Increase | % Reporting No Change | % Reporting Decrease |
Outlook Uncertainty | 30.7 | 9.8 | +20.9 | 17.2 | 39(+) | 33.3 | 64.1 | 2.6 |
| Business Indicators Relating to Facilities and Products in Texas Future (six months ahead) | ||||||||
| Indicator | Jul Index | Jun Index | Change | Series Average | Trend* | % Reporting Increase | % Reporting No Change | % Reporting Decrease |
Production | 32.0 | 27.1 | +4.9 | 36.3 | 51(+) | 42.3 | 47.4 | 10.3 |
Capacity Utilization | 21.4 | 21.3 | +0.1 | 33.1 | 51(+) | 32.0 | 57.4 | 10.6 |
New Orders | 30.3 | 29.8 | +0.5 | 33.6 | 21(+) | 40.6 | 49.0 | 10.3 |
Growth Rate of Orders | 19.3 | 24.5 | –5.2 | 24.8 | 14(+) | 28.6 | 62.1 | 9.3 |
Unfilled Orders | –2.6 | –2.9 | +0.3 | 2.8 | 5(–) | 7.7 | 82.0 | 10.3 |
Shipments | 29.1 | 28.1 | +1.0 | 34.7 | 51(+) | 39.7 | 49.7 | 10.6 |
Delivery Time | 4.6 | –0.4 | +5.0 | –1.5 | 1(+) | 8.9 | 86.8 | 4.3 |
Finished Goods Inventories | –6.9 | –8.0 | +1.1 | –0.1 | 3(–) | 12.3 | 68.5 | 19.2 |
Prices Paid for Raw Materials | 28.5 | 21.2 | +7.3 | 33.4 | 52(+) | 38.4 | 51.7 | 9.9 |
Prices Received for Finished Goods | 23.0 | 19.5 | +3.5 | 20.8 | 51(+) | 31.1 | 60.8 | 8.1 |
Wages and Benefits | 39.2 | 33.2 | +6.0 | 39.3 | 242(+) | 40.2 | 58.8 | 1.0 |
Employment | 18.7 | 11.7 | +7.0 | 22.8 | 50(+) | 24.5 | 69.7 | 5.8 |
Hours Worked | 8.8 | 3.0 | +5.8 | 8.8 | 4(+) | 18.1 | 72.6 | 9.3 |
Capital Expenditures | 22.4 | 12.6 | +9.8 | 19.4 | 50(+) | 32.3 | 57.8 | 9.9 |
| General Business Conditions Future (six months ahead) | ||||||||
| Indicator | Jul Index | Jun Index | Change | Series Average | Trend** | % Reporting Increase | % Reporting No Change | % Reporting Worsened |
Company Outlook | 22.0 | 22.9 | –0.9 | 18.3 | 8(+) | 29.1 | 63.8 | 7.1 |
General Business Activity | 21.6 | 12.9 | +8.7 | 12.2 | 2(+) | 28.7 | 64.2 | 7.1 |
*Shown is the number of consecutive months of expansion or contraction in the underlying indicator. Expansion is indicated by a positive index reading and denoted by a (+) in the table. Contraction is indicated by a negative index reading and denoted by a (–) in the table.
**Shown is the number of consecutive months of improvement or worsening in the underlying indicator. Improvement is indicated by a positive index reading and denoted by a (+) in the table. Worsening is indicated by a negative index reading and denoted by a (–) in the table.
Data have been seasonally adjusted as necessary.


Comments from survey respondents
These comments are from respondents’ completed surveys and have been edited for publication.
- We have seen a more stable market over the last six months for our products (which is primarily dinner sausage). Nielsen data for our category show small-to-moderate growth over the last 52 weeks, and our market share is growing in our core markets. This is leading to a more predictable environment for our company. Wages increased this month due to merit increases that we gave our team at the beginning of our fiscal year, which is July.
- The business environment feels stable, but beef prices continue to increase beyond typical seasonality due to supply constraints.
- The destabilization of our country and the politicization of things continue to impact our business.
- Activity has slowed down, but we anticipate an uptick soon.
- We have slowed down some from our very hectic pace of activity in late spring and through June. We hear about lots of slowness in our industry, but we continue to be pretty busy, mainly with larger jobs but then also with other smaller ones. We have a very large capital purchase machine arriving in early October. We are hopeful that the Federal Reserve will have a rate cut and that general business activity will pick up. We are actually seeing some reduction in prices and are hopeful we will not need to raise prices next year.
- Hurricane damage and power outages have decreased production.
- Customer demand is the overriding concern. Decreased credit availability and affordability for the markets we sell into have all but stopped demand. I estimate we are operating at 30–40 percent capacity.
- Order volume continues to see small declines. Inefficiencies in the short term will require staffing adjustments over the next few months to align with the new lower baseline. There is no major change to our long-term outlook; we are still viewing the current pullback as temporary, and we maintain a positive outlook beyond the next 12–24 months.
- Elections [are an issue affecting our business].
- Business activity is horrible, and we are seeing no signs of improvement.
- Inquiries and orders activity has seemingly halted. The brakes are on. This is pretty common in presidential election years, but this comes at a time when things were already volatile due to price pressures and massive inflationary pressures.
- At this point, we're just hoping for a favorable election outcome and looking forward to 2025. The summer doldrums have hit hard and would appear to be unrelenting with respect to what we see in our crystal ball. We have some small jobs to complete, and we're searching wider and further for new work, but we have yet to strike gold.
- Many customers are holding off on expenditures as well as allowing for cost-of-living adjustments to prices. The market continues to be soft, and with uncertainty in the election year, even our federal business is a bit stagnant.
- We need lower interest rates, so end customers resume buying capital equipment again.
- We typically see weakness in presidential election years as companies sort through uncertainty or slow down during those periods. With the recent events involving both presumed candidates, that uncertainty has increased, which makes it very difficult to guess what might happen. Our business is likely to be impacted by tariff policies in a negative way because some projects potentially will go away entirely. For businesses we serve that ship to other countries, we have already lost sales because it is more affordable to build those products outside the U.S. for consumption outside the U.S. That was not the case before tariffs entered the equation. We were able to build products for shipment to other parts of the globe. Both [political] parties have shown a willingness to maintain and increase tariffs, which could negatively impact our sales.
- We are expecting to see stronger signs of a cyclical recovery in industrial and automotive markets, which have not materialized, yet. This is leading to higher uncertainty that the recovery may be delayed or muted.
- While we still have a large order backlog, new orders are significantly below where we forecasted them to be this year. This will shorten lead times and should allow us to pick up additional orders next year.
- Customer demand is softening. We are also experiencing increasing unfair competition directly from China.
- Due to the hurricane and not having power for over a week, we had significant lost production hours.
Historical Data
Historical data can be downloaded dating back to June 2004.
Indexes
Download indexes for all indicators. For the definitions of all variables, see Data Definitions.
| Unadjusted |
| Seasonally adjusted |
All Data
Download indexes and components of the indexes (percentage of respondents reporting increase, decrease, or no change). For the definitions of all variables, see Data Definitions.
| Unadjusted |
| Seasonally adjusted |
Questions regarding the Texas Business Outlook Surveys can be addressed to Emily Kerr at emily.kerr@dal.frb.org.
Sign up for our email alert to be automatically notified as soon as the latest Texas Manufacturing Outlook Survey is released on the web.