
Dallas Fed Energy Survey
Oil and gas activity edges higher; uncertainty rising, costs increase
Special questions this quarter include an annual update on break-even prices by basin. Questions also focus on regulatory compliance costs, employee head count, mergers and acquisitions in the upstream sector and the impact of steel import tariffs.
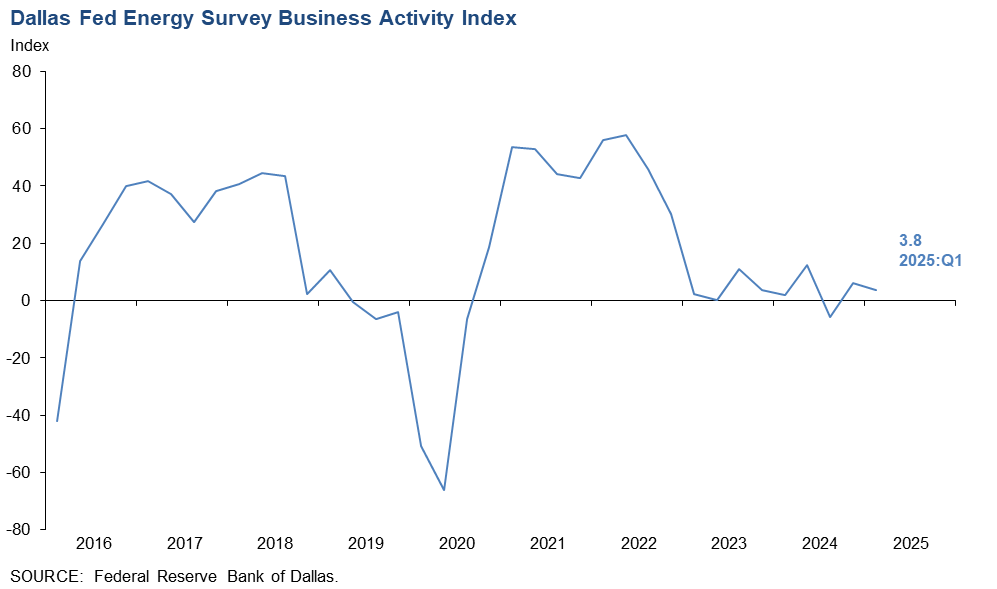
Activity in the oil and gas sector increased slightly in first quarter of 2025, according to oil and gas executives responding to the Dallas Fed Energy Survey. The business activity index, the survey’s broadest measure of the conditions energy firms face in the Eleventh District, remained in positive territory but declined slightly from 6.0 in the fourth quarter 2024 to 3.8 in the first quarter.
The company outlook index decreased 12 points to -4.9, suggesting slight pessimism among firms. Meanwhile, the outlook uncertainty index jumped 21 points to 43.1.
Oil and gas production increased slightly in the first quarter, according to executives at exploration and production firms. The oil production index moved up from 1.1 in the fourth quarter to 5.6 in the first quarter. Meanwhile, the natural gas production index turned positive, rising from -3.5 to 4.8.
Costs increased at a faster pace relative to the prior quarter. Among oilfield services firms, the input cost index advanced, from 23.9 to 30.9. Among E&P firms, the finding and development costs index increased, from 11.5 to 17.1. Meanwhile, the lease operating expenses index rose from 25.6 to 38.7.
The equipment utilization index for oilfield services firms was relatively unchanged at -4.8. The operating margin index decreased from -17.8 to -21.5, indicating margins narrowed at a slightly faster rate. Meanwhile, the prices received for services index swung into positive territory, increasing from -13.0 to 7.1.
The aggregate employment index edged down from 2.2 in the fourth quarter to zero in the first quarter. This suggests employment was unchanged in the quarter. The aggregate employee hours index was relatively unchanged at 0.7. Meanwhile, the aggregate wages and benefits index was also relatively unchanged at 21.6.
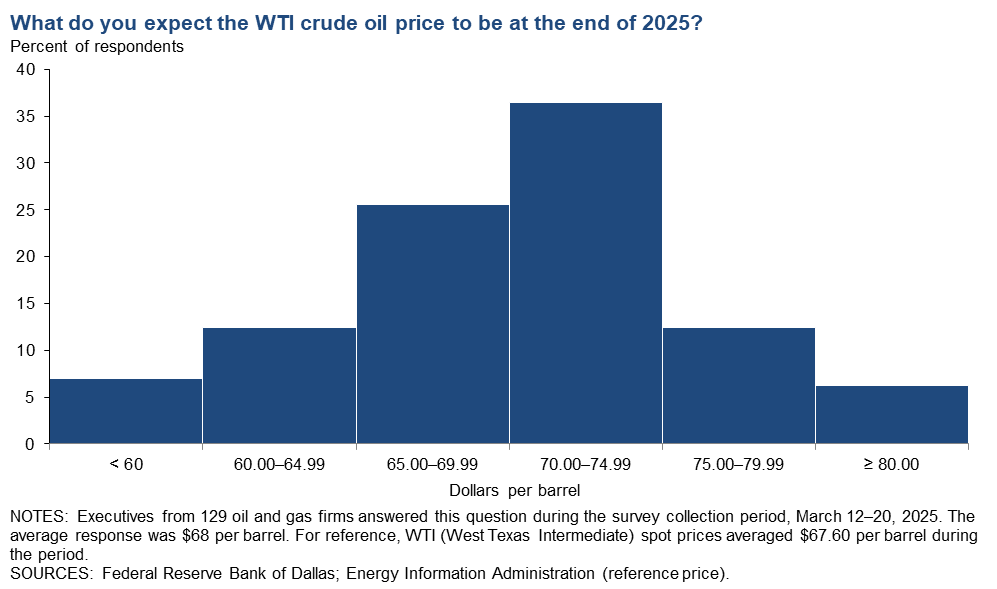
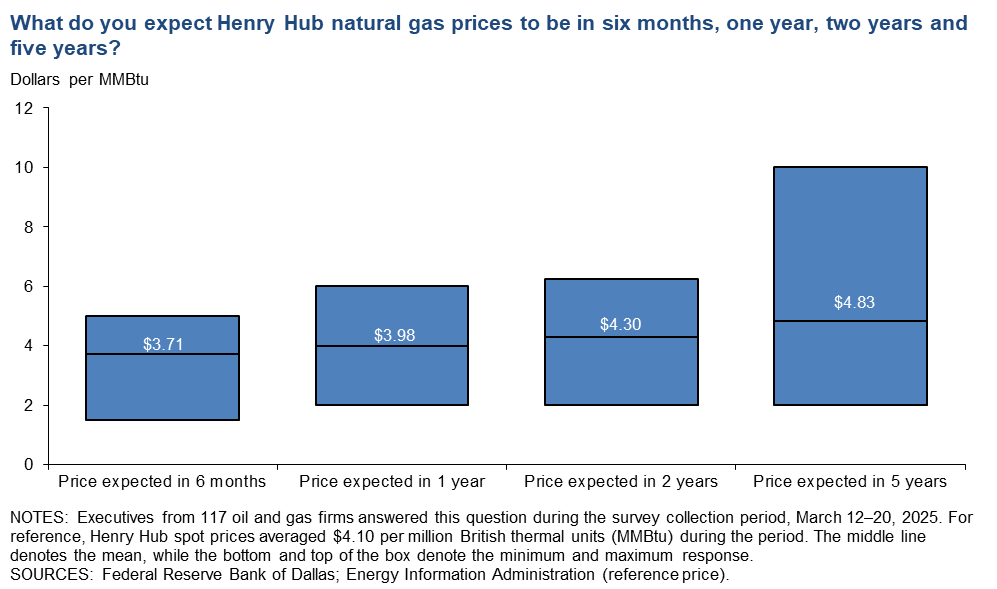
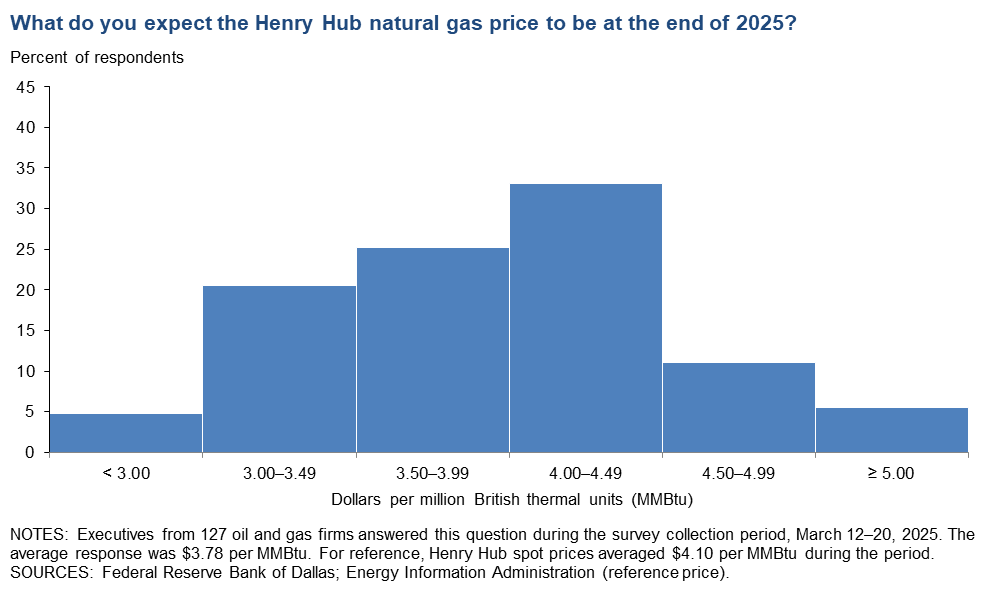
On average, respondents expect a West Texas Intermediate (WTI) oil price of $68 per barrel at year-end 2025; responses ranged from $50 to $100 per barrel. When asked about longer-term expectations, respondents on average said they expect a WTI oil price of $74 per barrel two years from now and $82 per barrel five years from now. Survey participants foresee a Henry Hub natural gas price of $3.78 per million British thermal units (MMBtu) at year-end 2025. When asked about longer-term expectations, respondents on average said they anticipate a Henry Hub gas price of $4.30 per MMBtu two years from now and $4.83 per MMBtu five years from now. For reference, WTI spot prices averaged $67.60 per barrel during the survey collection period, and Henry Hub spot prices averaged $4.10 per MMBtu.
Next release: July 2, 2025
Data were collected March 12–20, and 130 energy firms responded. Of the respondents, 88 were exploration and production firms and 42 were oilfield services firms.
The Dallas Fed conducts the Dallas Fed Energy Survey quarterly to obtain a timely assessment of energy activity among oil and gas firms located or headquartered in the Eleventh District. Firms are asked whether business activity, employment, capital expenditures and other indicators increased, decreased or remained unchanged compared with the prior quarter and with the same quarter a year ago. Survey responses are used to calculate an index for each indicator. Each index is calculated by subtracting the percentage of respondents reporting a decrease from the percentage reporting an increase. When the share of firms reporting an increase exceeds the share reporting a decrease, the index will be greater than zero, suggesting the indicator has increased over the previous quarter. If the share of firms reporting a decrease exceeds the share reporting an increase, the index will be below zero, suggesting the indicator has decreased over the previous quarter.
Price Forecasts
West Texas Intermediate Crude

| West Texas Intermediate crude oil price, year-end 2025 | ||||
| Indicator | Survey Average | Low Forecast | High Forecast | Price During Survey |
Current quarter | $68.32 | $50.00 | $100.00 | $67.60 |
Prior quarter | $71.13 | $53.00 | $100.00 | $70.66 |
| NOTE: Price during survey is an average of daily spot prices during the survey collection period. SOURCES: Federal Reserve Bank of Dallas; Energy Information Administration. | ||||
Henry Hub Natural Gas
| Henry Hub natural gas price, year-end 2025 | ||||
| Indicator | Survey Average | Low Forecast | High Forecast | Price During Survey |
Current quarter | $3.78 | $2.00 | $5.25 | $4.10 |
Prior quarter | $3.19 | $2.00 | $4.80 | $3.04 |
| NOTE: Price during survey is an average of daily spot prices during the survey collection period. SOURCES: Federal Reserve Bank of Dallas; Energy Information Administration. | ||||
Special Questions
Data were collected March 12–20; 129 oil and gas firms responded to the special questions survey.
Exploration and production (E&P) firms
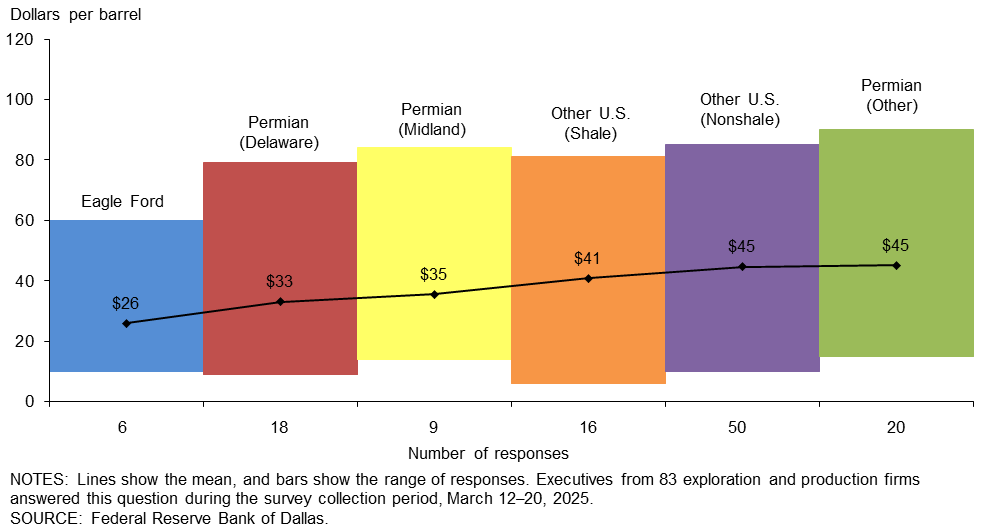
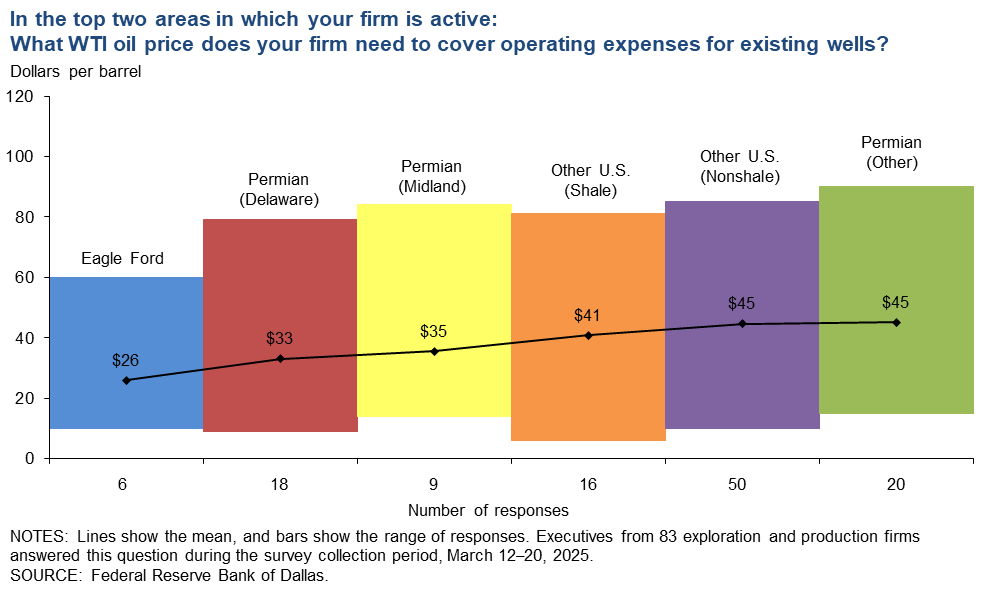
In the top two areas in which your firm is active: What West Texas Intermediate (WTI) oil price does your firm need to cover operating expenses for existing wells?
The average price across the entire sample is approximately $41 per barrel, up from $39 last year. Across regions, the average price necessary to cover operating expenses ranges from $26 to $45 per barrel. Almost all respondents can cover operating expenses for existing wells at current prices.
Large firms (with crude oil production of 10,000 barrels per day or more as of fourth quarter 2024) require prices of $31 per barrel to cover operating expenses for existing wells, based on the average of company responses. That compares with $44 for small firms (fewer than 10,000 barrels per day).
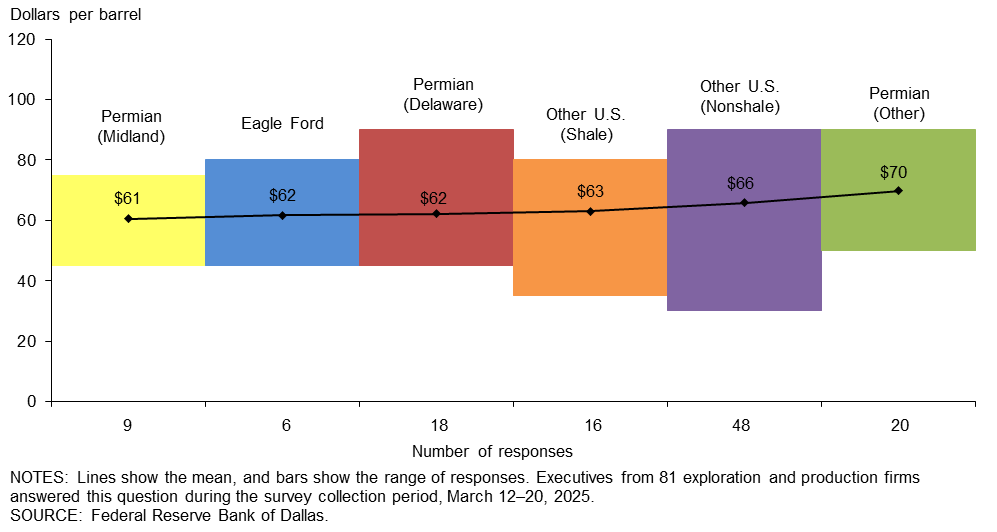
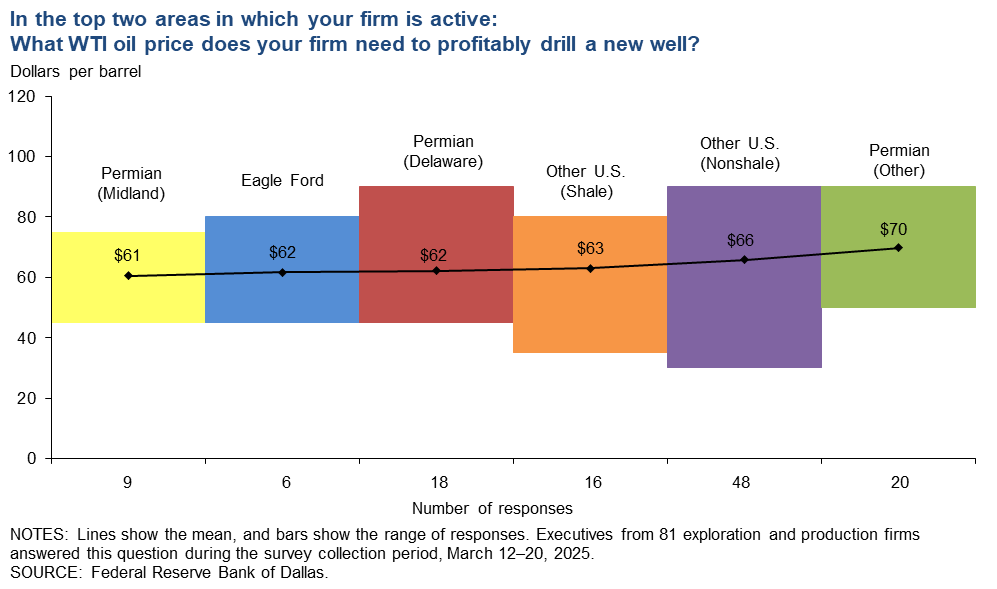
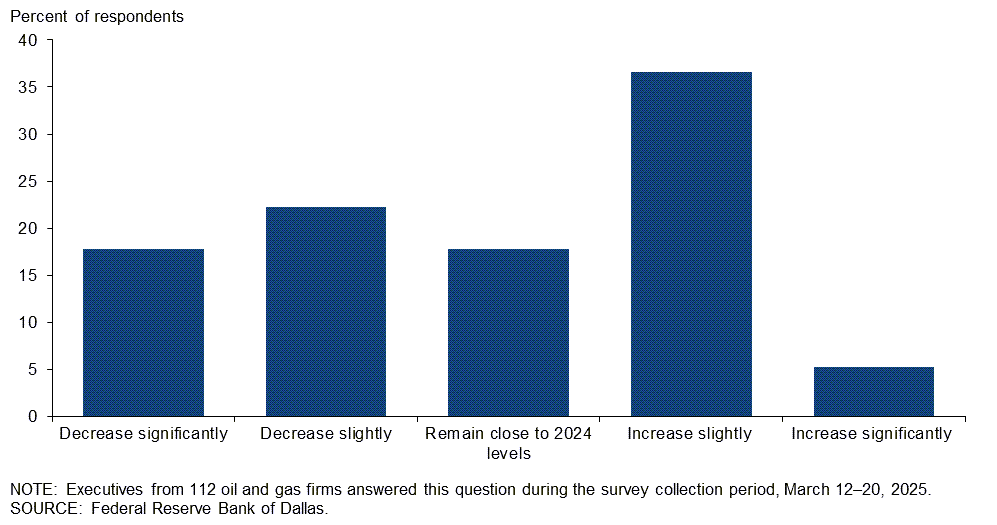
In the top two areas in which your firm is active: What WTI oil price does your firm need to profitably drill a new well?
For the entire sample, firms need $65 per barrel on average to profitably drill, higher than the $64-per-barrel price when this question was asked in last year’s first-quarter survey. Across regions, average breakeven prices to profitably drill range from $61 to $70 per barrel. Breakeven prices in the Permian Basin average $65 per barrel, unchanged from last year.
Large firms (with crude oil production of 10,000 barrels per day or more as of fourth quarter 2024) require a $61-per-barrel price to profitably drill, based on the average of company responses. That compared with $66 for small firms (fewer than 10,000 barrels per day).
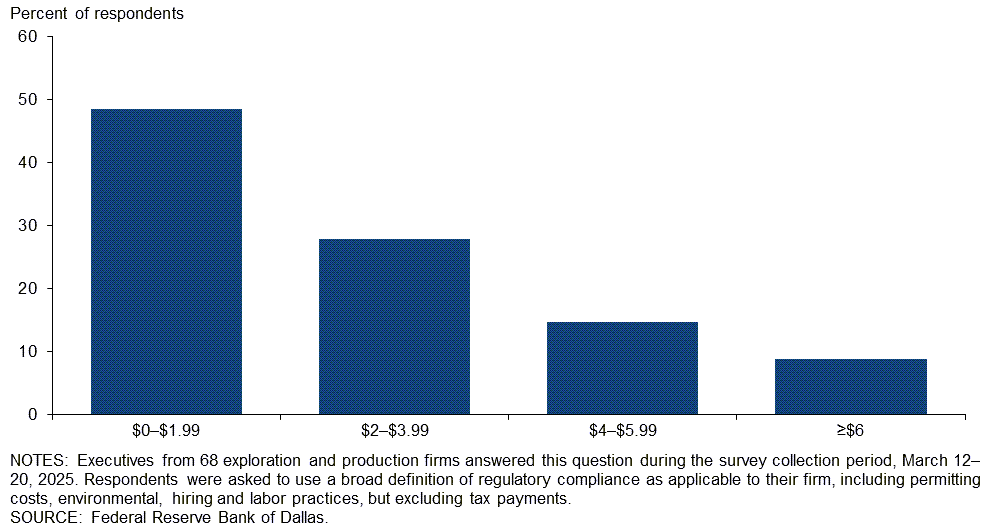
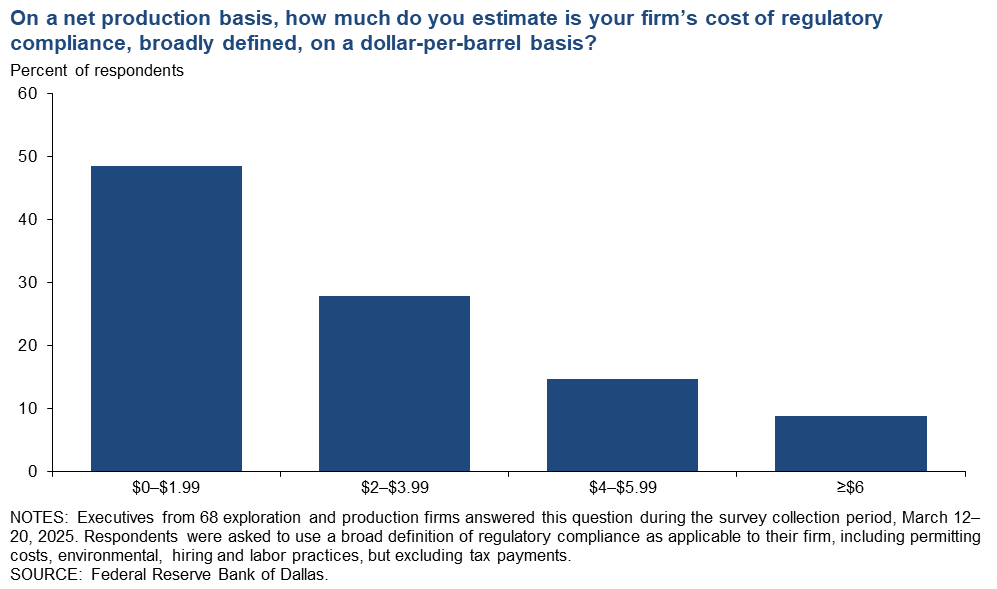
On a net production basis, how much do you estimate is your firm’s cost of regulatory compliance, broadly defined, on a dollar-per-barrel basis?
Almost half of the executives (49 percent) estimate that their firm’s cost of regulatory compliance is $0–$1.99 per barrel. Twenty-eight percent of executives estimate the cost as $2–$3.99 per barrel; an additional 15 percent said $4–$5.99 per barrel. The remaining 9 percent said greater than or equal to $6 per barrel.
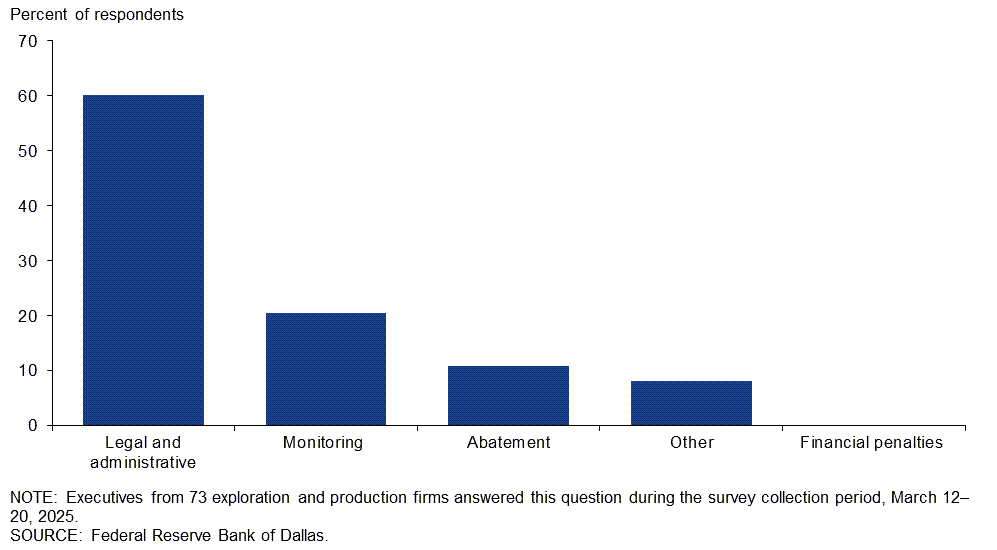
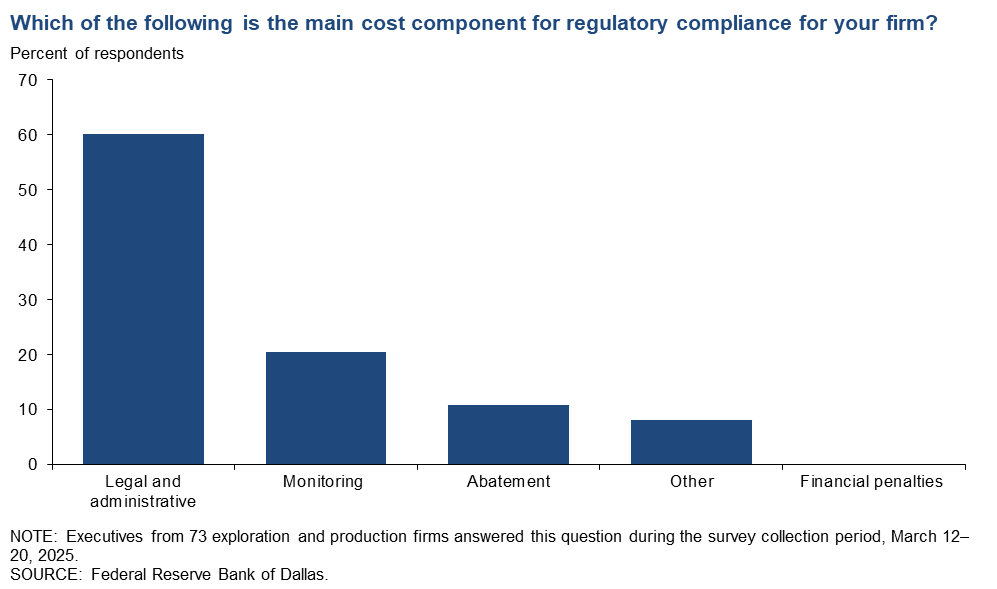
Which of the following is the main cost component for regulatory compliance for your firm?
A majority of executives—60 percent—said legal and administrative costs are their firm’s main expense item in terms of regulatory compliance. Twenty-one percent of executives selected “monitoring.” Eleven percent cited “abatement,” and 8 percent cited “other.”
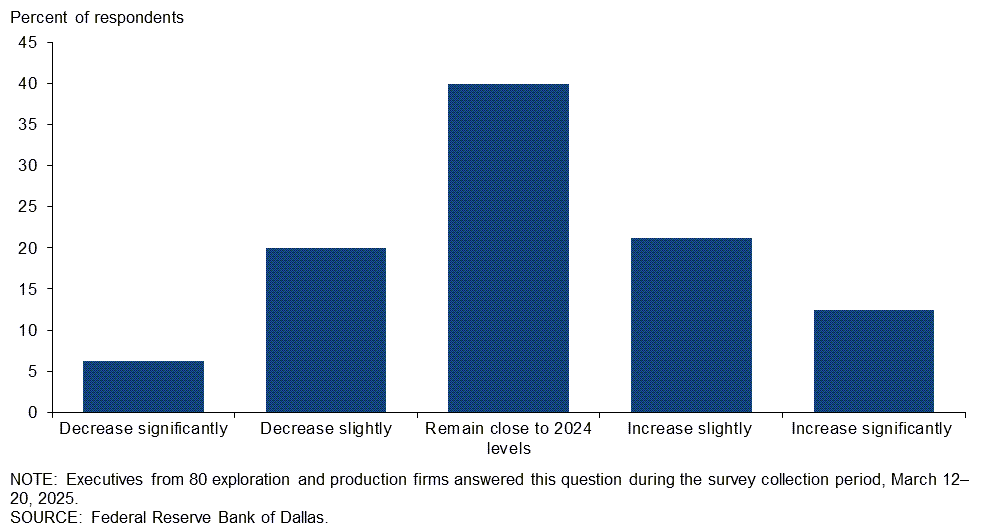
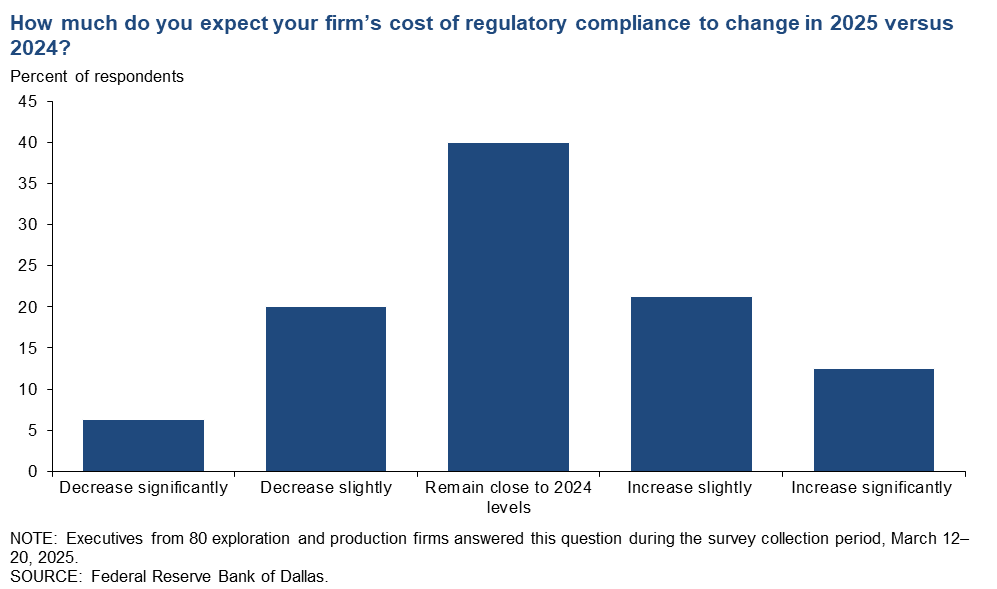
How much do you expect your firm’s cost of regulatory compliance to change in 2025 versus 2024?
Forty percent of executives expect their firm’s cost of regulatory compliance to remain close to 2024 levels in 2025. More respondents expect the cost of regulatory compliance to increase this year rather than decrease. Twenty-one percent of executives said they expect regulatory compliance cost to slightly increase, while 13 percent anticipate a significant increase. On the other hand, 20 percent of executives expect regulatory compliance cost to decrease slightly, and 6 percent anticipate it will decrease significantly.
All firms
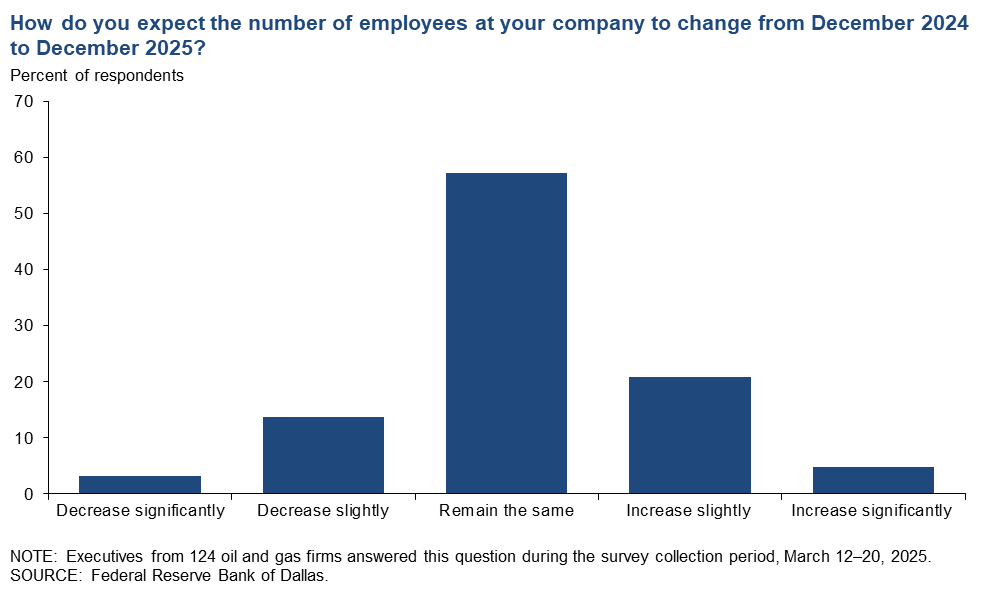
How do you expect the number of employees at your company to change from December 2024 to December 2025?
The largest group, 57 percent of executives, expect employment at their firm to remain the same from December 2024 to December 2025. 21 percent of executives chose “increase slightly” while 14 percent chose “decrease slightly.” (See table for more detail.)
| Response | Percent of respondents (among each group) | ||
| All firms | E&P | Services | |
| Increase significantly | 5 | 4 | 7 |
| Increase slightly | 21 | 16 | 31 |
| Remain close to 2025 levels | 57 | 67 | 38 |
| Decrease slightly | 14 | 12 | 17 |
| Decrease significantly | 3 | 1 | 7 |
| NOTES: Executives from 82 exploration and production firms and 42 oil and gas support services firms answered this question during the survey collection period, March 12–20, 2025. The “All” column reports the percentage of the total 124 responses. Percentages may not sum to 100 due to rounding. | |||
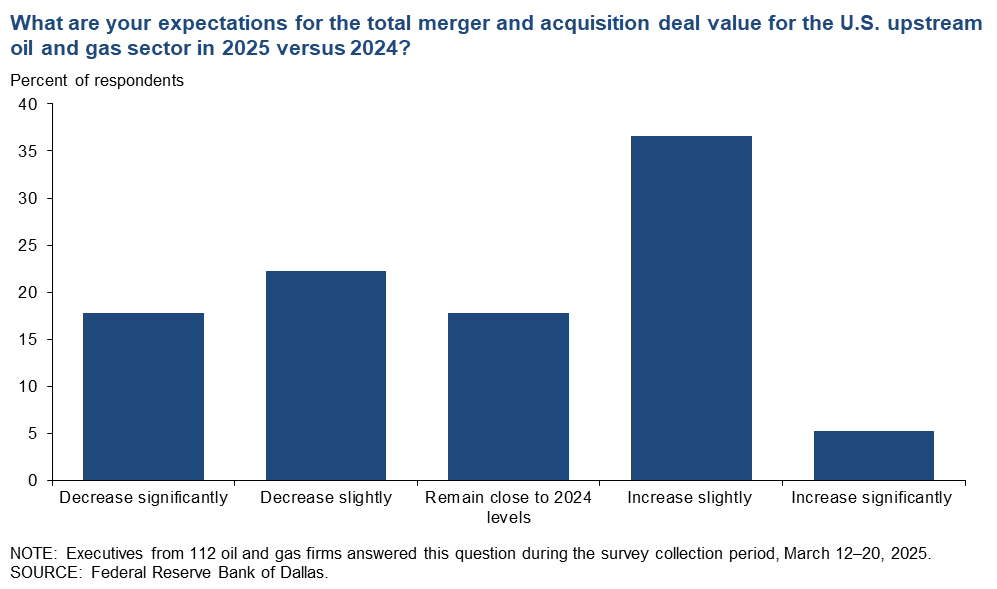
What are your expectations for the total merger and acquisition deal value for the U.S. upstream oil and gas sector in 2025 versus 2024?
The biggest group, 37 percent of executives, expect the total merger and acquisition deal value for the U.S. upstream oil and gas sector to increase slightly this year. Twenty-two percent of executives expect the deal value to decrease slightly in 2025, and 18 percent each selected “remain close to 2024 levels” and “decrease significantly.”
Oil and gas support services firms
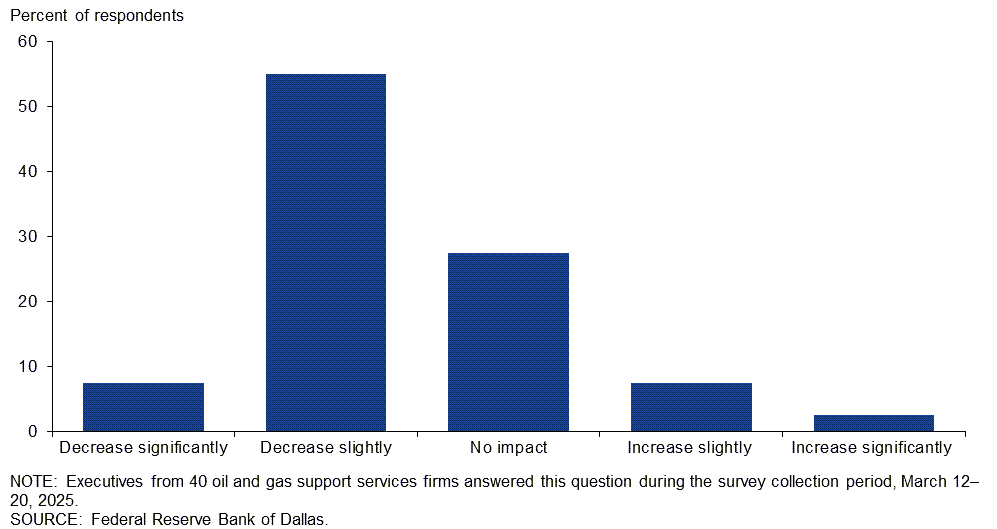
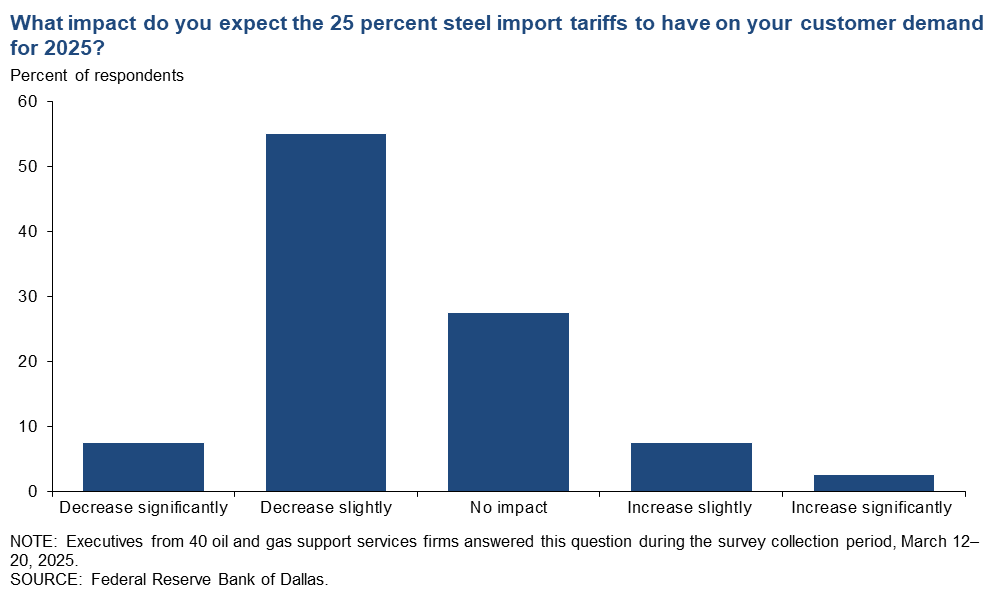
What impact do you expect the 25 percent steel import tariffs to have on your customer demand for 2025?
This question was posed only to oil and gas support services firms, which have E&P firms as their primary customer. A majority of executives—55 percent—expect the impact of the steel import tariffs to slightly decrease customer demand for 2025. Twenty-eight percent expect no impact. Few respondents selected “decrease significantly,” “increase slightly” or “increase significantly.”
Special Questions Comments
Exploration and Production (E&P) Firms
- For the average onshore upstream operator, the current administration versus the previous administration regulatory regime shows no real change at all. We still get our permits from the Railroad Commission in Texas, for example, not the Environmental Protection Agency. The federal regulatory regime matters if you are operating in the Gulf of Mexico or Alaska but not for the Permian, Eagle Ford, Bakken, Utica, etc. Also, asking OPEC+ to produce more hurts domestic operators.
- Oilfield services suppliers are willing to balance profitability with contract duration, especially for customers with strong credit ratings.
- It will be hard for 2025 to compete with 2024 when it comes to upstream merger and acquisition (M&A) volumes because the major corporate mergers that have already taken place throw off the true metrics about how healthy the upstream M&A market is in the United States. Major corporate mergers and asset level M&A are two very different things. At the asset level, I think upstream M&A will improve in 2025. I think there will be less activity in major corporate mergers, which are the true needle-mover when measuring total volume of upstream M&A.
- The new administration brings positivity to the energy industry.
- When the little guy, the independent, reaches critical mass in size, he can be purchased by a larger company.
Oil and Gas Support Services Firms
- In a strange twist to the administration's hope for more domestic oil and gas production, higher steel tariffs may result in fewer wells completed due to higher completion costs, and, in particular, the cost of oil country tubular goods. The margins are thin enough for many wells, and this will likely result in downward pressure on total wells brought online.
- The rig count is flat and scrap prices are up. Time to scrap more rigs; there are lots of rigs that will never go back to work.
Additional Comments »
Historical data are available from first quarter 2016 to the most current release quarter.
Business Indicators: Quarter/Quarter
| Business Indicators: All Firms Current Quarter (versus previous quarter) | |||||
| Indicator | Current Index | Previous Index | % Reporting Increase | % Reporting No Change | % Reporting Decrease |
Level of Business Activity |
3.8 | 6.0 | 27.1 | 49.6 | 23.3 |
Capital Expenditures |
9.4 | 1.5 | 32.8 | 43.8 | 23.4 |
Supplier Delivery Time |
3.2 | -4.6 | 7.9 | 87.4 | 4.7 |
Employment |
0.0 | 2.2 | 11.6 | 76.7 | 11.6 |
Employee Hours |
0.7 | 0.0 | 13.8 | 73.1 | 13.1 |
Wages and Benefits |
21.6 | 21.7 | 25.4 | 70.8 | 3.8 |
| Indicator | Current Index | Previous Index | % Reporting Improved | % Reporting No Change | % Reporting Worsened |
Company Outlook |
-4.9 | 7.1 | 26.2 | 42.6 | 31.1 |
| Indicator | Current Index | Previous Index | % Reporting Increase | % Reporting No Change | % Reporting Decrease |
Uncertainty |
43.1 | 22.4 | 60.8 | 21.5 | 17.7 |
| Business Indicators: E&P Firms Current Quarter (versus previous quarter) | |||||
| Indicator | Current Index | Previous Index | % Reporting Increase | % Reporting No Change | % Reporting Decrease |
Level of Business Activity |
6.9 | 8.0 | 25.3 | 56.3 | 18.4 |
Oil Production |
5.6 | 1.1 | 26.1 | 53.4 | 20.5 |
Natural Gas Wellhead Production |
4.8 | -3.5 | 27.7 | 49.4 | 22.9 |
Capital Expenditures |
8.2 | 3.6 | 32.6 | 43.0 | 24.4 |
Expected Level of Capital Expenditures Next Year |
18.2 | 24.1 | 37.5 | 43.2 | 19.3 |
Supplier Delivery Time |
3.6 | -5.9 | 7.1 | 89.4 | 3.5 |
Employment |
-2.3 | 4.6 | 6.9 | 83.9 | 9.2 |
Employee Hours |
1.1 | -2.3 | 9.1 | 83.0 | 8.0 |
Wages and Benefits |
21.6 | 24.1 | 26.1 | 69.3 | 4.5 |
Finding and Development Costs |
17.1 | 11.5 | 21.6 | 73.9 | 4.5 |
Lease Operating Expenses |
38.7 | 25.6 | 39.8 | 59.1 | 1.1 |
| Indicator | Current Index | Previous Index | % Reporting Improved | % Reporting No Change | % Reporting Worsened |
Company Outlook |
-3.7 | 13.8 | 26.3 | 43.8 | 30.0 |
| Indicator | Current Index | Previous Index | % Reporting Increase | % Reporting No Change | % Reporting Decrease |
Uncertainty |
40.9 | 24.1 | 61.4 | 18.2 | 20.5 |
| Business Indicators: O&G Support Services Firms Current Quarter (versus previous quarter) | |||||
| Indicator | Current Index | Previous Index | % Reporting Increase | % Reporting No Change | % Reporting Decrease |
Level of Business Activity |
-2.3 | 2.2 | 31.0 | 35.7 | 33.3 |
Utilization of Equipment |
-4.8 | -4.4 | 26.2 | 42.9 | 31.0 |
Capital Expenditures |
11.9 | -2.1 | 33.3 | 45.2 | 21.4 |
Supplier Delivery Time |
2.4 | -2.2 | 9.5 | 83.3 | 7.1 |
Lag Time in Delivery of Firm's Services |
0.0 | 0.0 | 7.1 | 85.7 | 7.1 |
Employment |
4.7 | -2.1 | 21.4 | 61.9 | 16.7 |
Employment Hours |
0.0 | 4.3 | 23.8 | 52.4 | 23.8 |
Wages and Benefits |
21.4 | 17.0 | 23.8 | 73.8 | 2.4 |
Input Costs |
30.9 | 23.9 | 33.3 | 64.3 | 2.4 |
Prices Received for Services |
7.1 | -13.0 | 21.4 | 64.3 | 14.3 |
Operating Margin |
-21.5 | -17.8 | 19.0 | 40.5 | 40.5 |
| Indicator | Current Index | Previous Index | % Reporting Improved | % Reporting No Change | % Reporting Worsened |
Company Outlook |
-7.1 | -4.3 | 26.2 | 40.5 | 33.3 |
| Indicator | Current Index | Previous Index | % Reporting Increase | % Reporting No Change | % Reporting Decrease |
Uncertainty |
47.6 | 19.2 | 59.5 | 28.6 | 11.9 |
Business Indicators: Year/Year
| Business Indicators: All Firms Current Quarter (versus same quarter a year ago) | |||||
| Indicator | Current Index | Previous Index | % Reporting Increase | % Reporting No Change | % Reporting Decrease |
Level of Business Activity |
4.9 | -3.2 | 32.8 | 39.3 | 27.9 |
Capital Expenditures |
15.0 | 4.8 | 40.0 | 35.0 | 25.0 |
Supplier Delivery Time |
3.4 | -8.1 | 10.2 | 83.1 | 6.8 |
Employment |
7.4 | 4.0 | 20.5 | 66.4 | 13.1 |
Employee Hours |
5.6 | 5.5 | 18.5 | 68.5 | 12.9 |
Wages and Benefits |
41.4 | 45.3 | 44.7 | 52.0 | 3.3 |
| Indicator | Current Index | Previous Index | % Reporting Improved | % Reporting No Change | % Reporting Worsened |
Company Outlook |
0.0 | 5.2 | 34.5 | 31.0 | 34.5 |
| Business Indicators: E&P Firms Current Quarter (versus same quarter a year ago) | |||||
| Indicator | Current Index | Previous Index | % Reporting Increase | % Reporting No Change | % Reporting Decrease |
Level of Business Activity |
9.9 | 6.2 | 34.6 | 40.7 | 24.7 |
Oil Production |
13.3 | -5.1 | 38.6 | 36.1 | 25.3 |
Natural Gas Wellhead Production |
1.2 | -12.5 | 31.6 | 38.0 | 30.4 |
Capital Expenditures |
16.2 | 7.6 | 42.5 | 31.3 | 26.3 |
Expected Level of Capital Expenditures Next Year |
16.1 | 19.0 | 38.3 | 39.5 | 22.2 |
Supplier Delivery Time |
1.3 | -3.9 | 7.8 | 85.7 | 6.5 |
Employment |
6.1 | 5.0 | 15.9 | 74.4 | 9.8 |
Employee Hours |
9.7 | 6.2 | 16.9 | 75.9 | 7.2 |
Wages and Benefits |
40.2 | 43.7 | 43.9 | 52.4 | 3.7 |
Finding and Development Costs |
21.7 | 16.1 | 32.5 | 56.6 | 10.8 |
Lease Operating Expenses |
51.8 | 38.5 | 54.2 | 43.4 | 2.4 |
| Indicator | Current Index | Previous Index | % Reporting Improved | % Reporting No Change | % Reporting Worsened |
Company Outlook |
1.4 | 8.3 | 34.7 | 31.9 | 33.3 |
| Business Indicators: O&G Support Services Firms Current Quarter (versus same quarter a year ago) | |||||
| Indicator | Current Index | Previous Index | % Reporting Increase | % Reporting No Change | % Reporting Decrease |
Level of Business Activity |
-4.8 | -19.5 | 29.3 | 36.6 | 34.1 |
Utilization of Equipment |
-4.8 | -24.4 | 29.3 | 36.6 | 34.1 |
Capital Expenditures |
12.5 | 0.0 | 35.0 | 42.5 | 22.5 |
Supplier Delivery Time |
7.3 | -15.5 | 14.6 | 78.0 | 7.3 |
Lag Time in Delivery of Firm's Services |
-2.5 | -11.4 | 7.3 | 82.9 | 9.8 |
Employment |
10.0 | 2.2 | 30.0 | 50.0 | 20.0 |
Employment Hours |
-2.4 | 4.4 | 22.0 | 53.7 | 24.4 |
Wages and Benefits |
43.9 | 47.8 | 46.3 | 51.2 | 2.4 |
Input Costs |
55.0 | 51.1 | 57.5 | 40.0 | 2.5 |
Prices Received for Services |
7.3 | -11.6 | 29.3 | 48.8 | 22.0 |
Operating Margin |
-20.5 | -22.7 | 23.1 | 33.3 | 43.6 |
| Indicator | Current Index | Previous Index | % Reporting Improved | % Reporting No Change | % Reporting Worsened |
Company Outlook |
-2.5 | 0.0 | 34.1 | 29.3 | 36.6 |
Activity Chart
Comments from Survey Respondents
Survey participants are given the opportunity to submit comments on current issues that may be affecting their businesses. Some comments have been edited for grammar and clarity. Comments from the Special Questions survey can be found below the special questions.
Exploration and Production (E&P) Firms
- The key word to describe 2025 so far is “uncertainty” and as a public company, our investors hate uncertainty. This has led to a marked increase in the implied cost of capital of our business, with public energy stocks down significantly more than oil prices over the last two months. This uncertainty is being caused by the conflicting messages coming from the new administration. There cannot be "U.S. energy dominance" and $50 per barrel oil; those two statements are contradictory. At $50-per-barrel oil, we will see U.S. oil production start to decline immediately and likely significantly (1 million barrels per day plus within a couple quarters). This is not “energy dominance.” The U.S. oil cost curve is in a different place than it was five years ago; $70 per barrel is the new $50 per barrel.
- First, trade and tariff uncertainty are making planning difficult. Second, I urge the administration to engage with U.S. steel executives to boost domestic production and introduce new steel specs. This will help lower domestic steel prices, which have risen over 30 percent in one month in anticipation of tariffs.
- The administration's chaos is a disaster for the commodity markets. "Drill, baby, drill" is nothing short of a myth and populist rallying cry. Tariff policy is impossible for us to predict and doesn't have a clear goal. We want more stability.
- The disconnection of oil and natural gas markets, specifically commodity pricing, seems to be causing a feast-or-famine effect on the industry. Companies with natural-gas-weighted assets will spend more money in 2025 developing their assets, but oil-weighted companies will decrease capital spending with the current pressure on oil pricing for 2025.
- The administration’s tariffs immediately increased the cost of our casing and tubing by 25 percent even though inventory costs our pipe brokers less. U.S. tubular manufacturers immediately raised their prices to reflect the anticipated tariffs on steel. The threat of $50 oil prices by the administration has caused our firm to reduce its 2025 and 2026 capital expenditures. "Drill, baby, drill" does not work with $50 per barrel oil. Rigs will get dropped, employment in the oil industry will decrease, and U.S. oil production will decline as it did during COVID-19.
- I have never felt more uncertainty about our business in my entire 40-plus-year career.
- Uncertainty around everything has sharply risen during the past quarter. Planning for new development is extremely difficult right now due to the uncertainty around steel-based products. Oil prices feel incredibly unstable, and it's hard to gauge whether prices will be in the $50s per barrel or $70s per barrel. Combined, our ability to plan operations for any meaningful amount of time in the future has been severely diminished.
- The only certainty right now is uncertainty. With that in mind, we are approaching this economic cycle with heightened capital discipline and a focus on long-term resilience. I don't believe the tariffs will have a significant effect on drilling and completion plans for 2025, although I would imagine most managers are developing contingency plans for the potential effects of deals (Russia-Ukraine deal, Gaza-Israel-Iran deal) on global crude or natural gas flows. Now these contingency plans probably have more downside price risk baked in than initial drilling plans did for 2025.
- Steel prices and overall labor and drilling costs are up relative to the price of oil in 2021 (the same pricing regime but costs are up).
- Oil prices have decreased while operating costs have continued to increase. To stimulate new activity, oil prices need to be in the $75-$80 per barrel range. Natural gas takeaway in the Permian Basin has not improved for any of my properties, and I am still getting paid slightly negative to barely positive prices for natural gas. Last month I was paid 29 cents per million cubic feet. I feel very negative about the short-term outlook for the oil and gas business.
- Geopolitical risk and economic uncertainty continue to cloud our picture looking forward.
- The rhetoric from the current administration is not helpful. If the oil price continues to drop, we will shut in production and do quick drilling.
- Our program is located in central California. California's government continues to undermine permitting by their staff's inactivity and delays. Ongoing actions in that bureaucracy are increasing costs and regulatory hurdles, hampering investment in the state. Often it appears the state is overstepping authority and working to restrict access to private and federal minerals by creating added levels of regulations bureaucracy and reporting requirements, with the cumulative effect being to hamper the industry overall and prevent specific project plans. This is a very serious impediment to developing strategically located oil and gas assets. Additionally, California imports its energy, with much of its natural gas coming from western Canada. Oil is also imported via tanker from foreign countries rather than being responsibly produced by companies paying taxes in state. California is vulnerable. Tariffs will exacerbate all aspects of business and simply put, any tariffs restricting energy (oil, gas or other) could be a large issue for the state. Effectively, the state needs local investment, oil and gas development, and increased state production, but the political management is working to curtail that.
- Drilling projects are increasing from outside sources. Natural gas is very positive.
- The rate of accomplishment of the administration’s policy agenda will impact prices for natural gas in a favorable way. Killing the climate change policies and instigating LNG exports, along with the increase in manufacturing and artificial intelligence demands, will increase natural gas consumption. Weather-related demand was higher this year, and that increased the drawdown in natural gas storage.
- Demand has lessened resulting in a lower oil price. The same applies to gas. Unstable capital markets are affecting oil prices. The political climate caused by the new presidential administration appears to be creating instability. Energy markets are not exempt from the loss of public faith in all markets.
- Global geopolitical unrest and the uncertain economic outcomes of the administration’s tariff policies suggest the need to hit the pause button on spending.
- The 2025 steel is already purchased; tariffs are most likely to impact 2026 investment decisions.
Oil and Gas Support Services Firms
- Uncertainty around tariffs and trade policy continues to negatively impact our business, both for mid- to long-term planning and near-term costs. Because of trade tension, especially with Canada, a large operator requested we look to potentially move manufacturing out of the U.S. to support their work in Canada and other international markets.
- Washington’s tariff policy is injecting uncertainty into the supply chain.
- Bias is to lower oil prices due to geopolitical factors and the current administration. The potential tariff impact is creating uncertainty around costs for capital items. We have seen price increases already. Also, we have supply chain problems with a handful of specialty items out of the EU, particularly lower explosive limit sensors for monitors needed by employees.
- The increased drilling efficiency and capital discipline by the operator community is undermining the "drill, baby, drill."
- The consolidation of E&P customers is hurting our business.
- We are seeing larger operators reduce rig count as consolidations settle out and the smaller operators pick up those rigs. The rig market has mostly softened to levels conducive to drilling. Casing looks like it will be a bottleneck but not a showstopper. Our outlook is positive as we enter the second quarter of 2025.
- We are all busy here.
Questions regarding the Dallas Fed Energy Survey can be addressed to Michael Plante at Michael.Plante@dal.frb.org or Kunal Patel at Kunal.Patel@dal.frb.org.
Sign up for our email alert to be automatically notified as soon as the latest Dallas Fed Energy Survey is released on the web.