Banking Conditions Survey

For this survey, Eleventh District banking executives were asked supplemental questions on deposits, credit standards and loan demand. Read the special questions results.
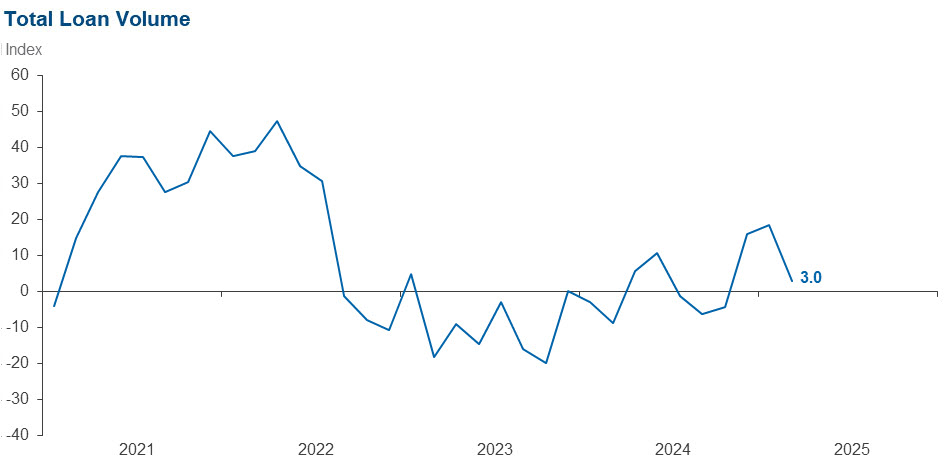
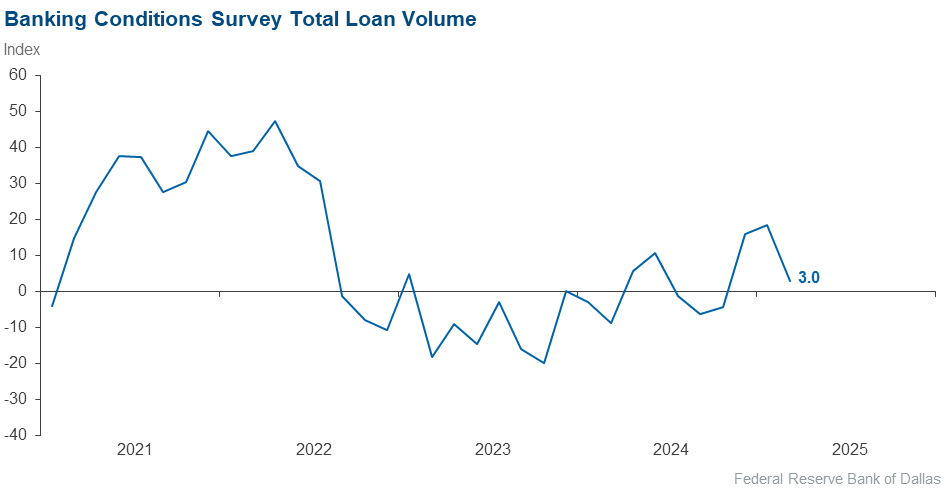
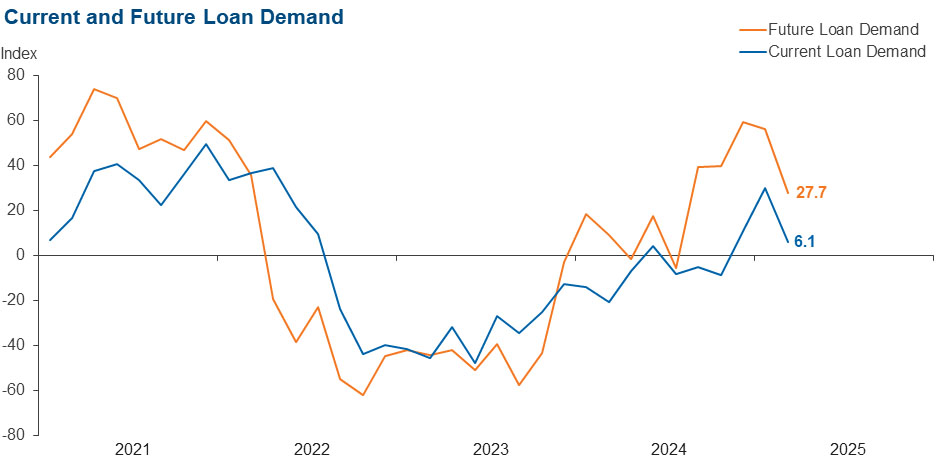
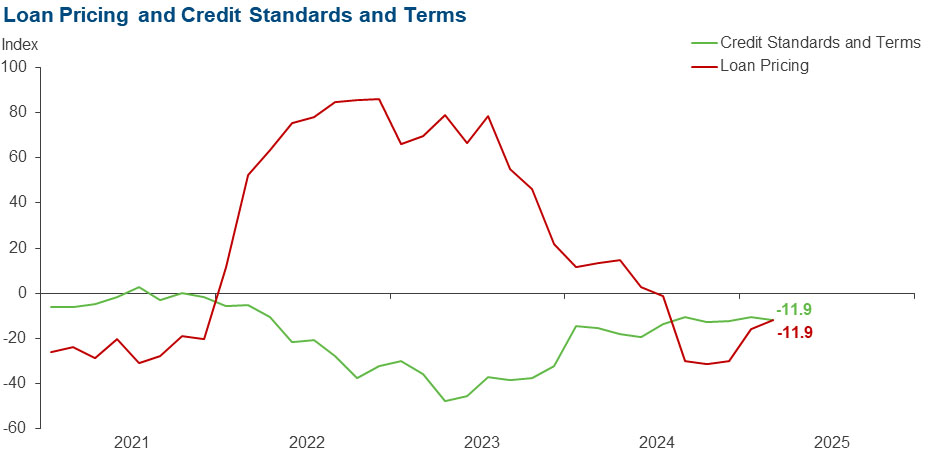
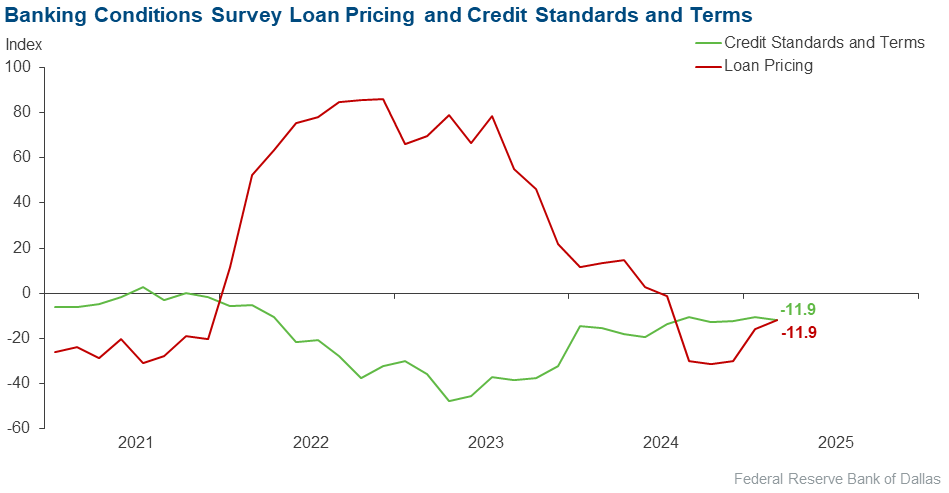
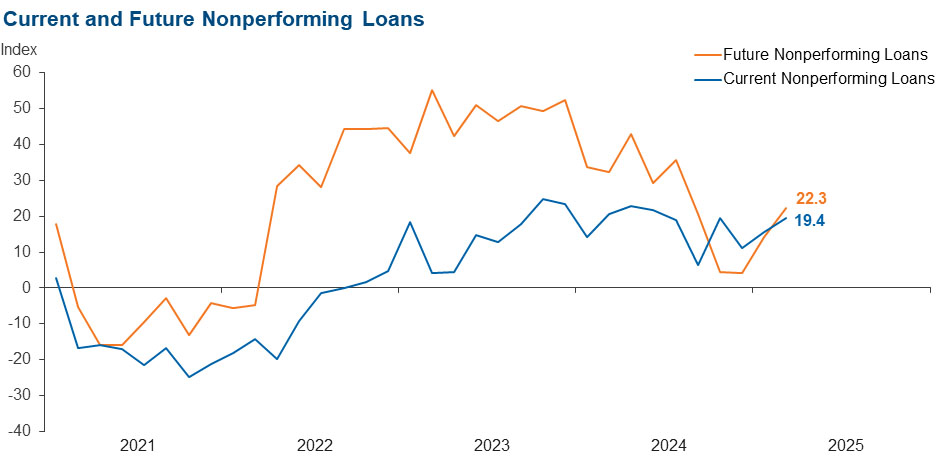
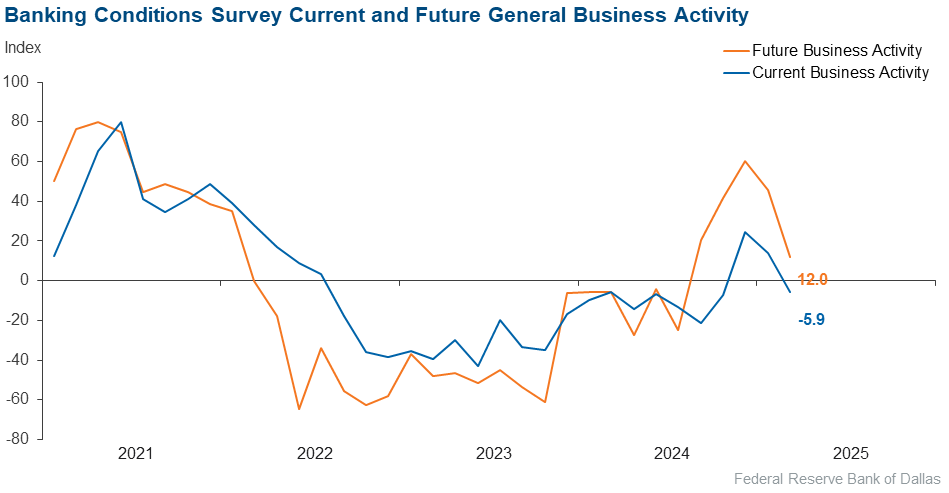
Loan volume and demand growth decelerated sharply in March. Credit tightening continued, but loan pricing declined. Loan nonperformance increased. In addition, bankers reported business activity contracted after expanding over the last three months, and their outlooks retreated to cautiously optimistic. While the survey respondents expect an improvement in loan demand and business activity six months from now, the sentiment is less broad-based, and it is tempered by expectations of a continued increase in loan nonperformance.
Next release: May 19, 2025
Data were collected March 24–April 2, and 67 financial institutions responded to the survey. The Federal Reserve Bank of Dallas conducts the Banking Conditions Survey twice each quarter to obtain a timely assessment of activity at banks and credit unions headquartered in the Eleventh Federal Reserve District. CEOs or senior loan officers of financial institutions report on how conditions have changed for indicators such as loan volume, nonperforming loans and loan pricing. Respondents are also asked to report on their banking outlook and their evaluation of general business activity.
Survey responses are used to calculate an index for each indicator. Each index is calculated by subtracting the percentage of respondents reporting a decrease (or tightening) from the percentage reporting an increase (or easing). When the share of respondents reporting an increase exceeds the share reporting a decrease, the index will be greater than zero, suggesting the indicator has increased over the prior reporting period. If the share of respondents reporting a decrease exceeds the share reporting an increase, the index will be below zero, suggesting the indicator has decreased over the prior reporting period. An index will be zero when the number of respondents reporting an increase is equal to the number reporting a decrease.
Results Summary
Historical data are available from March 2017.
| Total Loans: Over the past six weeks, how have the following changed? | |||||
| Indicator | Current Index | Previous Index | % Reporting Increase | % Reporting No Change | % Reporting Decrease |
Loan volume | 3.0 | 18.3 | 35.8 | 31.3 | 32.8 |
Loan demand | 6.1 | 30.0 | 33.8 | 38.5 | 27.7 |
Nonperforming loans | 19.4 | 15.7 | 26.9 | 65.7 | 7.5 |
Loan pricing | –11.9 | –15.7 | 7.5 | 73.1 | 19.4 |
| Indicator | Current Index | Previous Index | % Reporting Eased | % Reporting No Change | % Reporting Tightened |
Credit standards and terms | –11.9 | –10.4 | 1.7 | 84.7 | 13.6 |
| Commercial and Industrial Loans: Over the past six weeks, how have the following changed? | |||||
| Indicator | Current Index | Previous Index | % Reporting Increase | % Reporting No Change | % Reporting Decrease |
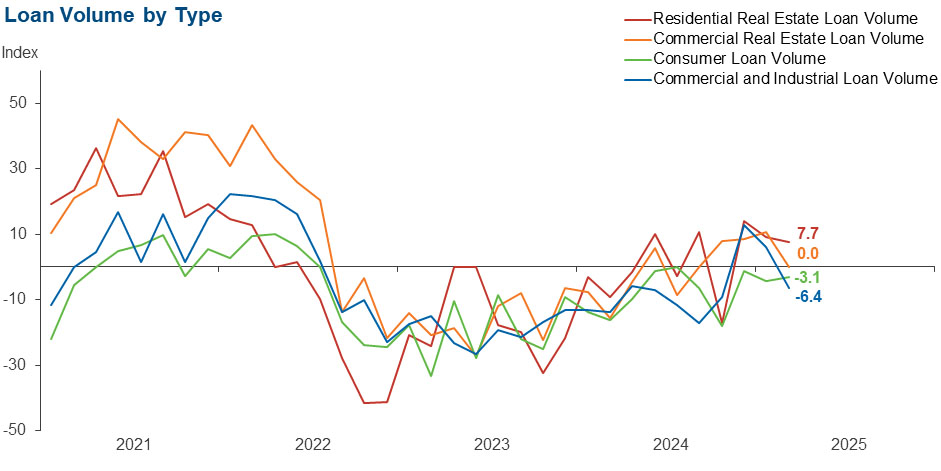
Loan volume | –6.4 | 6.0 | 19.0 | 55.6 | 25.4 |
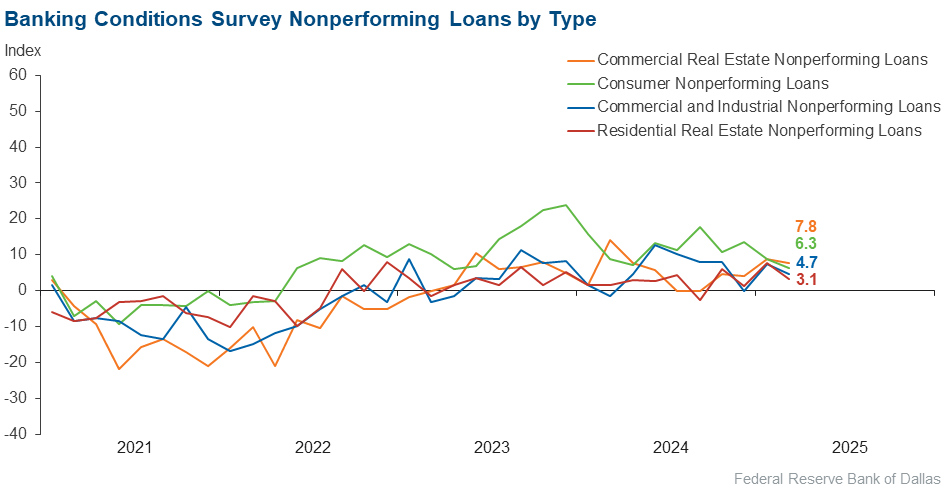
Nonperforming loans | 4.7 | 7.5 | 7.9 | 88.9 | 3.2 |
| Indicator | Current Index | Previous Index | % Reporting Eased | % Reporting No Change | % Reporting Tightened |
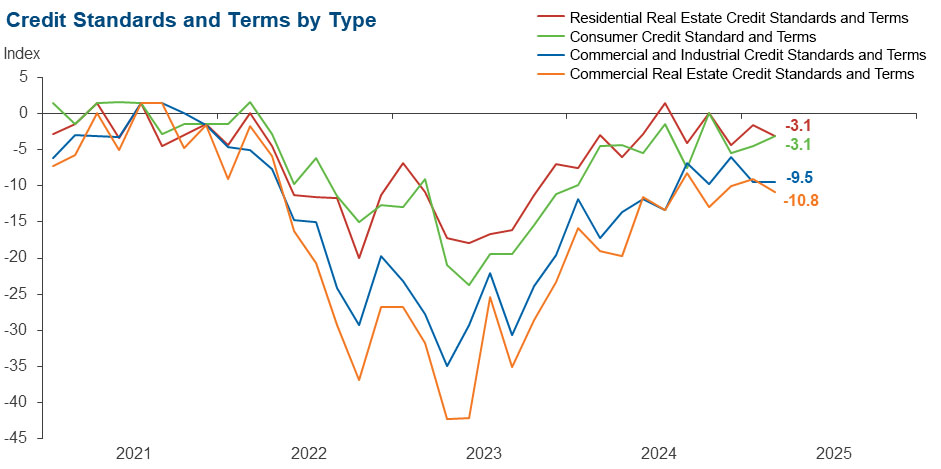
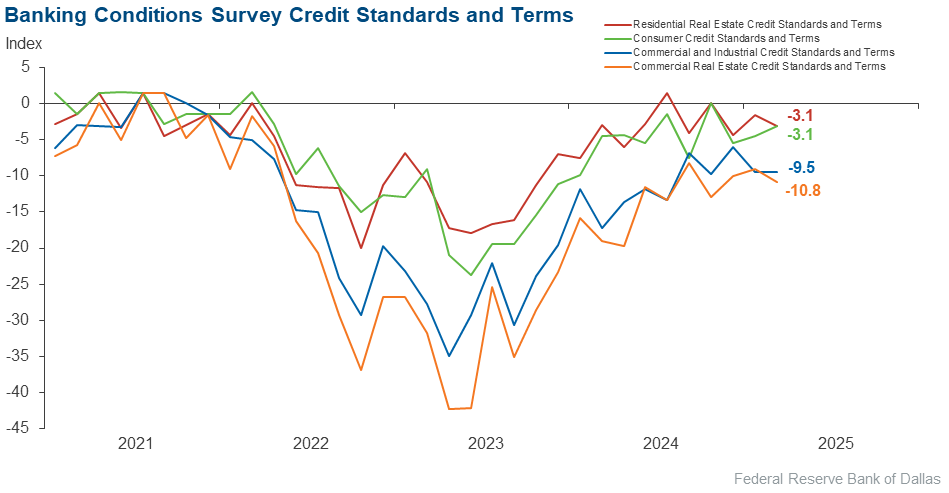
Credit standards and terms | –9.5 | –9.5 | 0.0 | 90.5 | 9.5 |
| Commercial Real Estate Loans: Over the past six weeks, how have the following changed? | |||||
| Indicator | Current Index | Previous Index | % Reporting Increase | % Reporting No Change | % Reporting Decrease |
Loan volume | 0.0 | 10.5 | 29.2 | 41.5 | 29.2 |
Nonperforming loans | 7.8 | 8.9 | 14.1 | 79.7 | 6.3 |
| Indicator | Current Index | Previous Index | % Reporting Eased | % Reporting No Change | % Reporting Tightened |
Credit standards and terms | –10.8 | –9.1 | 0.0 | 89.2 | 10.8 |
| Residential Real Estate Loans: Over the past six weeks, how have the following changed? | |||||
| Indicator | Current Index | Previous Index | % Reporting Increase | % Reporting No Change | % Reporting Decrease |
Loan volume | 7.7 | 9.0 | 27.7 | 52.3 | 20.0 |
Nonperforming loans | 3.1 | 7.6 | 10.8 | 81.5 | 7.7 |
| Indicator | Current Index | Previous Index | % Reporting Eased | % Reporting No Change | % Reporting Tightened |
Credit standards and terms | –3.1 | –1.6 | 1.5 | 93.8 | 4.6 |
| Consumer Loans: Over the past six weeks, how have the following changed? | |||||
| Indicator | Current Index | Previous Index | % Reporting Increase | % Reporting No Change | % Reporting Decrease |
Loan volume | –3.1 | –4.3 | 15.4 | 66.2 | 18.5 |
Nonperforming loans | 6.3 | 8.7 | 11.1 | 84.1 | 4.8 |
| Indicator | Current Index | Previous Index | % Reporting Eased | % Reporting No Change | % Reporting Tightened |
Credit standards and terms | –3.1 | –4.5 | 3.1 | 90.8 | 6.2 |
| Banking Outlook: What is your expectation for the following items six months from now? | |||||
| Indicator | Current Index | Previous Index | % Reporting Increase | % Reporting No Change | % Reporting Decrease |
Total loan demand | 27.7 | 56.3 | 50.8 | 26.2 | 23.1 |
Nonperforming loans | 22.3 | 14.1 | 30.2 | 61.9 | 7.9 |
| General Business Activity: What is your evaluation of the level of activity? | |||||
| Indicator | Current Index | Previous Index | % Reporting Better | % Reporting No Change | % Reporting Worse |
Over the past six weeks | –5.9 | 14.1 | 25.4 | 43.3 | 31.3 |
Six months from now | 12.0 | 45.6 | 47.8 | 16.4 | 35.8 |


Survey participants are given the opportunity to submit comments on current issues that may be affecting their businesses. Some comments have been edited for grammar and clarity.
- Uncertainty caused by the administration about tariffs and restrictive interest rate policy [are concerns].
- Tariffs have created uncertainty in the economy, but overall activity and loan demand remain relatively solid. We expect continued volatility over the next three months but are optimistic the second half of the year will be stronger.
- The tariff discussions have put a wet blanket on business expectations and loan demand.
- Some pre-buying happening ahead of tariffs taking effect, but it is offset by companies pausing their capital spending plans as they wait for more clarity. It feels like business optimism in Texas markets is still strong.
- We are concerned about stagflation scenarios.
- The unknown component in our economy is tariffs and the impact of those on the banking industry.
- Generally, the business community seems to be more positive than 2024. Decreased regulation is being received as positive, and the direction of the country seems to be well received. The threat of tariffs is of some concern, but most businesspeople seem to think they will be temporary in nature. Overall, there is an improvement in the day-to-day business climate.
- Regulatory burden [is a concern].
- The extended period of a flat or inverted yield curve is continuing to pressure margins and overall profitability. There are some concerns related to residential lending due to consumer struggles with overall inflation, rising insurance and property tax costs.
- We are located on or near the Texas-Mexico border, and we are very concerned about the negative effects of the tariffs on Mexico imports. This could impact local warehousing, trucking and import logistic companies.
- Our volume on all commercial activity has been growing at a robust pace since the first of the year. Also, speaking with our commercial customers, they are much more optimistic about the economy than they have been the last few years.
Historical data can be downloaded dating back to March 2017. For the definitions, see data definitions.
NOTE: The following series were discontinued in May 2020: volume of core deposits, cost of funds, non-interest income and net interest margin.
Questions regarding the Banking Conditions Survey can be addressed to Mariam Yousuf at mariam.yousuf@dal.frb.org.
Sign up for our email alert to be automatically notified as soon as the latest Banking Conditions Survey is released on the web.