Agricultural Survey

Survey highlights
Bankers responding to the first-quarter survey reported sustained dry conditions across most regions of the Eleventh District. The lack of rain during the winter season will hamper wheat and corn harvests. The recent government financial assistance and disaster payments will improve farmers’ cash flow, but even with this support, many farmers will still be left in the red. Cattle prices remained high and are predicted to stay elevated.
“With no rain in 120 days, conditions are beginning to weaken. Rain is needed soon for the wheat crop,” noted one survey participant. While the cattle market is strong, dry conditions are leading to depleted food supplies for the herds and pushing up costs for farmers, as another responded noted, “While cow-calf producers are benefiting from good prices at the sale barn, grass conditions are poor, and most of the hay supply has been depleted. Producers are tightening their belts and limiting spending to essentials.” However, as one participant commented, “Cattle producers are the one segment of the agricultural sector that remains profitable.”
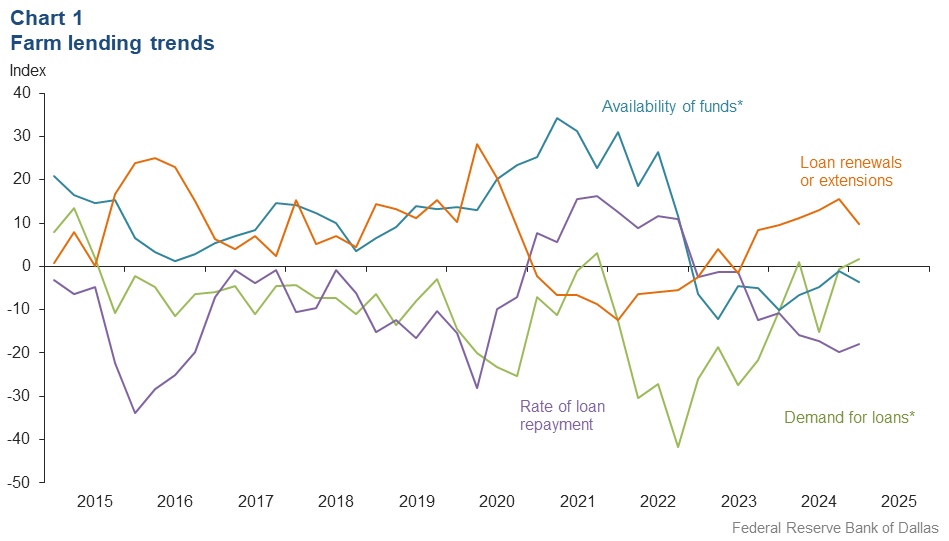
Demand for agricultural loans increased slightly in the first quarter. Availability of funds declined in the first quarter after stabilizing at the end of 2024. Loan renewal or extensions continued to increase in first quarter 2025 although at a slower pace. The rate of loan repayment continued to decline, but the pace of declines remained stable after increasing throughout 2024. Except for operating loans and feeder cattle loans, loan volume was down for all remaining categories compared with a year ago (Chart 1).
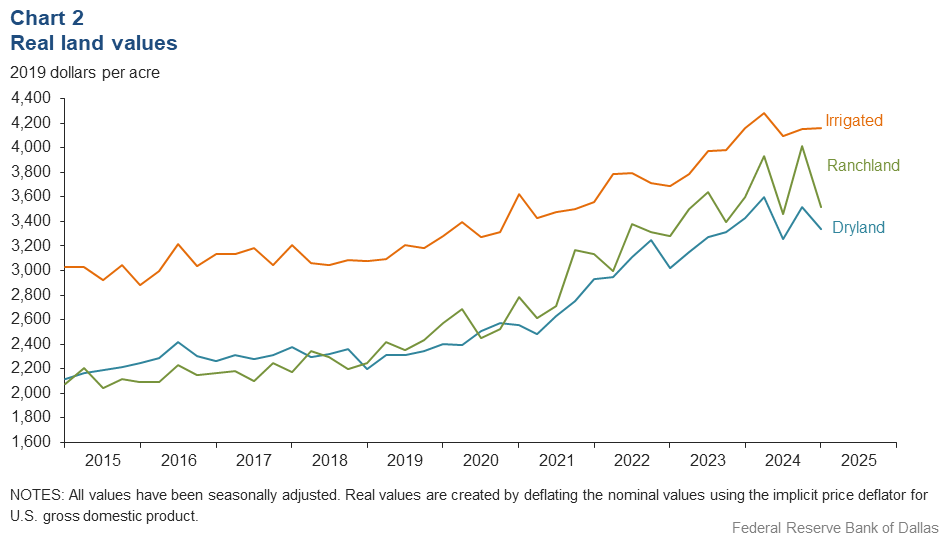
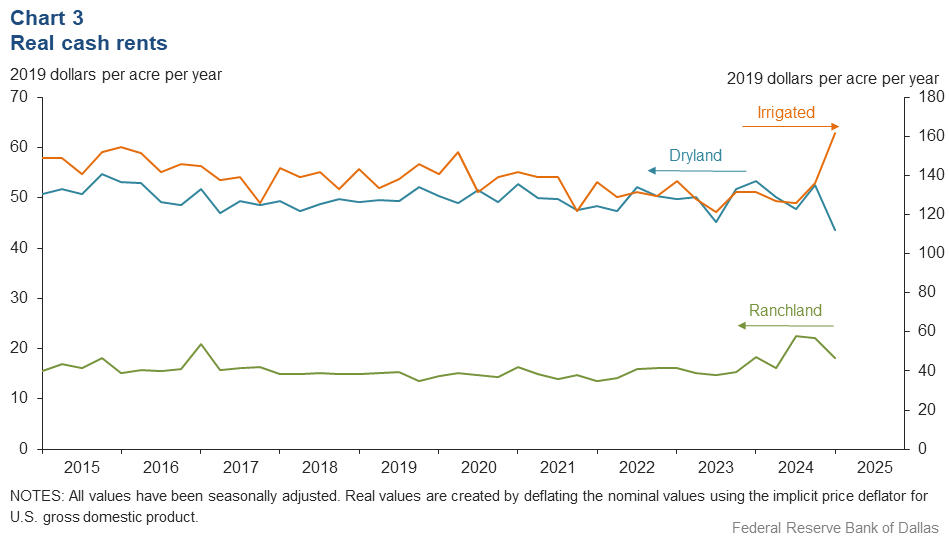
Real land values for dryland and ranchland decreased in first quarter 2025, while values for irrigated cropland remained stable (Chart 2). In the district, dryland increased by around 9 percent year over year, and ranchland and irrigated cropland rose by less than 4 percent (Table 1). Real cash rents declined for ranchland and dryland but rose for irrigated cropland (Chart 3).
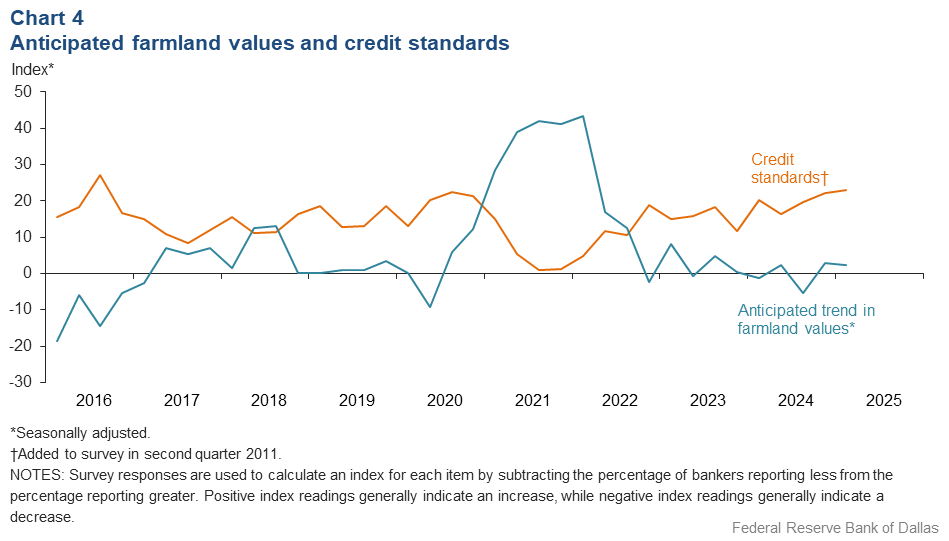
The anticipated trend in farmland values index remained barely positive in the first quarter after ticking up in the previous quarter. This implies respondents expect farmland values to continue to rise but not substantially. The credit standards index showed an increase in credit tightening at a pace similar to fourth quarter 2024 (Chart 4). Respondents reported interest rate declines across all types in the current quarter (Table 2).
Next release: June 23, 2025
Agricultural Survey is compiled from a survey of Eleventh District agricultural bankers, and data have been seasonally adjusted as necessary. Data were collected March 4–12, and 63 bankers responded to the survey.
Quarterly comments

District bankers were asked for additional comments concerning agricultural land values and credit conditions. These comments have been edited for publication.
- The 2024 cotton crop on the High Plains turned out to be a wreck—low cotton prices, reduced yields and high input costs. The proposed FARM Act payment of $84.70 per cotton acre will help reduce 2024 operating loan balances; however, we are seeing many producers with 2024 carryover debt even after receipt of the proposed payment. With the payment details yet to be announced, the 2023–24 disaster payment has made underwriting 2025 operating loans very difficult. Most producers don't have the ability to service any additional carryover debt based on the current cash flow projections. The lingering drought remains a concern. Cattle producers are one segment of the agricultural sector that remains profitable.
- Worsening drought conditions are taking a toll on winter wheat in the area. Without significant rainfall soon, the crop will fail and will need to be plowed under. Fewer stocker cattle are being turned out on the wheat. While cow-calf producers are benefiting from good prices at the sale barn, grass conditions are poor, and most of the hay supply has been depleted. Producers are tightening their belts and limiting spending to essentials.
- With no rain in 120 days, conditions are beginning to weaken. Rain is needed soon for the wheat crop. Cattle conditions are good, and the market is very strong. Cattle prices are about 10 times what they were 50 years ago. The cotton price is about the same as 50 years ago.
- Corn planting in the area is complete, and we are waiting on a rain. Pastures need rain for grazing and hay prospects. Commodity prices have operators pessimistic about this year.
- The rice producers in particular are concerned about profitability in 2025.
- Most of our farm operating notes have been renewed or booked for the 2025 growing season. First-quarter farm packages revealed several operators carrying substantial outside vendor credit that may have resulted from multiyear losses or effects of Hurricane Beryl. Loan volume has increased by terming out excess vendor credits and carryovers. We have imposed stricter loan covenants and terms for borrowers on outside vendor credit. Borrowers are more price sensitive given inflated input costs and weak crop commodity price futures for our local area. Cattle prices across the board—feeders, stockers and breeding stock—remain elevated and are expected to stay elevated as demand remains strong and spring forages are beginning to show. Recent reports on demand for beef indicate strength, and when coupled with a 60-plus-year low of inventories of breeding cattle and replacement females, we project cattle prices will be strong into the intermediate future.
- The market is flooded with alfalfa hay with many barns still full or near full. Price reductions after the first of the year have resulted in some of the carryover inventory moving. Cattle prices remain favorable, but drought continues to stress ranch resources and ultimately will impact herd size significantly if the weather pattern doesn't become more favorable. Farms are gearing up for the spring planting season as well as the wheat harvest.
- The anticipation of the Meta megasite in the area has caused land values to increase considerably; however, those factors were not included in the answers to this survey. The purchase of many acres of farmland by Meta has displaced some farmers due to the loss of rented land. This has caused a shift in farmland, and the sales price of general land is increasing to reflect this influence.
Historical data
Historical data can be downloaded dating back to first quarter 2000.
Charts
Farm lending trends
What changes occurred in non-real-estate farm loans at your bank in the past three months compared with a year earlier?
| Index | Percent reporting, Q1 | ||||
| 2024:Q4 | 2025:Q1 | Greater | Same | Less | |
Demand for loans* | –0.5 | 1.7 | 12.0 | 77.7 | 10.3 |
Availability of funds* | –1.1 | –3.7 | 4.3 | 87.7 | 8.0 |
Rate of loan repayment | –19.7 | –18.0 | 6.6 | 68.9 | 24.6 |
Loan renewals or extensions | 15.5 | 9.8 | 18.0 | 73.8 | 8.2 |
| *Seasonally adjusted. | |||||

What changes occurred in the volume of farm loans made by your bank in the past three months compared with a year earlier?
| Index | Percent reporting, Q1 | ||||
| 2024:Q4 | 2025:Q1 | Greater | Same | Less | |
Non–real–estate farm loans | –1.4 | –6.6 | 14.8 | 63.9 | 21.3 |
Feeder cattle loans* | 6.4 | 4.4 | 18.1 | 68.2 | 13.7 |
Dairy loans* | –6.3 | –15.6 | 0.0 | 84.4 | 15.6 |
Crop storage loans* | –16.0 | –9.2 | 5.5 | 79.8 | 14.7 |
Operating loans | 5.8 | 6.7 | 21.7 | 63.3 | 15.0 |
Farm machinery loans* | –17.7 | –29.5 | 3.2 | 64.1 | 32.7 |
Farm real estate loans* | –8.2 | –16.3 | 4.8 | 74.1 | 21.1 |
| *Seasonally adjusted. NOTES: Survey responses are used to calculate an index for each item by subtracting the percentage of bankers reporting less from the percentage reporting greater. Positive index readings generally indicate an increase, while negative index readings generally indicate a decrease. |
|||||
Real land values

Real cash rents

Anticipated farmland values and credit standards
What trend in farmland values do you expect in your area in the next three months?
| Index | Percent reporting, Q1 | ||||
| 2024:Q4 | 2025:Q1 | Up | Same | Down | |
| Anticipated trend in farmland values* | 2.9 | 2.3 | 7.7 | 86.9 | 5.4 |
| *Seasonally adjusted. | |||||
What change occurred in credit standards for agricultural loans at your bank in the past three months compared with a year earlier?
| 2024:Q4 | 2025:Q1 | Up | Same | Down | |
| Credit standards | 22.1 | 23.0 | 24.6 | 73.8 | 1.6 |

Tables
Rural real estate values—first quarter 2025
| Banks1 | Average value2 | Percent change in value from previous year3 | ||
Cropland–Dryland | ||||
District* | 45 | 3,383 | 9.3 | |
Texas* | 35 | 3,475 | 10.1 | |
1 | Northern High Plains | 5 | 1,250 | 0.0 |
2 | Southern High Plains | 4 | 1,238 | –2.9 |
3 | Northern Low Plains* | n.a. | n.a. | n.a. |
4 | Southern Low Plains* | 3 | 2,127 | 4.2 |
5 | Cross Timbers | n.a. | n.a. | n.a. |
6 | North Central Texas | 4 | 6,313 | 22.7 |
7 | East Texas* | 3 | 6,261 | 37.8 |
8 | Central Texas | 5 | 7,150 | 1.1 |
9 | Coastal Texas | 3 | 3,000 | 0.0 |
10 | South Texas | n.a. | n.a. | n.a. |
11 | Trans–Pecos and Edwards Plateau | 4 | 4,275 | 0.9 |
12 | Southern New Mexico | 4 | 575 | –2.2 |
13 | Northern Louisiana | 6 | 3,733 | –5.8 |
Cropland–Irrigated | ||||
District* | 38 | 4,223 | 2.0 | |
Texas* | 29 | 3,417 | 0.6 | |
1 | Northern High Plains | 5 | 2,890 | 0.0 |
2 | Southern High Plains | 4 | 2,563 | –2.4 |
3 | Northern Low Plains* | n.a. | n.a. | n.a. |
4 | Southern Low Plains | 3 | 2,667 | –5.9 |
5 | Cross Timbers | n.a. | n.a. | n.a. |
6 | North Central Texas | n.a. | n.a. | n.a. |
7 | East Texas | 3 | 7,500 | 32.3 |
8 | Central Texas | 3 | 8,333 | –2.0 |
9 | Coastal Texas | n.a. | n.a. | n.a. |
10 | South Texas | n.a. | n.a. | n.a. |
11 | Trans–Pecos and Edwards Plateau | 4 | 4,750 | 0.0 |
12 | Southern New Mexico | 3 | 11,167 | 8.9 |
13 | Northern Louisiana | 6 | 4,933 | –3.3 |
Ranchland | ||||
District* | 51 | 3,571 | 3.4 | |
Texas* | 41 | 4,249 | 3.6 | |
1 | Northern High Plains | 5 | 1,390 | 3.5 |
2 | Southern High Plains | 4 | 1,125 | –5.3 |
3 | Northern Low Plains | n.a. | n.a. | n.a. |
4 | Southern Low Plains* | 3 | 2,617 | 10.8 |
5 | Cross Timbers | n.a. | n.a. | n.a. |
6 | North Central Texas | 4 | 7,813 | 21.8 |
7 | East Texas | 7 | 5,386 | 6.7 |
8 | Central Texas | 6 | 10,667 | 4.1 |
9 | Coastal Texas | n.a. | n.a. | n.a. |
10 | South Texas | n.a. | n.a. | n.a. |
11 | Trans–Pecos and Edwards Plateau | 6 | 4,042 | –2.4 |
12 | Southern New Mexico | 5 | 635 | –1.6 |
13 | Northern Louisiana | 5 | 3,148 | 7.8 |
| *Seasonally adjusted. 1 Number of banks reporting land values. 2 Prices are dollars per acre, not adjusted for inflation. 3 Not adjusted for inflation and calculated using responses only from those banks reporting in both the past and current quarter. n.a.—Not published due to insufficient responses but included in totals for Texas and district. |
||||
Interest rates by loan type—first quarter 2025
| Feeder cattle | Other farm operating | Intermediate term | Long-term farm real estate | Fixed (average rate, percent) |
2024:Q1 | 9.31 | 9.32 | 9.07 | 8.69 |
2024:Q2 | 9.19 | 9.23 | 8.93 | 8.58 |
2024:Q3 | 9.19 | 9.19 | 8.92 | 8.63 |
2024:Q4 | 8.72 | 8.77 | 8.54 | 8.18 |
2025:Q1 | 8.63 | 8.59 | 8.26 | 7.94 | Variable (average rate, percent) |
2024:Q1 | 9.51 | 9.49 | 9.27 | 8.88 |
2024:Q2 | 9.30 | 9.31 | 9.06 | 8.71 |
2024:Q3 | 9.40 | 9.37 | 9.07 | 8.71 |
2024:Q4 | 8.82 | 8.82 | 8.59 | 8.20 |
2025:Q1 | 8.67 | 8.58 | 8.39 | 8.02 |
For More Information
Questions regarding the Agricultural Survey can be addressed to Mariam Yousuf at Mariam.Yousuf@dal.frb.org.