Special Questions

Special Questions
December 28, 2020
For this month’s survey, Texas business executives were asked supplemental questions on the impacts of COVID-19, as well as wages and prices. Results below include responses from participants of all three surveys: Texas Manufacturing Outlook Survey, Texas Service Sector Outlook Survey and Texas Retail Outlook Survey.
Texas Business Outlook Surveys
Data were collected December 14–22, and 380 Texas business executives responded to the surveys.
1. How do your firm’s current revenues compare with a typical December? For example, if revenues are down 20 percent from normal, enter 80 percent. If revenues are up 20 percent, enter 120 percent.
| May '20 (percent) |
Jun. '20 (percent) |
Jul. '20 (percent) |
Aug. '20 (percent) |
Sep. '20 (percent) |
Nov. '20 (percent) |
Dec. '20 (percent) |
|
| Share of firms reporting reduced revenues | 81.2 | 75.6 | 74.2 | 68.3 | 62.0 | 63.7 | 58.7 |
| Average revenue decline (Y/Y) | -38.3 | -32.4 | -29.1 | -29.9 | -31.3 | -28.7 | -28.8 |
| Share of firms reporting increased revenues | 10.2 | 13.7 | 15.5 | 18.3 | 21.0 | 19.9 | 24.2 |
| Average revenue increase (Y/Y) | 20.1 | 20.2 | 23.3 | 17.6 | 20.6 | 17.7 | 18.4 |
| Share of firms reporting no change in revenues | 8.6 | 10.6 | 10.3 | 13.4 | 17.0 | 16.4 | 17.1 |
NOTES: 356 responses. In past months the question wording was adjusted to reference the respective month of comparison. Averages are calculated as trimmed means with the lowest and highest 7.5 percent of responses omitted. Average revenue decline is calculated using only responses from firms that reported reduced revenues. Average revenue increase is calculated using only responses from firms that reported increased revenues.
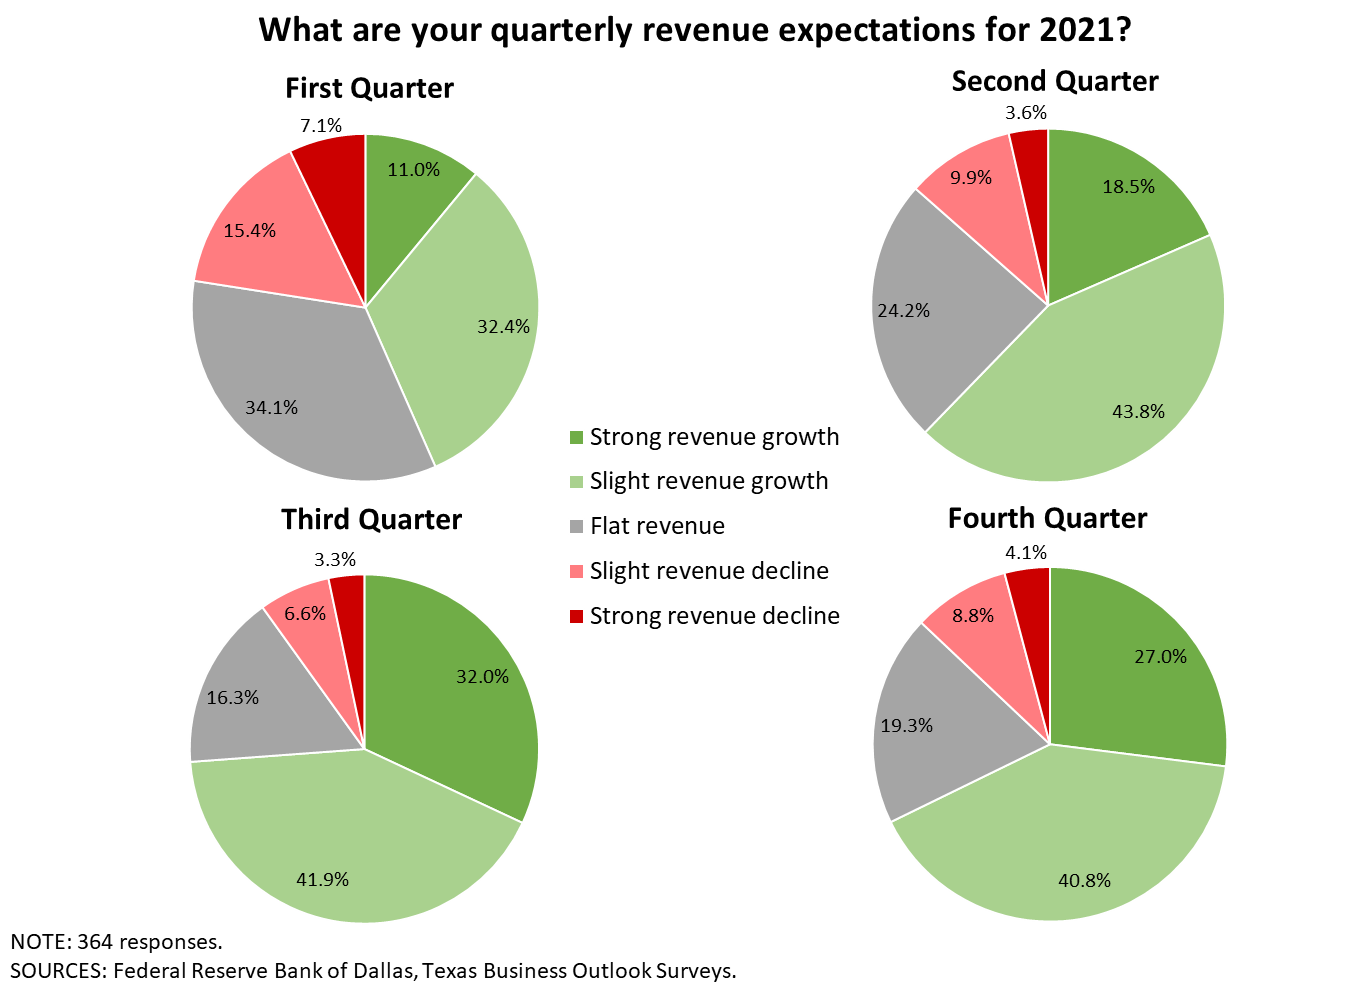
2. What change do you expect in your firm’s revenue in 2021 compared with 2020 levels?
| Dec. '20 (percent) |
|
| Increase | 66.7 |
| Decrease | 15.8 |
| No change | 17.5 |
| By what percentage? | |
| Average among respondents noting an increase | 29.6 |
| Average among respondents noting a decrease | 18.1 |
NOTES: 360 responses. Averages are calculated as trimmed means with the lowest and highest 5 percent of responses omitted.
3. How does your firm's current employee head count compare with February (pre-COVID)? For example, if head count is down 20 percent from February, enter 80 percent. If head count is up 20 percent, enter 120 percent. Please exclude any changes due to typical seasonality.
| Jun. '20 (percent) |
Jul. '20 (percent) |
Aug. '20 (percent) |
Sep. '20 (percent) |
Nov. '20 (percent) |
Dec. '20 (percent) |
|
| Share of firms reporting reduced head count | 43.0 | 51.2 | 51.4 | 49.2 | 51.1 | 47.3 |
| Average head count decline (compared with Feb. 2020 levels) | -26.5 | -25.4 | -27.2 | -30.6 | -28.4 | -25.4 |
| Share of firms reporting increased head count | 12.3 | 14.0 | 15.4 | 17.5 | 13.2 | 18.7 |
| Average head count increase (compared with Feb. 2020 levels) | 10.8 | 15.6 | 21.0 | 14.8 | 15.2 | 13.8 |
| Share of firms reporting no change in head count | 44.6 | 34.8 | 33.2 | 33.3 | 35.7 | 34.1 |
NOTES: 364 responses. Averages are calculated as trimmed means with the lowest and highest 7.5 percent of responses omitted. Average head count decline is calculated using only responses from firms that reported reduced head count. Average head count increase is calculated using only responses from firms that reported increased head count.
4. What change do you expect in your firm’s head count in 2021 compared with its current level?
| Dec. '20 (percent) |
|
| Increase | 51.6 |
| Decrease | 10.1 |
| No change | 38.3 |
| By what percentage? | |
| Average among respondents noting an increase | 24.6 |
| Average among respondents noting a decrease |
16.0 |
NOTE: 368 responses. Averages are calculated as trimmed means with the lowest and highest 5 percent of responses omitted.
5. What annual percent change in wages and input prices did your firm experience in 2020, and what do you expect for 2021? Also, by how much did your firm change selling prices in 2020, and by how much do you expect to change selling prices in 2021?
| 2020 (percent) |
2021 (percent) |
|
| Wages | 2.1 | 4.3 |
| Input prices (excluding wages) | 2.7 | 3.7 |
| Selling prices | 1.1 | 3.4 |
NOTE: 328 responses. Shown are trimmed means with the lowest and highest 5 percent of responses omitted.
6. Are there structural changes your firm has made or plans to make as a result of the COVID-19 pandemic that you expect to be permanent?
| Dec. '20 (percent) |
|
| Yes | 52.3 |
| No | 47.7 |
NOTE: 369 responses.
6a. Please specify any changes, and whether it is an increase or decrease.
| Dec. '20 (percent) |
Share noting an increase (percent) |
Share noting a decrease (percent) |
|
| Telecommuting | 67.4 | 98.2 | 1.8 |
| Technology adoption | 60.5 | 100.0 | 0.0 |
| Business travel | 50.5 | 4.2 | 95.8 |
| Office space | 40.0 | 16.4 | 83.6 |
| Contactless product/service delivery | 40.0 | 98.4 | 1.6 |
| Other new product/service offerings | 28.4 | 93.6 | 6.4 |
| Other | 8.9 |
NOTES: 190 responses. This question was only posed to those indicating they've made or plan to make structural changes.
Survey respondents were given the opportunity to provide comments. These comments can be found on the individual survey Special Questions results pages, accessible by the tabs above.
Texas Manufacturing Outlook Survey
Data were collected December 14–22, and 110 Texas manufacturers responded to the survey.
1. How do your firm’s current revenues compare with a typical December? For example, if revenues are down 20 percent from normal, enter 80 percent. If revenues are up 20 percent, enter 120 percent.
| May '20 (percent) |
Jun. '20 (percent) |
Jul. '20 (percent) |
Aug. '20 (percent) |
Sep. '20 (percent) |
Nov. '20 (percent) |
Dec. '20 (percent) |
|
| Share of firms reporting reduced revenues | 78.0 | 70.6 | 73.8 | 68.6 | 60.8 | 57.7 | 49.0 |
| Average revenue decline (Y/Y) | -38.6 | -34.4 | -30.5 | -28.7 | -28.9 | -30.7 | -28.4 |
| Share of firms reporting increased revenues | 16.5 | 16.5 | 19.4 | 20.0 | 23.5 | 29.8 | 38.2 |
| Average revenue increase (Y/Y) | 19.1 | 20.6 | 27.3 | 24.6 | 22.5 | 19.3 | 17.3 |
| Share of firms reporting no change in revenues | 5.5 | 12.8 | 6.8 | 11.4 | 15.7 | 12.5 | 12.7 |
NOTES: 102 responses. In past months the question wording was adjusted to reference the respective month of comparison. Averages are calculated as trimmed means with the lowest and highest 7.5 percent of responses omitted. Average revenue decline is calculated using only responses from firms that reported reduced revenues. Average revenue increase is calculated using only responses from firms that reported increased revenues.
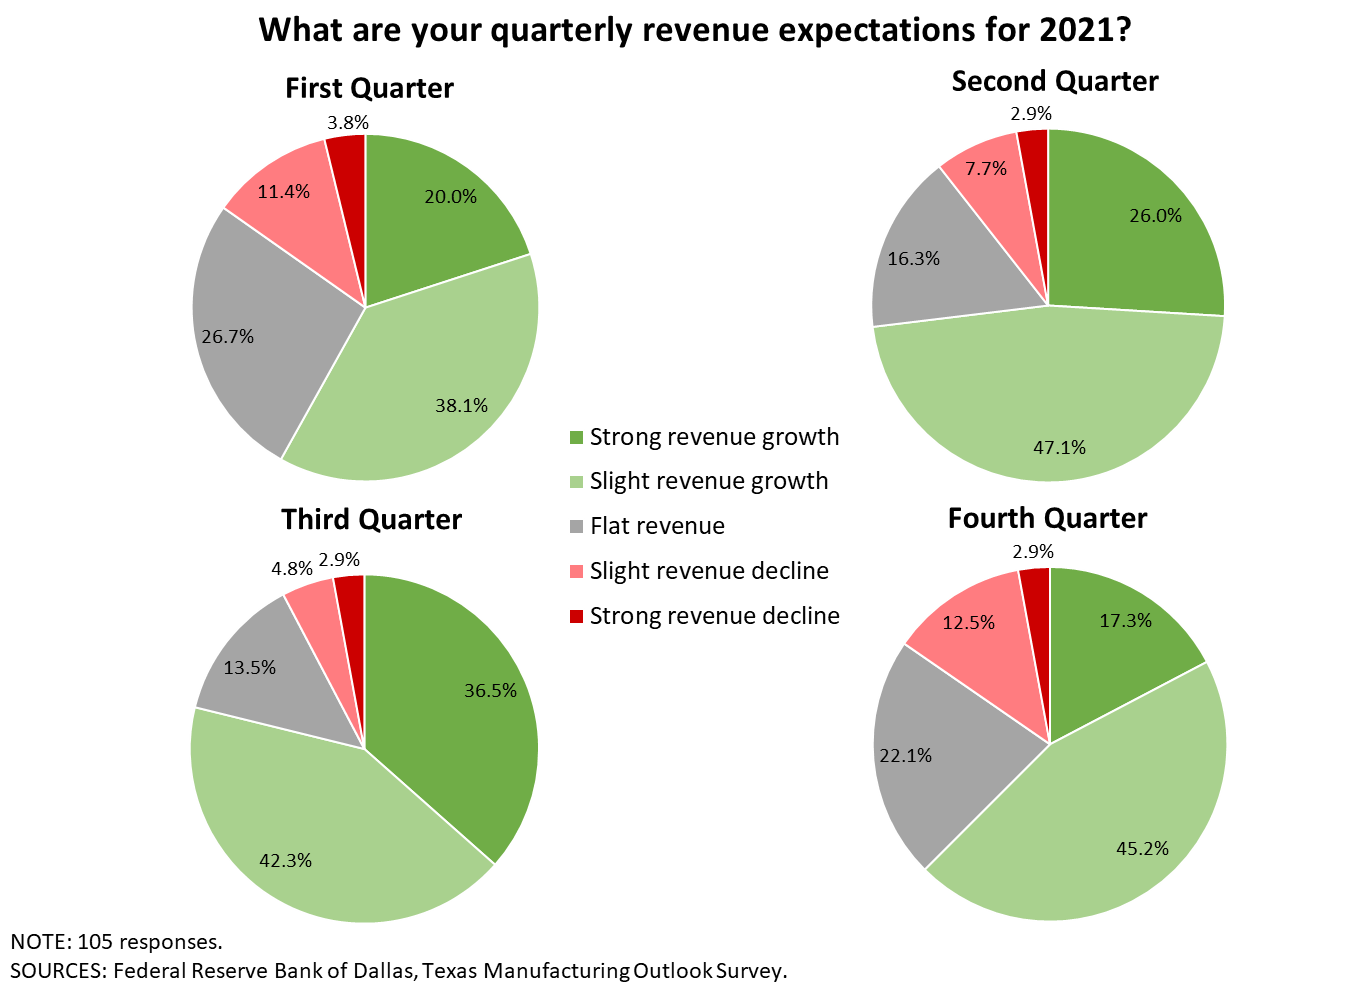
2. What change do you expect in your firm’s revenue in 2021 compared with 2020 levels?
| Dec. '20 (percent) |
|
| Increase | 75.0 |
| Decrease | 11.5 |
| No change | 13.5 |
| By what percentage? | |
| Average among respondents noting an increase | 30.6 |
| Average among respondents noting a decrease | 22.8 |
NOTES: 104 responses. Averages are calculated as trimmed means with the lowest and highest 5 percent of responses omitted.
3. How does your firm's current employee head count compare with February (pre-COVID)? For example, if head count is down 20 percent from February, enter 80 percent. If head count is up 20 percent, enter 120 percent. Please exclude any changes due to typical seasonality.
| Jun. '20 (percent) |
Jul. '20 (percent) |
Aug. '20 (percent) |
Sep. '20 (percent) |
Nov. '20 (percent) |
Dec. '20 (percent) |
|
| Share of firms reporting reduced head count | 42.6 | 52.5 | 47.6 | 43.6 | 49.0 | 48.1 |
| Average head count decline (compared with Feb. 2020 levels) | -20.7 | -23.0 | -23.9 | -22.9 | -24.5 | -25.6 |
| Share of firms reporting increased head count | 15.7 | 21.2 | 21.9 | 16.8 | 17.3 | 24.5 |
| Average head count increase (compared with Feb. 2020 levels) | 9.2 | 22.5 | 17.1 | 13.1 | 22.0 | 18.8 |
| Share of firms reporting no change in head count | 41.7 | 26.3 | 30.5 | 39.6 | 33.7 | 27.4 |
NOTES: 106 responses. Averages are calculated as trimmed means with the lowest and highest 7.5 percent of responses omitted. Average head count decline is calculated using only responses from firms that reported reduced head count. Average head count increase is calculated using only responses from firms that reported increased head count.
4. What change do you expect in your firm’s head count in 2021 compared with its current level?
| Dec. '20 (percent) |
|
| Increase | 56.1 |
| Decrease | 11.2 |
| No change | 32.7 |
| By what percentage? | |
| Average among respondents noting an increase | 22.2 |
| Average among respondents noting a decrease | 13.5 |
NOTES: 107 responses. Averages are calculated as trimmed means with the lowest and highest 5 percent of responses omitted.
5. What annual percent change in wages and input prices did your firm experience in 2020, and what do you expect for 2021? Also, by how much did your firm change selling prices in 2020, and by how much do you expect to change selling prices in 2021?
| 2020 (percent) |
2021 (percent) |
|
| Wages | 3.3 | 4.2 |
| Input prices (excluding wages) | 3.0 | 4.6 |
| Selling prices | 1.6 | 3.9 |
NOTES: 101 responses. Shown are trimmed means with the lowest and highest 5 percent of responses omitted.
6. Are there structural changes your firm has made or plans to make as a result of the COVID-19 pandemic that you expect to be permanent?
| Dec. '20 (percent) |
|
| Yes | 40.2 |
| No | 59.8 |
NOTE: 107 responses.
6a. Please specify any changes, and whether it is an increase or decrease.
| Dec. '20 (percent) |
Share noting an increase (percent) |
Share noting a decrease (percent) |
|
| Telecommuting | 75.6 | 96.7 | 3.3 |
| Business travel | 68.3 | 7.1 | 92.9 |
| Technology adoption | 58.5 | 100.0 | 0.0 |
| Other new product/service offerings | 31.7 | 91.7 | 8.3 |
| Office space | 29.3 | 0.0 | 100.0 |
| Contactless product/service delivery | 24.4 | 90.0 | 10.0 |
| Other | 12.2 |
NOTES: 41 responses. This question was only posed to those indicating they've made or plan to make structural changes.
Special Questions Comments
These comments have been edited for publication.
Chemical Manufacturing
- We’ve noticed we are able to conduct the same level of business with fewer employees. We have already eliminated 8 percent of remote positions and will evaluate more reductions by focusing on essential business activities.
Plastics and Rubber Products Manufacturing
- 2020 has been challenging for the oil industry. Pre-COVID, we were already seeing a pullback in the market as inventory levels began to reach peak. Then COVID hit and consumption dropped considerably. Domestic oil production is down 60 percent versus this time last year. However, things are beginning to rebound. Four months ago, analysts were predicting an average onshore rig count of approximately 280 around this time, with the average next year being around that same number. Fast forward to December, and now we’re sitting at 338 (which is an increase over last week). Is a rebound due soon? Could it just be optimism with the incoming president-elect and the possibility of a vaccine for COVID? Only time will tell.
Primary Metal Manufacturing
- High-rise construction will slow markedly in the second half [of 2021].
Fabricated Metal Manufacturing
- We expect sales and profits to be below normal for the first two quarters of 2021 but expect the second half of the year to improve significantly.
- For the steel construction markets, there has been a significant uptick in demand that coincides with a reduction in supply. This has led to shortages and allocations resulting in significantly higher steel prices. Also, it is very difficult to hire in today’s environment. The additional COVID relief recently announced will prolong this difficulty. Hopefully the vaccine will help keep the existing workforce healthy.
Machinery Manufacturing
- I want my country back. COVID is being used to harm small companies. Embedded corruption is destroying “blue collar” faith in our institutions. Our judicial system has failed. Our election system has failed. Our media has failed. The rule of law has collapsed. Economic instability is a major concern for 2021 due to these issues.
- Our company had a significant layoff which may continue into the first quarter of next year unless sales improve significantly.
- We will continue to vertically integrate our company, albeit at a much slower pace. We will continue to pay off debt and reduce expenses at an aggressive pace. We will only hire salespeople who can contribute to sales immediately. We’ve eliminated the bottom 10 percent of our employees and hope to replace them with better-quality personnel to improve our company performance. These are desperate times, and we can only afford the very best people.
- We are managing rapid expansion, which is a challenge within itself.
Computer and Electronic Product Manufacturing
- Watch a lack of confidence in manufacturing go through the roof; going from pro-business to against business is not the best government policy.
Transportation Equipment Manufacturing
- We may make structural changes based on economic threats and reality. COVID is going away.
Food Manufacturing
- We will have reduced group meetings and remain strong on anti-COVID practices. We do not admit nonemployees into the facility. We will not make the vaccine mandatory, though we will encourage it. We are an essential service.
Texas Service Sector Outlook Survey
Data were collected December 14–22, and 270 Texas business executives responded to the survey.
1. How do your firm’s current revenues compare with a typical December? For example, if revenues are down 20 percent from normal, enter 80 percent. If revenues are up 20 percent, enter 120 percent.
| May '20 (percent) |
Jun. '20 (percent) |
Jul. '20 (percent) |
Aug. '20 (percent) |
Sep. '20 (percent) |
Nov. '20 (percent) |
Dec. '20 (percent) |
|
| Share of firms reporting reduced revenues | 82.5 | 77.6 | 74.4 | 68.2 | 62.5 | 66.0 | 62.6 |
| Average revenue decline (Y/Y) | -38.4 | -31.8 | -28.7 | -30.5 | -32.5 | -28.1 | -29.3 |
| Share of firms reporting increased revenues | 7.7 | 12.6 | 14.1 | 17.7 | 20.1 | 16.0 | 18.5 |
| Average revenue increase (Y/Y) | 23.1 | 21.9 | 23.1 | 16.6 | 19.7 | 16.4 | 21.0 |
| Share of firms reporting no change in revenues | 9.9 | 9.7 | 11.6 | 14.1 | 17.5 | 17.9 | 18.9 |
NOTES: 254 responses. In past months the question wording was adjusted to reference the respective month of comparison. Averages are calculated as trimmed means with the lowest and highest 7.5 percent of responses omitted. Average revenue decline is calculated using only responses from firms that reported reduced revenues. Average revenue increase is calculated using only responses from firms that reported increased revenues.
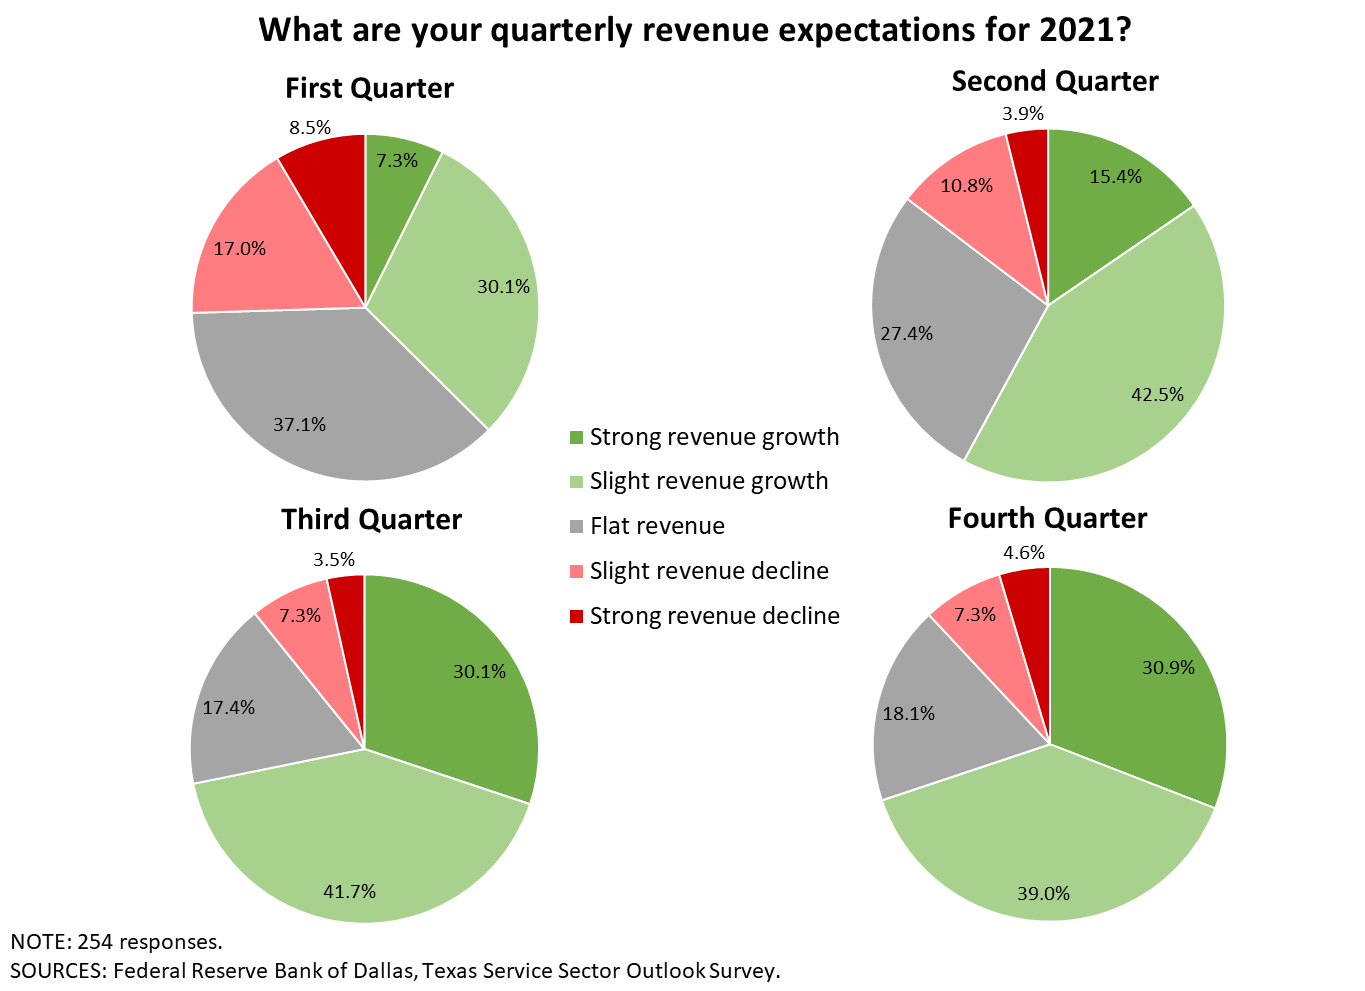
2. What change do you expect in your firm’s revenue in 2021 compared with 2020 levels?
| Dec. '20 (percent) |
|
| Increase | 63.3 |
| Decrease | 17.6 |
| No change | 19.1 |
| By what percentage? | |
| Average among respondents noting an increase | 29.1 |
| Average among respondents noting a decrease | 18.4 |
NOTES: 256 responses. Averages are calculated as trimmed means with the lowest and highest 5 percent of responses omitted.
3. How does your firm's current employee head count compare with February (pre-COVID)? For example, if head count is down 20 percent from February, enter 80 percent. If head count is up 20 percent, enter 120 percent. Please exclude any changes due to typical seasonality.
| Jun. '20 (percent) |
Jul. '20 (percent) |
Aug. '20 (percent) |
Sep. '20 (percent) |
Nov. '20 (percent) |
Dec. '20 (percent) |
|
| Share of firms reporting reduced head count | 43.2 | 50.7 | 52.8 | 51.3 | 51.9 | 46.9 |
| Average head count decline (compared with Feb. 2020 levels) | -29.3 | -26.7 | -28.8 | -33.1 | -30.4 | -25.3 |
| Share of firms reporting increased head count | 11.0 | 11.4 | 13.0 | 17.7 | 11.7 | 16.3 |
| Average head count increase (compared with Feb. 2020 levels) | 12.8 | 13.4 | 23.7 | 15.4 | 11.1 | 12.6 |
| Share of firms reporting no change in head count | 45.8 | 37.9 | 34.2 | 31.0 | 36.5 | 36.8 |
NOTES: 258 responses. Averages are calculated as trimmed means with the lowest and highest 7.5 percent of responses omitted. Average head count decline is calculated using only responses from firms that reported reduced head count. Average head count increase is calculated using only responses from firms that reported increased head count.
4. What change do you expect in your firm’s head count in 2021 compared with its current level?
| Dec. '20 (percent) |
|
| Increase | 49.8 |
| Decrease | 9.6 |
| No change | 40.6 |
| By what percentage? | |
| Average among respondents noting an increase | 26.0 |
| Average among respondents noting a decrease | 19.9 |
NOTE: 261 responses. Averages are calculated as trimmed means with the lowest and highest 5 percent of responses omitted.
5. What annual percent change in wages and input prices did your firm experience in 2020, and what do you expect for 2021? Also, by how much did your firm change selling prices in 2020, and by how much do you expect to change selling prices in 2021?
| 2020 (percent) |
2021 (percent) |
|
| Wages | 1.3 | 4.4 |
| Input prices (excluding wages) | 2.6 | 3.2 |
| Selling prices | 0.8 | 3.2 |
NOTES: 227 responses. Shown are trimmed means with the lowest and highest 5 percent of responses omitted.
6. Are there structural changes your firm has made or plans to make as a result of the COVID-19 pandemic that you expect to be permanent?
| Dec. '20 (percent) |
|
| Yes | 57.3 |
| No | 42.7 |
NOTE: 262 responses.
6a. Please specify any changes, and whether it is an increase or decrease.
| Dec. '20 (percent) |
Share noting an increase (percent) |
Share noting a decrease (percent) |
|
| Telecommuting | 65.1 | 98.8 | 1.3 |
| Technology adoption | 61.1 | 100.0 | 0.0 |
| Business travel | 45.6 | 2.9 | 97.1 |
| Contactless product/service delivery | 44.3 | 100.0 | 0.0 |
| Office space | 43.0 | 20.0 | 80.0 |
| Other new product/service offerings | 27.5 | 94.3 | 5.7 |
| Other | 8.1 |
NOTES: 149 responses. This question was only posed to those indicating they've made or plan to make structural changes.
Special Questions Comments
These comments have been edited for publication.
Warehousing and Storage
- We expect to see diminished revenue in 2021 compared to 2020, for both us and our customers, and will respond with minimal wage increases and by holding our customer tariff flat. We do not expect to cut costs spent for maintenance and capital, however—nor do we expect to reduce head count, though we will remain flat after four years of double-digit head-count growth.
Publishing Industries (Except Internet)
- Traction this month seems to have hit a muddy, uncertain spot. Longer-term, we are still quite positive.
Broadcasting (Except Internet)
- Our selling prices are down 20 percent compared to 2019, and we expect that we will not recover pricing back to 2019 levels until fourth quarter 2021. However, we expect to add more customers beginning in June 2021 and, thereby, increase total revenues in 2021 over 2020.
Data Processing, Hosting, and Related Services
- Uncertainty about the economy is top of mind (as it’s currently negatively impacting purchasing decisions). Significant plans to grow the company are pending as we see if the economy continues to grow. We are watching to see if regulations and government spending will increase (both of which slow our customers’ purchasing decisions and our hiring decisions). We are keeping an eye on inflation as well.
Securities, Commodity Contracts, and Other Financial Investments and Related Activities
- The IRS rules for PPP [Paycheck Protection Program] loan forgiveness will cause a major tax blow.
Real Estate
- Our company gave COVID bonuses this year.
Professional, Scientific and Technical Services
- Remote working from home due to COVID has proven to be very productive for our workforce. Now we, as the employer, will trust employees more to work from home, and a remote work option for the majority of days will always be available. Employees will choose which mix they like.
- COVID-19 has taught us that working remotely is a viable option for some of our processes. This is going to allow us to reduce our office footprint and increase our efficiencies. With the adoption of technology, our staff has seen a tremendous amount of time savings that they weren’t willing to embrace pre-COVID.
- We expect most of our staff to return to offices, but we will allow more telecommuting than before, particularly in cities with heavy traffic/long commutes.
- PPP [the Paycheck Protection Program] did for us what it was supposed to do and allowed us to hang on to our people and complete the projects we had in hand through 2020. However, the continued impacts of COVID on the energy and commercial real estate industries have left us with very little backlog and reduced opportunities for new projects into 2021.
- As an independent consultant, I will continue to be a company of “one” that when help is needed, it will be of the contract (IRS 1099) variety. There will definitely be extremely limited face-to-face contact, and most meetings will be virtual.
Administrative and Support Services
- PPE [personal protection equipment] prices will continue to rise in 2021, I believe, for the first two quarters. Once the full effect of the vaccines is felt, we should see some sanity in the supply chain and people’s perceptions of their personnel safety.
- We provide travel services to federal agencies and the Department of Defense. We have three contracts, and they are based on fixed pricing, and we have been providing our services for the last four months when they started to travel. Even during the pandemic, the agencies have been very active with requests for quotation, and we have been replying to all those that we qualified for. We have been productive in preparing the proposals and managing our contracts. These activities have kept us positive and energized.
- We are a high-personal-touch service and have had to adjust how we engage clients and deliver services as well as generate new business.
Ambulatory Health Care Services
- We currently have five of 130 employees out with COVID, so we are seeing a surge, but cases appear mild.
- COVID-19 has taught lessons that could be a permanent way of doing business. Leveraging technology and delivering services to changing customer expectations is the way to move forward.
Museums, Historical Sites, and Similar Institutions
- We have reduced hours or days open to the public.
Accommodation
- We have implemented wage increases a result of California and Florida minimum-wage increases. Input cost increases are a result of COVID-related changes at hotels, including increased cleaning supplies, personal protective equipment and increased guest supplies.
Personal and Laundry Services
- I anticipate revenue to increase in 2021, but I am also an optimist. There is really too much uncertainty. So much of the boost in the economy is dependent on vaccines being effective. If there are any major issues with the vaccine process or side effects, I could see another 20 percent decline in business in 2021.
Utilities
- More employees are working from home.
Texas Retail Outlook Survey
Data were collected December 14–22, and 51 Texas retailers responded to the survey.
1. How do your firm’s current revenues compare with a typical December? For example, if revenues are down 20 percent from normal, enter 80 percent. If revenues are up 20 percent, enter 120 percent.
| May '20 (percent) |
Jun. '20 (percent) |
Jul. '20 (percent) |
Aug. '20 (percent) |
Sep. '20 (percent) |
Nov. '20 (percent) |
Dec. '20 (percent) |
|
| Share of firms reporting reduced revenues | 90.7 | 78.4 | 76.0 | 67.9 | 58.5 | 66.7 | 64.6 |
| Average revenue decline (Y/Y) | -35.0 | -34.0 | -21.1 | -25.6 | -28.5 | -23.1 | -18.1 |
| Share of firms reporting increased revenues | 1.9 | 15.7 | 18.0 | 18.9 | 22.6 | 20.8 | 14.6 |
| Average revenue increase (Y/Y) | 20.0 | 15.0 | 20.7 | 21.8 | 22.0 | 30.3 | 13.7 |
| Share of firms reporting no change in revenues | 7.4 | 5.9 | 6.0 | 13.2 | 18.9 | 12.5 | 20.8 |
NOTES: 48 responses. In past months the question wording was adjusted to reference the respective month of comparison. Averages are calculated as trimmed means with the lowest and highest 7.5 percent of responses omitted. Average revenue decline is calculated using only responses from firms that reported reduced revenues. Average revenue increase is calculated using only responses from firms that reported increased revenues.
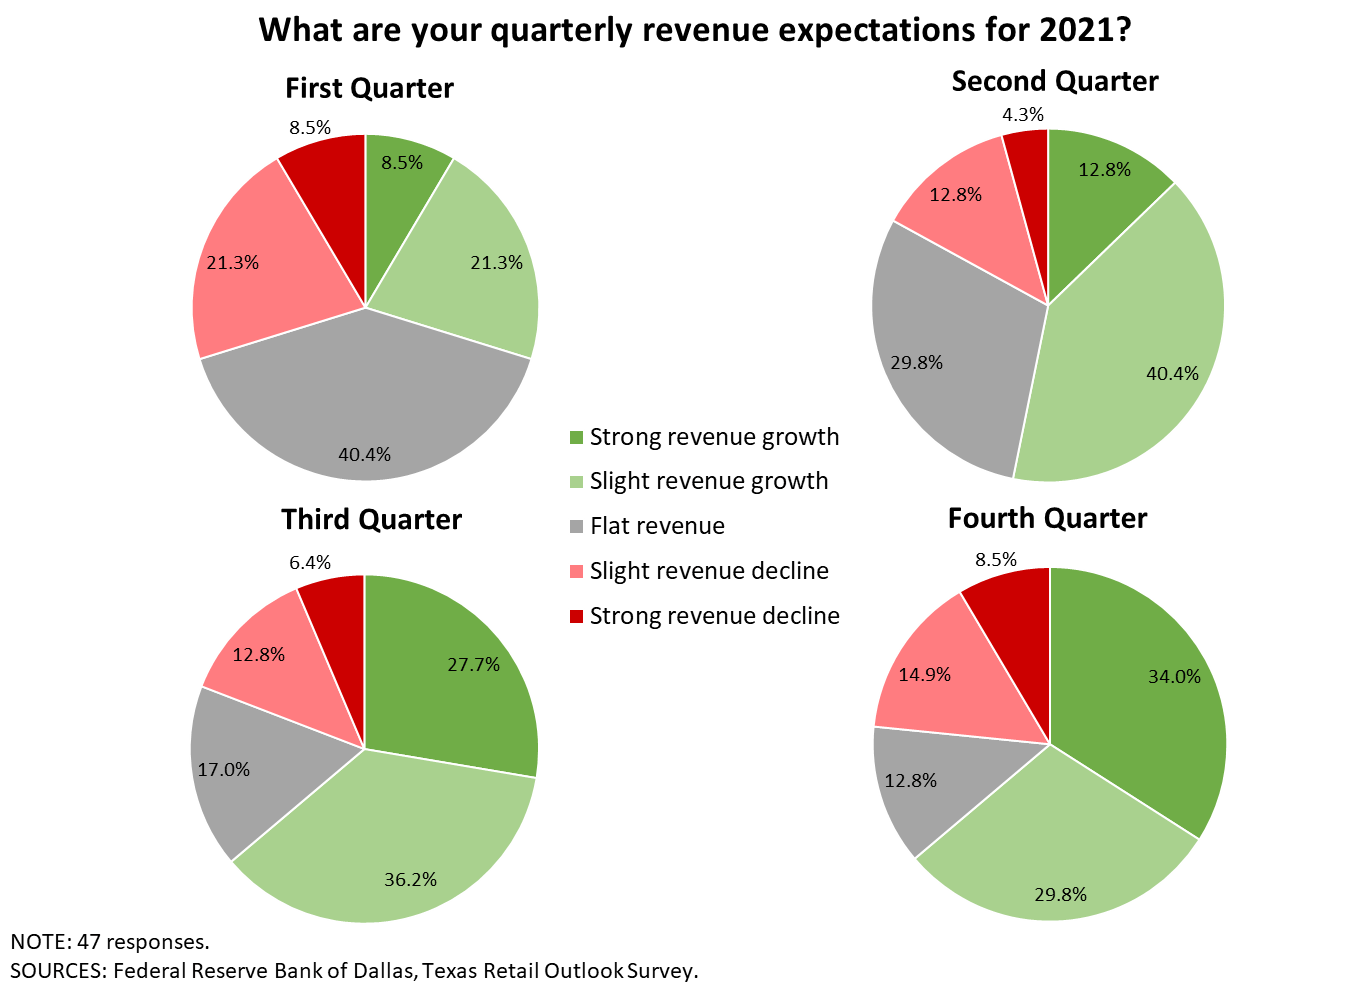
2. What change do you expect in your firm’s revenue in 2021 compared with 2020 levels?
| Dec. '20 (percent) |
|
| Increase | 57.1 |
| Decrease | 22.4 |
| No change | 20.4 |
| By what percentage? | |
| Average among respondents noting an increase | 27.3 |
| Average among respondents noting a decrease | 10.8 |
NOTES: 49 responses. Averages are calculated as trimmed means with the lowest and highest 5 percent of responses omitted.
3. How does your firm's current employee head count compare with February (pre-COVID)? For example, if head count is down 20 percent from February, enter 80 percent. If head count is up 20 percent, enter 120 percent. Please exclude any changes due to typical seasonality.
| Jun. '20 (percent) |
Jul. '20 (percent) |
Aug. '20 (percent) |
Sep. '20 (percent) |
Nov. '20 (percent) |
Dec. '20 (percent) |
|
| Share of firms reporting reduced head count | 41.2 | 52.0 | 45.3 | 53.7 | 46.9 | 39.6 |
| Average head count decline (compared with Feb. 2020 levels) | -26.1 | -17.4 | -27.0 | -31.2 | -25.6 | -16.9 |
| Share of firms reporting increased head count | 7.8 | 4.0 | 13.2 | 7.4 | 12.2 | 16.7 |
| Average head count increase (compared with Feb. 2020 levels) | 11.3 | 42.5 | 20.0 | 18.8 | 8.7 | 6.6 |
| Share of firms reporting no change in head count | 51.0 | 44.0 | 41.5 | 38.9 | 40.8 | 43.8 |
NOTES: 48 responses. Averages are calculated as trimmed means with the lowest and highest 7.5 percent of responses omitted. Average head count decline is calculated using only responses from firms that reported reduced head count. Average head count increase is calculated using only responses from firms that reported increased head count.
4. What change do you expect in your firm’s head count in 2021 compared with its current level?
| Dec. '20 (percent) |
|
| Increase | 39.6 |
| Decrease | 8.3 |
| No change | 52.1 |
| By what percentage? | |
| Average among respondents noting an increase | 25.8 |
| Average among respondents noting a decrease | 32.5 |
NOTES: 48 responses. Averages are calculated as trimmed means with the lowest and highest 5 percent of responses omitted.
5. What annual percent change in wages and input prices did your firm experience in 2020, and what do you expect for 2021? Also, by how much did your firm change selling prices in 2020, and by how much do you expect to change selling prices in 2021?
| 2020 (percent) |
2021 (percent) |
|
| Wages | 1.1 | 3.0 |
| Input prices (excluding wages) | 3.3 | 2.6 |
| Selling prices | 2.4 | 2.9 |
NOTES: 48 responses. Averages are calculated as trimmed means with the lowest and highest 5 percent of responses omitted.
6. Are there structural changes your firm has made or plans to make as a result of the COVID-19 pandemic that you expect to be permanent?
| Dec. '20 (percent) |
|
| Yes | 51.0 |
| No | 49.0 |
NOTE: 49 responses.
6a. Please specify any changes, and whether it is an increase or decrease.
| Dec. '20 (percent) |
Share noting an increase (percent) |
Share noting a decrease (percent) |
|
| Technology adoption | 79.2 | 100.0 | 0.0 |
| Contactless product/service delivery | 66.7 | 100.0 | 0.0 |
| Telecommuting | 37.5 | 100.0 | 0.0 |
| Other new product/service offerings | 37.5 | 100.0 | 0.0 |
| Business travel | 33.3 | 0.0 | 100.0 |
| Office space | 29.2 | 50.0 | 50.0 |
| Other | 0.0 |
NOTES: 24 responses. This question was only posed to those indicating they've made or plan to make structural changes.
Special Questions Comments
These comments have been edited for publication.
Merchant Wholesalers, Durable Goods
- Pricing is commodity based.
- We're closing the business.
Building Material and Garden Equipment and Supplies Dealers
- We are using Teams for more of our meetings.
Questions regarding the Texas Business Outlook Surveys can be addressed to Emily Kerr at emily.kerr@dal.frb.org.
Sign up for our email alert to be automatically notified as soon as the latest surveys are released on the web.