Special Questions

Special Questions
February 24, 2020
Results below include responses from participants of all three surveys: Texas Manufacturing Outlook Survey, Texas Service Sector Outlook Survey and Texas Retail Outlook Survey.
Texas Business Outlook Surveys
Data were collected February 11–19, and 376 Texas business executives responded to the survey.
See data files with a full history of results.
Are you currently trying to hire?
| May. ’19 (percent) |
Aug. ’19 (percent) |
Nov. ’19 (percent) |
Feb. ’20 (percent) |
|
| Yes | 71.4 | 69.8 | 60.0 | 65.5 |
| No | 28.6 | 30.2 | 40.0 | 34.5 |
NOTE: 371 responses.
Are you having problems finding qualified workers when hiring?
| May. ’19 (percent) |
Aug. ’19 (percent) |
Nov. ’19 (percent) |
Feb. ’20 (percent) |
|
| Yes | 83.0 | 75.6 | 80.5 | 80.2 |
| No | 17.0 | 24.4 | 19.5 | 19.8 |
NOTES: 237 responses. This question was posed only to respondents that answered “Yes” to the preceding question.
If you are having problems finding qualified workers, what are the main reasons? Please check all that apply.
| Feb. ’17 (percent) |
Feb. ’18 (percent) |
May ’19 (percent) |
Feb. ’20 (percent) |
|
| Lack of available applicants/no applicants | 43.2 | 62.6 | 62.9 | 60.0 |
| Lack of technical competencies (hard skills) | 59.8 | 50.2 | 53.1 | 52.6 |
| Lack of experience | 40.5 | 37.0 | 39.4 | 44.7 |
| Looking for more pay than is offered | 34.4 | 40.1 | 46.9 | 43.7 |
| Lack of workplace competencies (soft skills) | 43.2 | 39.6 | 33.8 | 37.9 |
| Inability to pass drug test and/or background check | 29.3 | 30.0 | 32.9 | 24.7 |
NOTES: 190 responses. This question was posed only to respondents that answered “Yes” to having problems finding qualified workers.
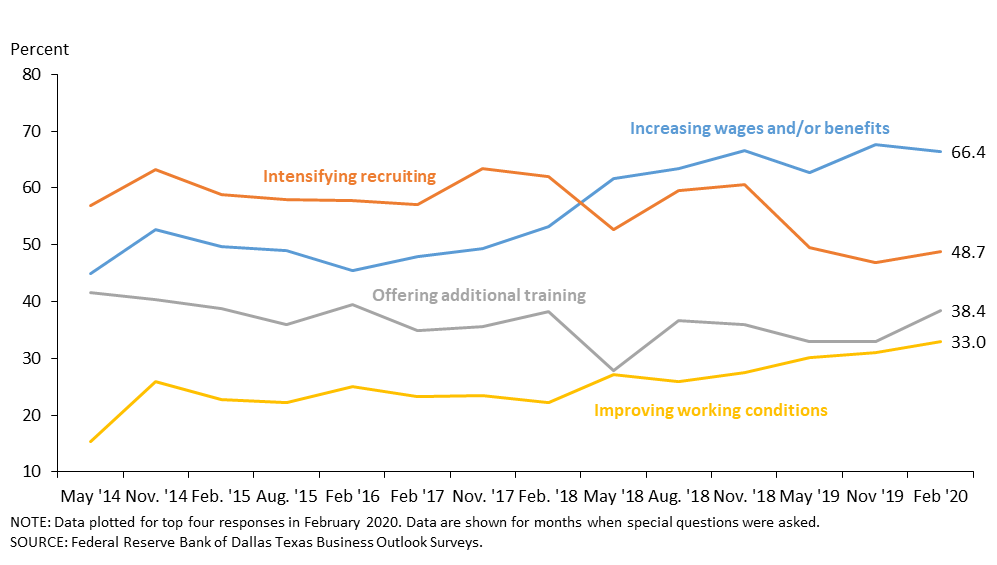
What, if anything, are you doing to recruit and retain employees? Please check all that apply.
| Feb. ’17 (percent) |
Feb. ’18 (percent) |
May ’19 (percent) |
Feb. ’20 (percent) |
|
| Increasing wages and/or benefits | 47.9 | 53.3 | 62.7 | 66.4 |
| Increasing wages | 58.3 | 59.1 | ||
| Intensifying recruiting, including advertising, paying recruiting bonuses, utilizing employment agencies, etc. | 57.1 | 62.1 | 49.5 | 48.7 |
| Offering additional training | 34.8 | 38.2 | 32.9 | 38.4 |
| Improving working conditions | 23.2 | 22.2 | 30.1 | 33.0 |
| Increasing variable pay, including bonuses | 30.1 | 33.3 | 32.3 | 28.6 |
| Increasing benefits | 17.9 | 21.7 | ||
| Reducing education and other requirements for new hires | 5.4 | 6.5 | 8.5 | 8.2 |
NOTES: 318 responses. Starting in May '19, "increasing wages" appears as a separate answer choice from "increasing benefits." We will continue to include the share of firms reporting increasing wages and/or benefits but as a calculation based on responses to "increasing wages" and "increasing benefits."
Texas Manufacturing Outlook Survey
Data were collected February 11–19, and 105 Texas manufacturers responded to the surveys.
See data files with a full history of results.
Are you currently trying to hire?
| May. ’19 (percent) |
Aug. ’19 (percent) |
Nov. ’19 (percent) |
Feb. ’20 (percent) |
|
| Yes | 72.7 | 64.0 | 59.5 | 57.1 |
| No | 27.3 | 36.0 | 40.5 | 42.9 |
NOTE: 105 responses.
Are you having problems finding qualified workers when hiring?
| May. ’19 (percent) |
Aug. ’19 (percent) |
Nov. ’19 (percent) |
Feb. ’20 (percent) |
|
| Yes | 79.5 | 83.6 | 86.2 | 84.5 |
| No | 20.5 | 16.4 | 13.8 | 15.5 |
NOTES: 58 responses. This question was posed only to respondents that answered “Yes” to the preceding question.
If you are having problems finding qualified workers, what are the main reasons? Please check all that apply.
| Feb. ’17 (percent) |
Feb. ’18 (percent) |
May ’19 (percent) |
Feb. ’20 (percent) |
|
| Lack of available applicants/no applicants | 44.3 | 72.1 | 60.7 | 65.3 |
| Lack of technical competencies (hard skills) | 72.2 | 60.3 | 68.9 | 57.1 |
| Lack of workplace competencies (soft skills) | 45.6 | 44.1 | 42.6 | 51.0 |
| Lack of experience | 44.3 | 44.1 | 42.6 | 49.0 |
| Looking for more pay than is offered | 36.7 | 38.2 | 44.3 | 46.9 |
| Inability to pass drug test and/or background check | 29.1 | 41.2 | 42.6 | 28.6 |
NOTES: 49 responses. This question was posed only to respondents that answered “Yes” to having problems finding qualified workers.
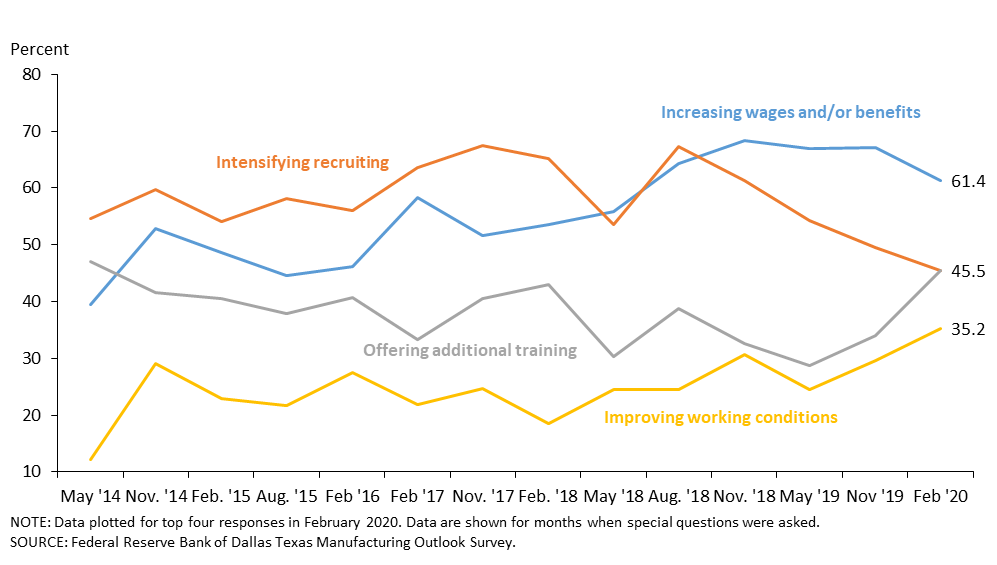
What, if anything, are you doing to recruit and retain employees? Please check all that apply.
| Feb. ’17 (percent) |
Feb. ’18 (percent) |
May ’19 (percent) |
Feb. ’20 (percent) |
|
| Increasing wages and/or benefits | 58.3 | 53.5 | 67.0 | 61.4 |
| Increasing wages | 59.6 | 56.8 | ||
| Intensifying recruiting, including advertising, paying recruiting bonuses, utilizing employment agencies, etc. | 63.5 | 65.1 | 54.3 | 45.5 |
| Offering additional training | 33.3 | 43.0 | 28.7 | 45.5 |
| Improving working conditions | 21.9 | 18.6 | 24.5 | 35.2 |
| Increasing variable pay, including bonuses | 30.2 | 31.4 | 34.0 | 30.7 |
| Increasing benefits | 16.0 | 15.9 | ||
| Reducing education and other requirements for new hires | 5.2 | 4.7 | 11.7 | 11.4 |
NOTES: 88 responses. Starting in May '19, "increasing wages" appears as a separate answer choice from "increasing benefits." We will continue to include the share of firms reporting increasing wages and/or benefits but as a calculation based on responses to "increasing wages" and "increasing benefits."
Special Questions Comments
These comments have been edited for publication.
Primary Metal Manufacturing
- There are not enough people who want or need to work.
Fabricated Metal Manufacturing
- It is very difficult finding hourly employees with construction experience who we can afford and that can pass drug and background tests. Also, young employees in their 20s seem to come to work for 90 days, then quit.
Machinery Manufacturing
- We had to lay off 15 percent of our employees in January.
Computer and Electronic Product Manufacturing
- We are doing well hiring unskilled labor and training for assembly jobs. It is more of a challenge finding skilled engineers.
Food Manufacturing
- The No. 1 problem in supporting growth is the lack of available labor. The lack of labor in this country is at a critical point. We must solve this shortage or we will stop growing. Period.
- We have restructured our shift schedule to allow everyone off every other Friday, Saturday and Sunday.
Miscellaneous Manufacturing
- Lack of applicants and no skill level are the two main barriers.
Texas Service Sector Outlook Survey
Data were collected February 11–19, and 271 Texas business executives responded to the surveys.
See data files with a full history of results.
Are you currently trying to hire?
| May. ’19 (percent) |
Aug. ’19 (percent) |
Nov. ’19 (percent) |
Feb. ’20 (percent) |
|
| Yes | 70.8 | 72.3 | 60.2 | 68.8 |
| No | 29.2 | 27.7 | 39.8 | 31.2 |
NOTE: 266 responses.
Are you having problems finding qualified workers when hiring?
| May. ’19 (percent) |
Aug. ’19 (percent) |
Nov. ’19 (percent) |
Feb. ’20 (percent) |
|
| Yes | 84.5 | 72.5 | 78.1 | 78.8 |
| No | 15.5 | 27.5 | 21.9 | 21.2 |
NOTES: 179 responses. This question was posed only to respondents that answered “Yes” to the preceding question.
If you are having problems finding qualified workers, what are the main reasons? Please check all that apply.
| Feb. ’17 (percent) |
Feb. ’18 (percent) |
May ’19 (percent) |
Feb. ’20 (percent) |
|
| Lack of available applicants/no applicants | 42.8 | 58.5 | 63.8 | 58.2 |
| Lack of technical competencies (hard skills) | 54.4 | 45.9 | 46.7 | 51.1 |
| Lack of experience | 38.9 | 34.0 | 38.2 | 43.3 |
| Looking for more pay than is offered | 33.3 | 40.9 | 48.0 | 42.6 |
| Lack of workplace competencies (soft skills) | 42.2 | 37.7 | 30.3 | 33.3 |
| Inability to pass drug test and/or background check | 29.4 | 25.2 | 28.9 | 23.4 |
NOTES: 141 responses. This question was posed only to respondents that answered “Yes” to having problems finding qualified workers.
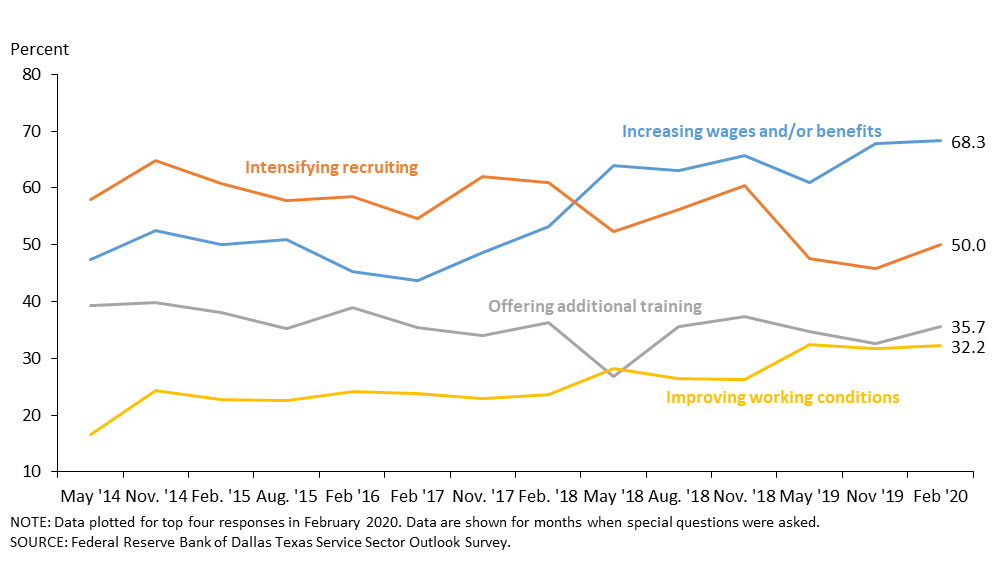
What, if anything, are you doing to recruit and retain employees? Please check all that apply.
| Feb. ’17 (percent) |
Feb. ’18 (percent) |
May ’19 (percent) |
Feb. ’20 (percent) |
|
| Increasing wages and/or benefits | 43.8 | 53.2 | 60.9 | 68.3 |
| Increasing wages | 57.8 | 60.0 | ||
| Intensifying recruiting, including advertising, paying recruiting bonuses, utilizing employment agencies, etc. | 54.6 | 60.9 | 47.6 | 50.0 |
| Offering additional training | 35.4 | 36.4 | 34.7 | 35.7 |
| Improving working conditions | 23.8 | 23.6 | 32.4 | 32.2 |
| Increasing variable pay, including bonuses | 30.0 | 34.1 | 31.6 | 27.8 |
| Increasing benefits | 18.7 | 23.9 | ||
| Reducing education and other requirements for new hires | 5.4 | 7.3 | 7.1 | 7.0 |
NOTES: 230 responses. Starting in May '19, "increasing wages" appears as a separate answer choice from "increasing benefits." We will continue to include the share of firms reporting increasing wages and/or benefits but as a calculation based on responses to "increasing wages" and "increasing benefits."
Special Questions Comments
These comments have been edited for publication.
Support Activities for Transportation
- Applicants want high pay but lack the absolute basic core skills and don't bother using correct grammar, punctuation or spelling.
Data Processing, Hosting and Related Services
- Hiring top talent in Dallas–Fort Worth remains tight. Lack of quality applicants is our biggest challenge. We have hired recruiters to help, and they're having trouble finding good quality folks—technical and management.
Credit Intermediation and Related Activities
- For several years, it has been difficult to find reliable front-line employees. Consequently, this group represents our highest turnover. Skilled positions are also hard to fill (lenders, lending assistants, knowledgeable operations).
- The hardest markets to fill are in our rural markets, especially at the officer level.
Real Estate
- We will hire part time in the spring or early summer.
Professional, Scientific and Technical Services
- Less than 1 percent of our workforce is part time or contract.
- I am a sole-practitioner CPA and have no employees. When my clients need help with less-technical matters, I refer them to contract service providers such as bookkeepers and payroll service providers. I have no plans to change that by hiring any paraprofessionals.
Management of Companies and Enterprises
- There are certainly not enough good bankers out there, and there is a lack of women and minorities in the industry. We are having to develop our own through recruitment, training, education and mentoring. This takes time, but if everybody is doing it, we will finally end up with the right mix of good professionals to run our banks in the future.
Administrative and Support Services
- When we hire new personnel, we try to utilize referrals from our own workforce. However, we have used online services to recruit when referrals are not available.
- We are in the contract staffing business, and none of our employees are part time.
Amusement, Gambling and Recreation Industries
- The hidden cost of not being able to hire enough qualified people is that the qualified people we do employ are being asked to work overtime at time-and-a-half [pay], thus increasing our costs. In addition, management personnel are having to work increased hours to either train or fill in the gaps. This is taking a toll on both of the above categories.
Texas Retail Outlook Survey
Data were collected February 11–19, and 50 Texas retailers responded to the surveys.
See data files with a full history of results.
Are you currently trying to hire?
| May. ’19 (percent) |
Aug. ’19 (percent) |
Nov. ’19 (percent) |
Feb. ’20 (percent) |
|
| Yes | 70.0 | 75.5 | 57.4 | 61.2 |
| No | 30.0 | 24.5 | 42.6 | 38.8 |
NOTE: 49 responses.
Are you having problems finding qualified workers when hiring?
| May. ’19 (percent) |
Aug. ’19 (percent) |
Nov. ’19 (percent) |
Feb. ’20 (percent) |
|
| Yes | 88.6 | 78.4 | 88.9 | 86.7 |
| No | 11.4 | 21.6 | 11.1 | 13.3 |
NOTES: 30 responses. This question was posed only to respondents that answered “Yes” to the preceding question.
If you are having problems finding qualified workers, what are the main reasons? Please check all that apply.
| Feb. ’17 (percent) |
Feb. ’18 (percent) |
May ’19 (percent) |
Feb. ’20 (percent) |
|
| Lack of technical competencies (hard skills) | 55.6 | 48.6 | 64.5 | 57.7 |
| Lack of available applicants/no applicants | 46.7 | 56.8 | 61.3 | 53.8 |
| Lack of experience | 37.8 | 35.1 | 29.0 | 50.0 |
| Inability to pass drug test and/or background check | 48.9 | 37.8 | 54.8 | 46.2 |
| Lack of workplace competencies (soft skills) | 46.7 | 40.5 | 35.5 | 34.6 |
| Looking for more pay than is offered | 28.9 | 24.3 | 22.6 | 30.8 |
NOTES: 26 responses. This question was posed only to respondents that answered “Yes” to having problems finding qualified workers.
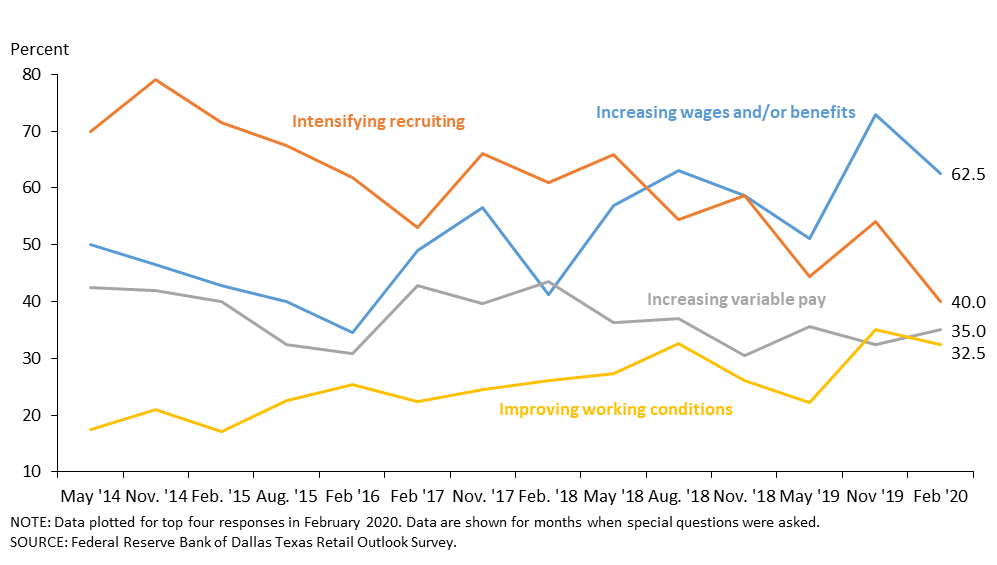
What, if anything, are you doing to recruit and retain employees? Please check all that apply.
| Feb. ’17 (percent) |
Feb. ’18 (percent) |
May ’19 (percent) |
Feb. ’20 (percent) |
|
| Increasing wages and/or benefits | 49.0 | 41.3 | 51.1 | 62.5 |
| Increasing wages | 46.7 | 55.0 | ||
| Intensifying recruiting, including advertising, paying recruiting bonuses, utilizing employment agencies, etc. | 53.1 | 60.9 | 44.4 | 40.0 |
| Increasing variable pay, including bonuses | 42.9 | 43.5 | 35.6 | 35.0 |
| Improving working conditions | 22.4 | 26.1 | 22.2 | 32.5 |
| Offering additional training | 30.6 | 32.6 | 33.3 | 30.0 |
| Increasing benefits | 20.0 | 22.5 | ||
| Reducing education and other requirements for new hires | 6.1 | 10.9 | 8.9 | 10.0 |
NOTES: 40 responses. Starting in May '19, "increasing wages" appears as a separate answer choice from "increasing benefits." We will continue to include the share of firms reporting increasing wages and/or benefits but as a calculation based on responses to "increasing wages" and "increasing benefits."
Special Questions Comments
There were no comments for the Texas Retail Outlook Survey for this release.
Questions regarding the Texas Business Outlook Surveys can be addressed to Emily Kerr at emily.kerr@dal.frb.org.
Sign up for our email alert to be automatically notified as soon as the latest surveys are released on the web.