Panel 5: Migration, Workforce and the Integration of Labor Markets
Canada Presents More Accommodating Approach to Immigration than U.S.
There are similarities between the Canadian and American immigration systems, but there are also important differences. We can look at several ways in which the Trump presidency has had an impact on the Canadian immigration system as well as, of course, on the American immigration system and on the USMCA (United States–Mexico–Canada Agreement). I’m going to argue it (the impact of the USMCA) is not major and won’t be the major cause of change, assuming it is ratified (Chart 1).
Chart 1

The biggest impact in immigration has come from decisions already taken and, typically, American decisions already taken and the uncertainty that’s evident in this process. In Canada, as in the United States, regulating the movement of people into and out of the country is a very complicated process. Part of this is because of the sheer number of people we’re talking about. The other part of the complexity is because of the different types of people we’re talking about. People coming for short-term visits, such as tourists or students; people arriving for short-term work, short-term positions; people coming permanently, moving for a job offer to look for work and family reunification; people coming to join family members already present in the country; or people coming to escape problems in their home country, who on humanitarian grounds can apply for refugee status.
I think for both Canada and the U.S. and indeed for all countries that are net recipients of immigrants, there are a number of core questions. How many people are to be admitted? Where should they come from? Where do they go? What are they being admitted to do? And what are the conditions attached to their entry?
Typically, most of the entry is on short-term visas or sometimes with no visa at all, but a significant percentage of foreign arrivals (are) on different types of permanent visas. Both Canada and the U.S. already have sizable immigrant populations or people born outside of the country (Chart 2).
Chart 2

As we’ve seen, these numbers are set to increase over time. In the U.S., the foreign-born population stands at around 45 million, approximately 13–14 percent of the total population. The absolute number in Canada is a lot smaller, 7.5 million, but it constitutes a much higher percentage of the existing population and it’s somewhere in the range of 22 percent. And that’s again set to increase, as we heard yesterday. On a couple of occasions, immigration growth is going to be critical to overall population growth. It already is particularly in Canada and that, in turn, is going to be central to growth of the labor force.
As for similarities, both countries have a vast number of different visa types and different policies dealing with different categories of migrants. Simplifying, there are three main categories of permanent immigrant: those entering as a family class, family reunification; those entering under an economic class visa of different types; and those arriving as refugees or seeking asylum in the country.
Both countries also have to deal with some movement of people who don’t intend to reside permanently, and some of this category of people is covered by or is connected to the NAFTA (North American Free Trade Agreement). There are various migration categories within NAFTA, and they include the TN visa (for Canadian and Mexican professionals working in the U.S.), NAFTA professionals, intra-company transfers, traders and investors. Some of the key differences between the U.S. and Canada acknowledge that Canada places much more emphasis on the economic class of immigrant compared with the U.S., which has placed the main emphasis on family reunification. This situation has been broadly the case since the 1960s. In the U.S., over 60 percent fall under the family class of immigration, whereas in Canada, it’s almost the direct opposite over the last 30 years—family class is a much smaller category, and the economic class of immigrant is much higher.
Another difference is that Canada uses a point system to select immigrants under the economic class. Applicants receive up to 100 points. Applicants receive points for level of education; their age; their linguistic skills, whether they speak French or English; and whether they have a letter or a job offer already in place in Canada. This kind of merit-based system to some extent is what Donald Trump has been advocating for the U.S. He is certainly, and in much more vehement terms, very critical of the family class and the emphasis of family class of immigration in the U.S.
I think it’s important to note though, that the difference isn’t perhaps as great as it appears on paper. This is because the economic class of immigrants entering Canada also includes their immediate dependents. So, that absolute number is not just the principal applicants but also the family members coming with them. When you start to look at those numbers, the difference isn’t as big.
In 2016, for example, about 44 percent of the applicants coming in under the economic class were the principal applicant. The remaining 56 percent were family members coming with the principal applicant.
I think in the modern (era)—talking about the time period we’re in now particularly—the Canadian government and Canadians are more accepting of immigration and immigrants generally.
Multiculturalism is embedded in the Canadian national identity—and again, this has been for many years now and it crosses the political spectrum—and there’s a continuing openness to the idea of immigration. For example, on the day in January 2017 when Trump signed the first of his attempted immigration bans, (the) travel bans on citizens from mainly Muslim-majority countries, (Canadian Prime Minister) Justin Trudeau tweeted out: “To those fleeing persecution, terror and war, Canadians will welcome you regardless of your faith, diversity is our strength and #WelcomeToCanada.”
Again, just earlier this summer, when Trump was tweeting to four Democratic congresswomen saying they should return to where they came from, Justin Trudeau responded saying, “That’s not how we do things in Canada.” Some of it is moral high ground, but it still reflects Canada’s commitment to openness.
It is significant to know that the Canadian government, the liberal government, currently is planning to increase the amount of immigration and the number of immigrants coming to Canada. You could see the increase, the projected increases across the different categories (Chart 3).
Chart 3
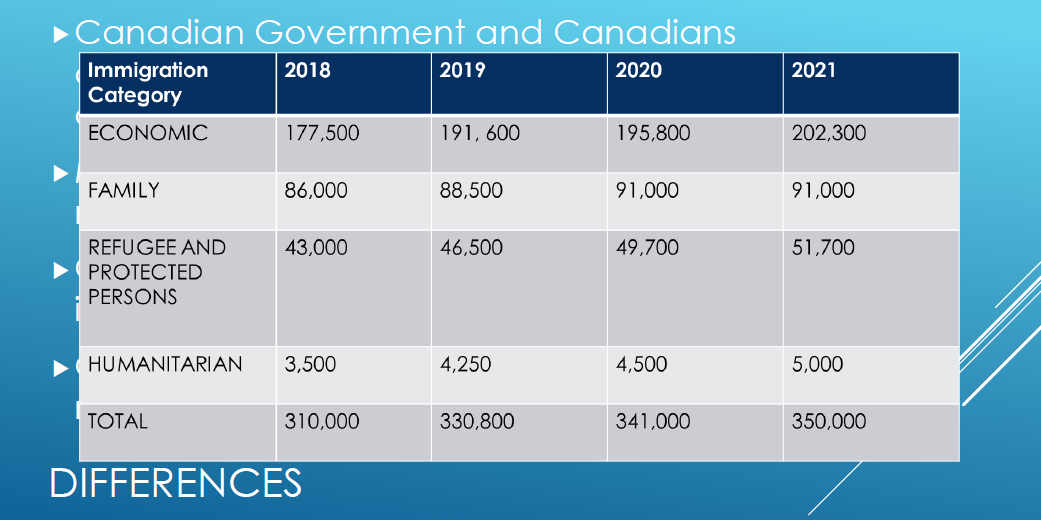
Just yesterday, Trump again suggested that they (U.S. government officials) are going to lower the number of refugees admitted to the U.S. in the next year to 12,000 or 18,000. To put that in context, the Canadian government is suggesting they’re taking 46,500 next year.
Just quickly to note, that while there are differences, I don’t want to overstate these. Public opinion polls in both countries show sort of similar things. Canadians tend to support immigration in principle, but you do see all kinds of different positions when asking about specific types of immigration and practice.
Recent polling suggests a growing number of Canadians are cautious about or argue for a reduction in immigration. We now have the People’s Party of Canada, a populist party created by a former Conservative government minister. When he failed to win the Conservative leadership, he went off in a huff and formed his own political party, the People’s Party, and one of the central planks of this party is to stop, as they call it, mass immigration. However, they only have about 2–3 percent of the public opinion or potential voters.
Probably more serious is Quebec, the French-speaking province. There have been various examples of ambivalence or concern about immigration in that context, the threat that (immigration) might pose to Quebec’s linguistic and political culture and its very existence. (The province of Quebec’s) Bill 9, recently passed, introduced a values test for potential immigrants to Quebec. (The province’s) Bill 21, again a fairly recent legal measure, introduces a ban on religious head scarfs or religious symbols for public servants, police officers and teachers. It actually highlights another key difference between Canada and the U.S., which is the provinces have a much bigger role in the immigration process than I think the states do in the U.S.
Regarding NAFTA, the original idea was to allow highly skilled workers to travel across the border to support the increased trade in goods and services that NAFTA was designed to create. Within that, one of the pieces of the NAFTA agreement, Chapter 16, was to list the professions that were covered. That allowed TN visas (for professionals) to be issued. One of the problems has been, of course, that the list was created in the 1990s and has not really been updated. So, it creates a great deal of ambiguity. Unfortunately, USMCA doesn’t fundamentally change that ambiguity. The wording is slightly changed, but in essence it (terms for TN visas) remains the same. They didn’t revise the professions covered. What that means is that there is a greater role on the part of border guards to assess to what extent applicants meet the requirements to get TN visas at the border checkpoints.
I would argue that the most significant change is not USMCA, but it’s the uncertainty introduced to the movement of people and services across the U.S. border (Chart 4). In the context of the Trump presidency, I think there’s even more license for CBP (U.S. Customs and Border Protection) officers to increase scrutiny of cross-border movement, and my talking with immigration lawyers and business leaders provides some degree of evidence that this is impacting decisions.
Chart 4

There has been an impact in Canada already. This reduction on the annual cap on refugees (admitted into the U.S.) and other measures like the attempt to remove temporary protected status for individuals from selected countries, have been responsible for an increase in asylum claims in Canada. Looking at the year before Trump entered office, (there were) 23,000 to 23,500 such claims, increasing to over 50,000 in 2018.
The safe third country is the kind of agreement that Trump is now trying to impose or to get applied in Central America. There is already a safe third-country agreement in place for Canada and the U.S. Asylum seekers who arrived at the border with the U.S. from Canada are denied that asylum or the right to make that claim; they should have made the claim in Canada as a safe country. Similarly, asylum seekers arriving at the Canadian border from the U.S. are denied entry with the expectation that they should have claimed asylum in the U.S.
There is one loophole in this agreement. The Canada–U.S. agreement in this context only applies to the official ports of entry. Immigrants who arrive between those official points of entry have their asylum claims heard. What we’ve seen in the context of the Trump presidency is an increase in the number of asylum seekers arriving in Canada between official ports of entry. (In the) first year of Trump (being) in office, 20,000-plus such asylum seekers arrived on the Canadian border, compared with 2,000 the year before. This has put huge pressure on the Canadian asylum processing system.
Some positive effects for Canada were mentioned yesterday. More Americans are now seeking to move to Canada, and there are more international students. In 2017, Trump’s first year, the number of international students coming to Canadian universities went up 16 percent. In 2018, it was up 20 percent. In the U.S., the number is down 6 percent.
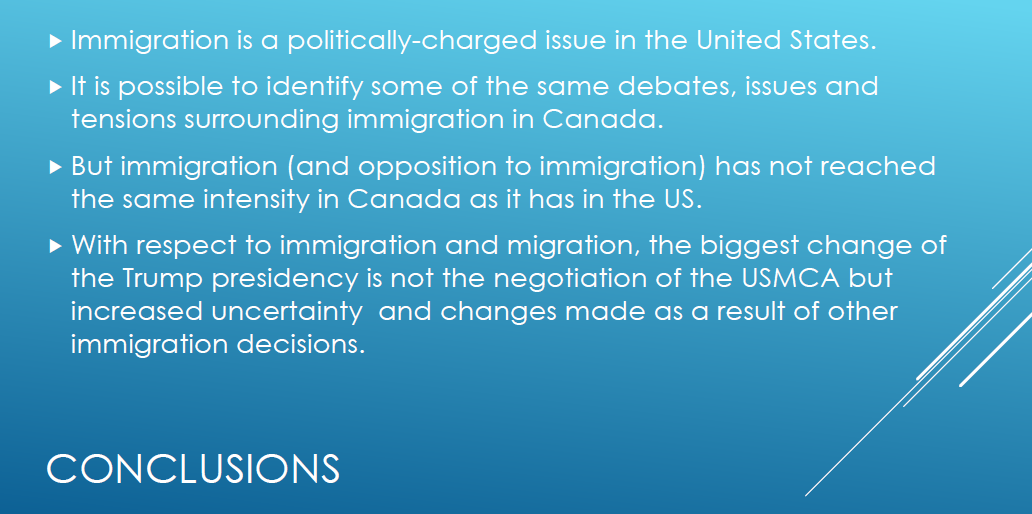
Immigration is a politically charged issue in the U.S. and in Canada (Chart 5). However, the debate about immigration (in Canada) has not reached the intensity observed in the U.S. Finally, as I said before, the biggest change with USMCA is the uncertainty introduced to the decision-making processes regarding immigration policy.
Chart 5