Panel 1: Rules of Origin: U.S. Content of Imports, Supply Chains and Trade Diversion
Reassessing Value-Added Cross-Border Supply Chains
Over the last couple of decades, we’ve witnessed an enormous fragmentation of production both across different countries and across different stages of the supply chain. Whereas, a couple of decades ago, it was true that countries mostly traded final goods, nowadays supply chains cross all over the globe and products cross country borders multiple times before being delivered to consumers.
This really changes how we think about international trade. Such fragmentation of production is particularly prevalent in the NAFTA (North American Free Trade Agreement) region. To illustrate this with one example, let us think about the production of cars, the archetypical good in the NAFTA region.
A couple of decades ago, Ford, General Motors and Chrysler produced their cars almost entirely in plants in places like Michigan. Nowadays, things are very different. When a car is produced in North America, it may still be the case that the engine is produced in Michigan with steel or aluminum smelted in upstate New York. The frame of the car is perhaps built in northern Mexico using steel from Asia, maybe China. The steel frame of the car is shipped to North Texas, where the chassis is added, and we have a more developed body of the car. Then the chassis, the steel frame and the engine are shipped to central Mexico, where huge factories assemble vehicles that can then be sold in the Mexican domestic market (Chart 1). But they can also be shipped to the United States, Canada and other places in the world.
Chart 1
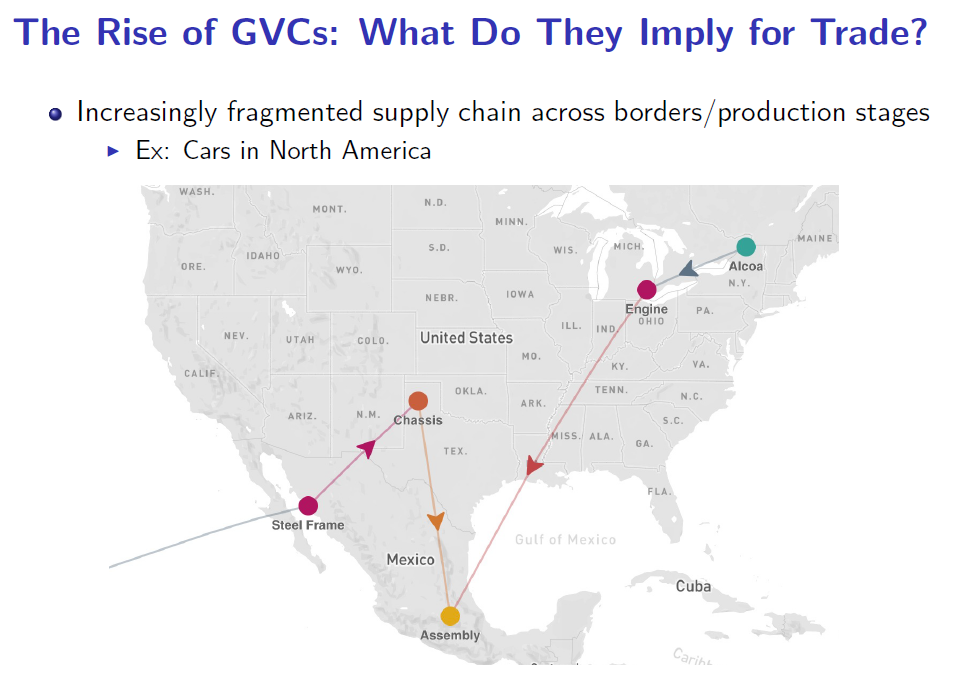
SOURCE: de Gortari Alonso (2019). “Disentangling Global Value Chains,” NBER Working Paper No. 25868.
International trade is much more complicated because you have goods that cross borders multiple times. When Mexico sells these cars assembled in Mexico in the U.S. market, the cars often have a lot of U.S. content even though they are imported from Mexico. Moreover, they have some Mexican content that was already imported upstream in the supply chain and was re-exported back to Mexico and then back into the U.S.
This makes our task as economists very challenging because it means that the data that we've traditionally used to study international trade—that is, bilateral trade flows that tell you how much a country trades with another country—become very hard to interpret because the data only tell you the location from which goods are being shipped. But since goods are crossing borders multiple times before being delivered to final consumers, it's very hard to tell what’s the origin of the value of these goods.
So when making trade policy, policymakers should understand first how trade policy changes could affect the upstream supply chain.
To show you what the measurement challenge is more specifically, let’s think about a very simple supply chain in which the U.S. produces car parts, ships them to Mexico, and Mexico then assembles cars that are sent back to the U.S. and sold to American consumers. This involves back and forth trade because American car parts are making their way back to the U.S. through Mexican car exports.
The reason why we know so little about how much trade actually occurs through the supply chain is because the data that we have, the data that statistical agencies collect, tell you information about bilateral trade. So, what’s bilateral trade? It’s the dollar value of car parts that are shipped to Mexico and used by the Mexican car industry. And it also tells you the dollar value of Mexican cars that are shipped to the United States and sold to American consumers.
But the data don’t tell you the supply chain linkage indicating how American car parts are put into the cars that Mexico ships back. The data point that would tell something about integration in the NAFTA region is exactly what’s missing in the data. The reason why it’s so hard to impute this or figure it out is because Mexico also ships cars to other locations, such as Germany.
The current approach is to assume that at the industry level in a given country, everything is produced in the exact same way. For example, assume that of all the car parts that Mexico buys, 40 percent come from the U.S. Well, if 40 percent of all car parts in Mexico come from the U.S, and if every single Mexican car is produced the same way, that means that every time Mexico ships a car to consumers in the U.S. that car is going to have 40 percent American car parts. Every time Mexico sells cars to Germany, those cars all have 40 percent American parts.
What really takes place in North American auto manufacturing production is that even though Ford and Volkswagen may both be assembling their cars in Mexico, they have extremely different supply chains.
What may be happening is that Ford is using Mexico to assemble cars that are then shipped and sold in the U.S.; Volkswagen is also assembling cars in Mexico but is shipping them to consumers in Germany. Ford has a supply chain such that all of the car parts come from the U.S. But Volkswagen has a different supply chain. It makes its car parts in Europe, in China or somewhere else. When Mexico exports cars to the U.S., those cars embody a huge amount of American car parts. It is much more than we would get using the previous set of assumptions in which we presume that the share of American content in Mexican exports to the U.S. is watered down because we are putting a whole bunch of them into Mexico’s exports to other locations besides the U.S. (Chart 2).
Chart 2
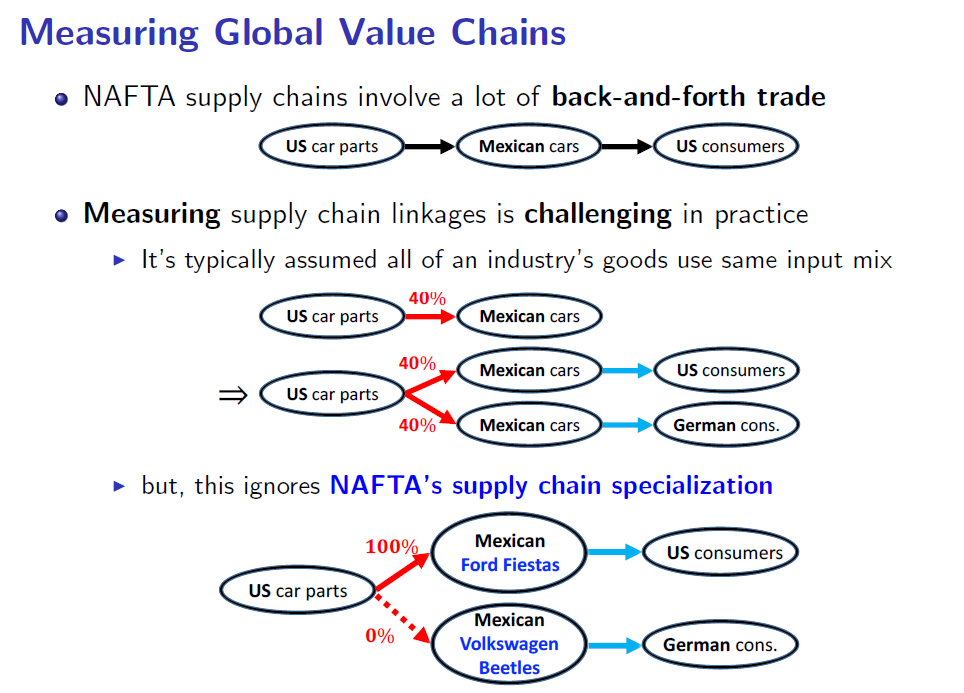
SOURCE: de Gortari Alonso (2019). “Disentangling Global Value Chains,” NBER Working Paper No. 25868.
Looking at customs-level data allows a better estimation of supply chain specialization. Customs data record all imports and exports at the shipment level for any country in the world. It thus allows calculation of the type of imported components carmakers use in their production processes for exports to various regions. For example, you can use that data to figure out what car components Ford uses when producing in Mexico for the U.S. market versus what import components Volkswagen uses when exporting to the German market. It is possible then to look across all car manufacturing firms in Mexico and get a sense of what type of imports are used in different supply chains when exporting to various markets.
Chart 3 confirms NAFTA supply chain integration. When Mexico exports cars to the U.S., these cars tend to have an enormous amount of American car parts. If the assumption that economists typically make to measure supply chains were accurate, we would expect to see the exact same type of input share when Mexico sells cars to other locations. However, customs data show that when Mexico exports cars to Germany, it uses very different car parts suppliers. The companies that are exporting cars from Mexico to Germany have very different supply chains. Therefore, when Mexico exports cars to Germany, these cars have much fewer American car parts. Instead of having 74 percent of foreign inputs coming from the U.S., it’s only 18 percent—the remainder are from Japanese, German and Polish companies.
Chart 3
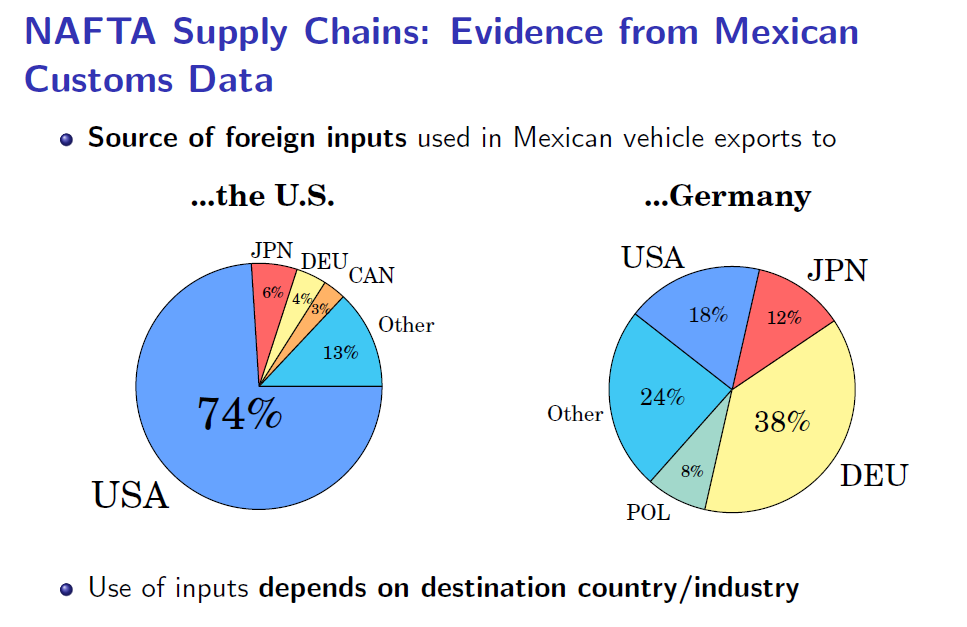
SOURCE: de Gortari Alonso (2019). “Disentangling Global Value Chains,” NBER Working Paper No. 25868.
The U.S. value-added content of Mexican exports to the U.S. is higher when looking at customs data than when using the conventional method previously discussed. Chart 4 shows the share of U.S. value added in Mexican imports. U.S. value-added content in Mexican imports is larger in the majority of the sectors shown when using specific customs data instead of assuming heterogeneity in the use of inputs.
Chart 4
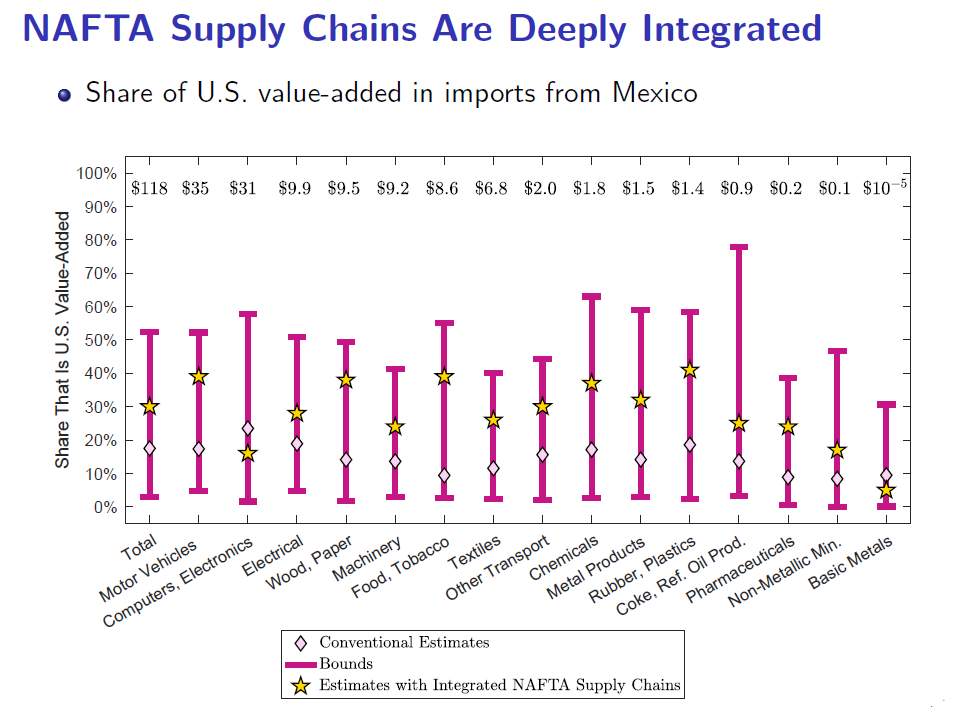
SOURCE: de Gortari Alonso (2019). “Disentangling Global Value Chains,” NBER Working Paper No. 25868.
In 2014, Mexico exported to the U.S. about $120 billion in goods. According to the conventional estimate, only about 17 percent, or 17 cents of every dollar imported, were produced upstream in the U.S. For cars, it was close to 18 percent. However, according to customs data that take into consideration the specialization of supply chains, U.S. value added is considerably larger.
It’s more sensible to think that when Mexico exports manufactured goods to the U.S., it’s not 17 cents of every dollar that are produced in the U.S., but it’s closer to 30 cents. When you look at cars, the difference is even bigger. Instead of being close to 18 percent of every dollar exported to the U.S., the American content is closer to 40 percent. These numbers are much closer to all the anecdotal evidence we have on NAFTA telling us that Mexican–American supply chains are very deeply integrated and that a lot of the value of the Mexican exports shipped to the U.S. is actually American content that was produced upstream in the supply chain.
Once you measure things more accurately using more and better data than we were using before, it turns out that NAFTA economies are much more integrated than we thought. In particular, there is an enormous amount of American content in Mexican exports going to the U.S.
What are the policy implications? The fact that there is very deep integration means that if the U.S. were to put high tariffs on Mexican final good exports, it’s probably going to hurt Mexican exports. But if American suppliers are producing a lot of the value that's put into these exports, that sort of change in trade policy is going to ripple up the supply chain, and it’s going to hurt the suppliers located in the U.S. When trying to design trade policy with some given objective, you really should think about how supply chains are allocated in reality in order to try to gauge the implications of those changes in trade policy.