Texas Economic Indicators

The Texas economy continued to expand at a solid pace in May. The state posted strong job gains, and unemployment remained low. The headline indexes of the Dallas Fed’s Texas Business Outlook Surveys indicated accelerating growth. The state’s oil production continued to rise in March, and exports and existing-home sales rose in April.
Labor Market
Employment Growth Robust
Texas employment grew at a brisk 3.2 percent annualized rate in May, after April’s steep 4.1 percent growth (Chart 1). Year to date, Texas jobs have expanded 3.6 percent. The Dallas Fed’s Texas Employment Forecast suggests 3.3 percent job growth in 2018 (December/December).
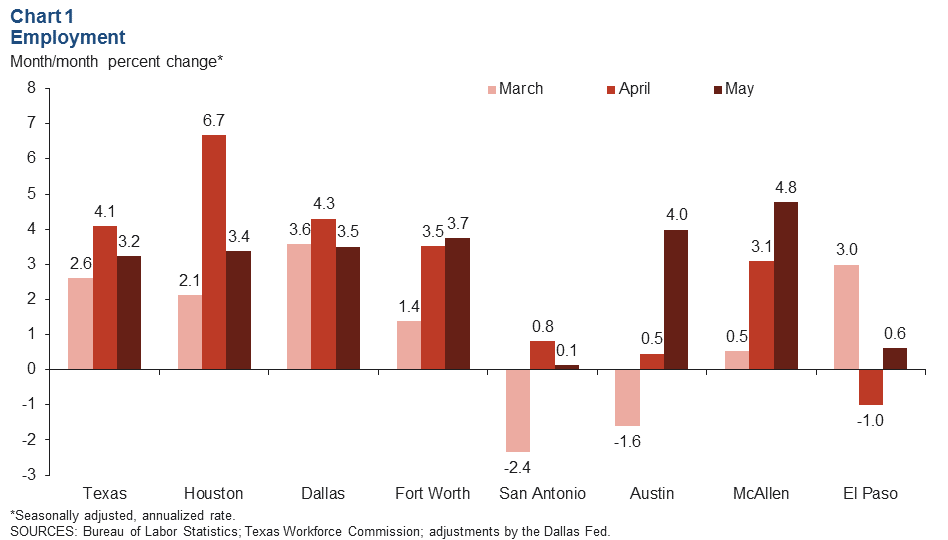
Payrolls expanded in all major metros in May. Jobs in McAllen surged 4.8 percent in the month, the strongest increase among the major metros, while San Antonio posted the slowest growth. Employment in all major metros has expanded this year through May, led by Houston’s 4.4 percent growth.
All large sectors except information added jobs in May. Payrolls in the energy sector soared 11.9 percent following 27.8 percent growth in April. Year to date, the energy sector has grown the fastest at 20.5 percent, followed by construction at 7.3 percent. The information sector shed 1.4 percent of its jobs this year through May, while employment expanded in all other sectors.
Unemployment Remains Near Historic Low
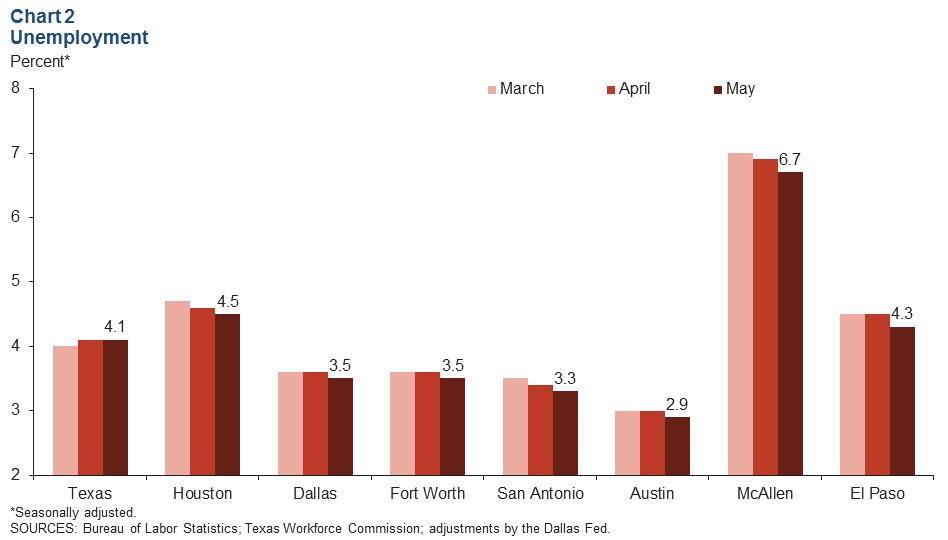
The Texas unemployment rate held steady at 4.1 percent in May, near the four-decade low of 3.9 it reached in late 2017 (Chart 2). Unemployment ticked down in all of the major metros in May and was well below its postrecession average as well.
Texas Business Outlook Surveys
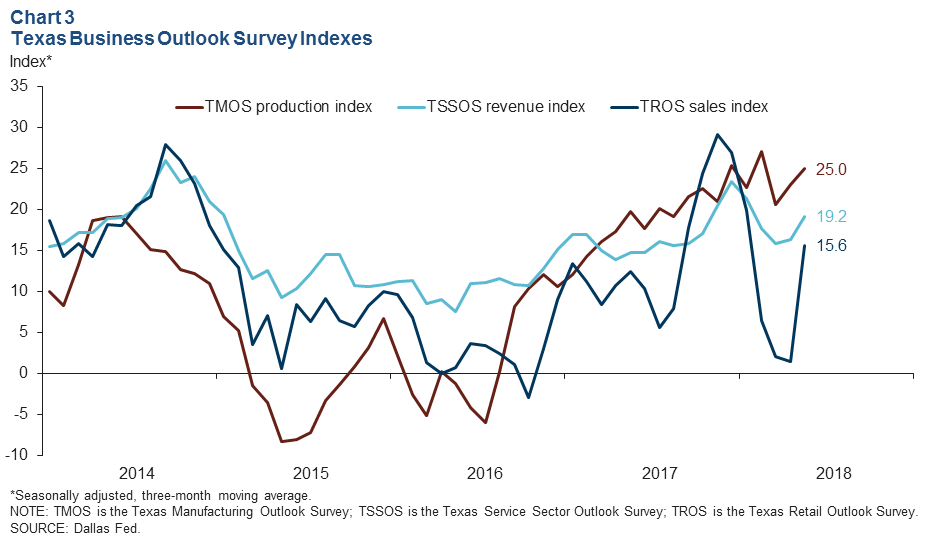
The headline indexes of the Dallas Fed’s Texas Business Outlook Surveys indicated strengthening expansion in the manufacturing and service sectors in May (Chart 3). The Texas Manufacturing Outlook Survey (TMOS) production index surged to a 12-year high of 35.2 in the month, and its three-month moving average advanced to 25.0. The Texas Service Sector Outlook Survey (TSSOS) revenue index and the Texas Retail Outlook Survey (TROS) sales index also rose sharply. All three indexes were above their 2017 averages.
Energy Sector Activity
Texas daily crude oil production, representing 39.8 percent of all U.S. production, increased 4.0 percent in March to 4.2 million barrels per day (Chart 4). Texas’ average daily production this year through March was 22.7 percent above its average production during the same period last year. In March, the state’s daily oil production posted its highest level in the history of the series, which dates back to January 1981.
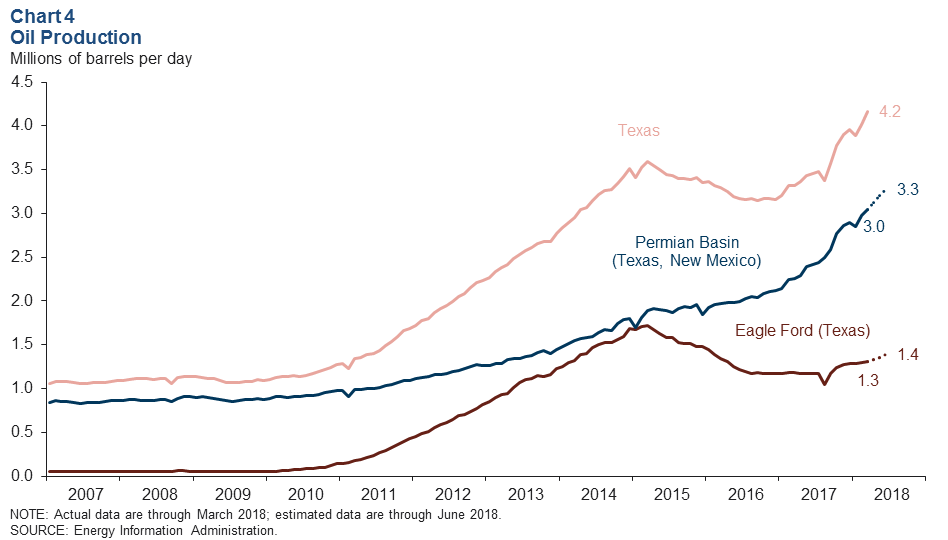
Daily oil production in the Permian Basin, representing 29.1 percent of U.S. production, was 3.0 million barrels per day in March, and the Energy Information Administration (EIA) estimates that production will reach 3.3 million barrels per day in June. The Permian Basin’s average daily production this year through March was 33.5 percent higher than average production during the same period last year.
Daily production in the Eagle Ford, representing 12.5 percent of U.S. oil production, was 1.3 million barrels per day in March, and the EIA estimates that production will reach 1.4 million barrels per day in June. The Eagle Ford’s average daily production this year through March was 9.9 percent above average production during the same period last year.
Exports
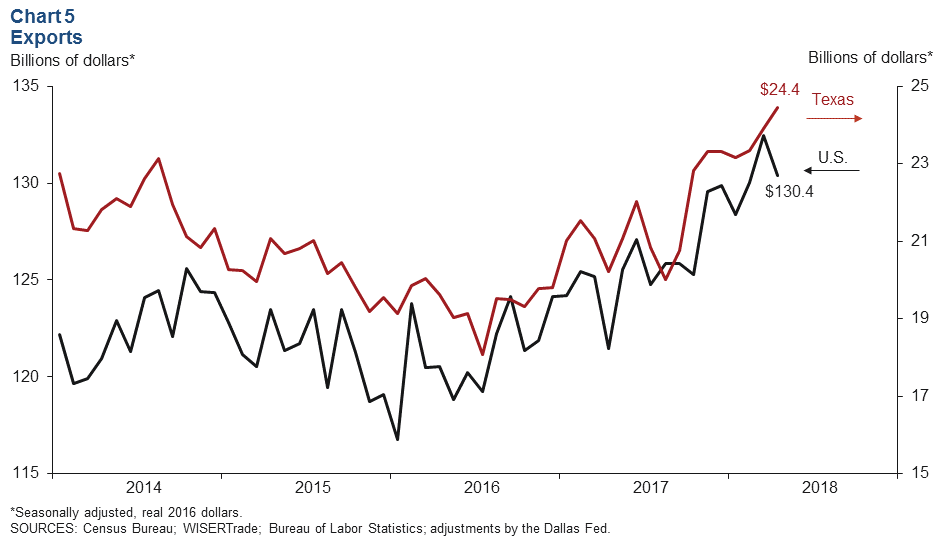
Texas exports climbed 2.2 percent in April, while U.S. exports dropped 1.6 percent (Chart 5). This year through April, exports are up 13.2 percent for Texas and 5.0 percent for the U.S. compared with the same period in 2017.
Housing Market
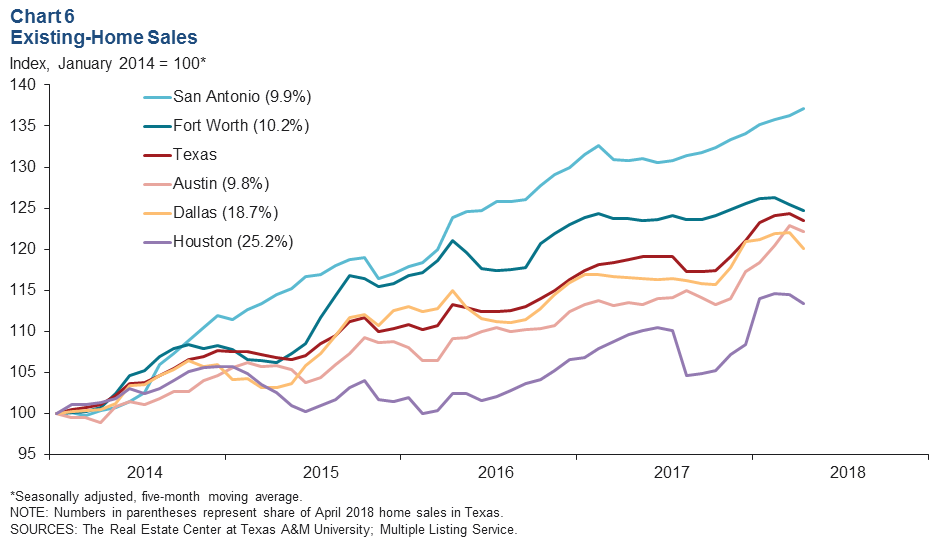
Texas’ existing-home sales grew 1.1 percent in April, but the five-month moving average inched down 0.7 percent in the month (Chart 6). The five-month moving averages of existing-home sales edged down in Austin, Dallas, Fort Worth and Houston as well but ticked up in San Antonio. This year through April, existing-home sales climbed 2.8 percent in Texas; they expanded in Austin, San Antonio, Houston and Dallas but dipped in Fort Worth compared with the same period in 2017.
The inflation-adjusted median home sales price in Texas slipped 1.5 percent in April but remains up 1.0 percent year over year. Home inventories in the state were stable at 3.4 months, remaining well below the six months of supply considered balanced. Building permits for single-family housing inched up 0.8 percent in the month, and housing starts, which include multifamily construction, soared 21.9 percent.
NOTE: Data may not match previously published numbers due to revisions.
About Texas Economic Indicators
Questions can be addressed to Stephanie Gullo at stephanie.gullo@dal.frb.org. Texas Economic Indicators is published every month on the Monday after Texas employment data are released.