Southern New Mexico Economic Indicators

Fourth Quarter 2024
| Las Cruces economy dashboard, December 2024 | |||
| Job growth (annualized) Sept.–Dec. '24 |
Unemployment rate |
Avg. hourly earnings |
Avg. hourly earnings y/y |
| 2.0% | 5.0% | $25.08 | -4.4% |
Economic indicators were mixed in Las Cruces in fourth quarter 2024 after a slow third quarter. Employment grew solidly; however, unemployment rose. Average hourly earnings slid further, continuing a pattern seen since early 2023. Crude oil production leveled off in the fourth quarter, and the rig count was up year over year. Import-export activity through the Santa Teresa port declined from its late-summer highs.
Labor market
Las Cruces payrolls expand
Payrolls in Las Cruces expanded an annualized 2.0 percent in the fourth quarter (Chart 1). Manufacturing, construction and mining, financial activities, and education and health sectors all posted strong growth. However, three-month job growth can be volatile.
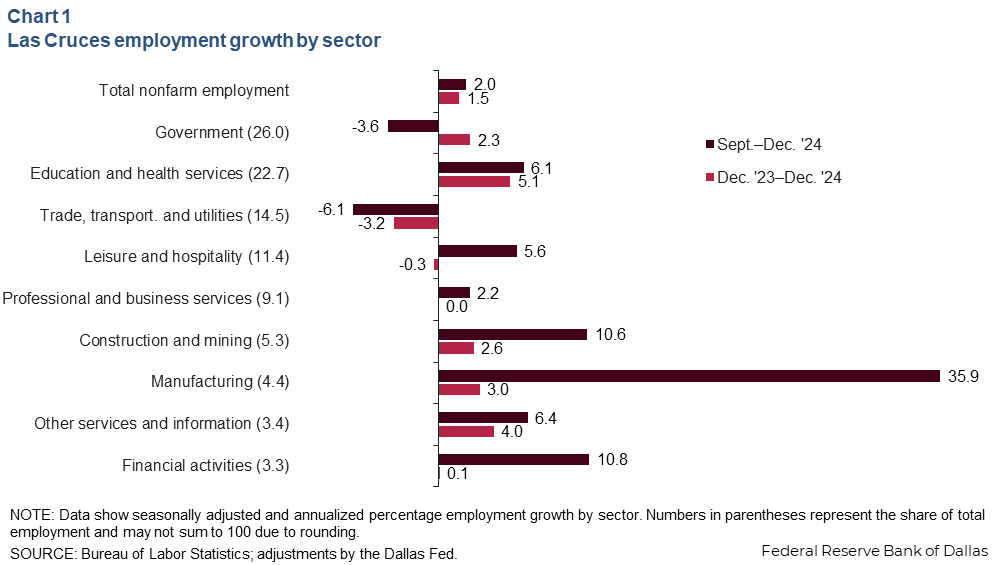
In 2024, Las Cruces grew solidly, with employment rising 1.5 percent (1,200 jobs). Education and health services increased the fastest over the past year, with 5.1 percent job growth. Payrolls in trade, transportation and utilities declined, and leisure and hospitality growth was anemic. Both are sizable sectors of Las Cruces’ labor market and weighed on the metro’s overall performance. Trade, transportation and utilities payrolls declined 3.2 percent (-391 jobs), while employment in leisure and hospitality was flat at -0.3 percent (-27 jobs). Other sectors such as government, education and health, construction and mining, manufacturing and other services and information all posted robust job growth.
Unemployment edges up
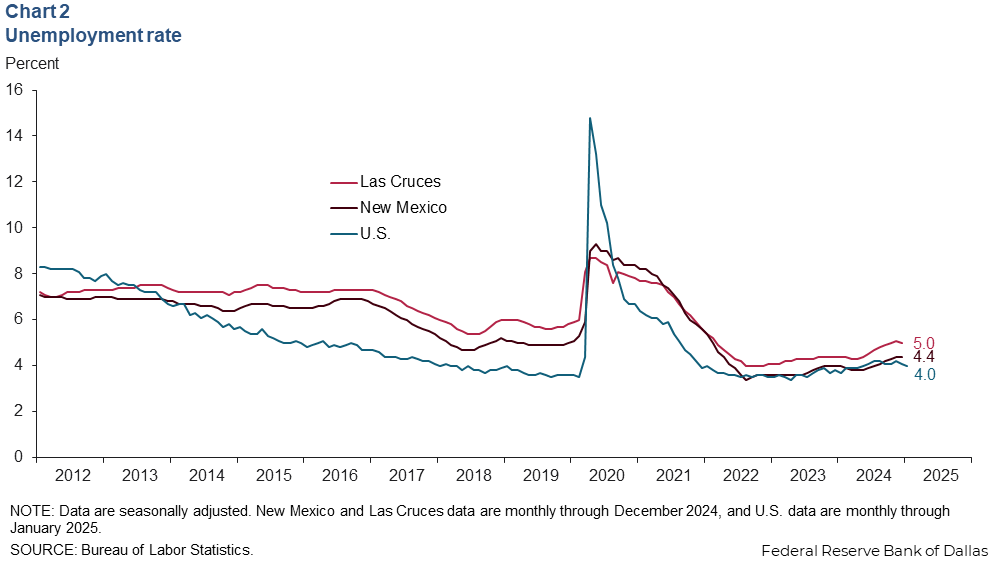
The unemployment rate in Las Cruces was 5.0 percent in December, up from 4.9 percent in September (Chart 2). New Mexico’s jobless rate rose to 4.4 percent in December from 4.2 percent in September. While the state and metro’s unemployment rates have been ticking up, national unemployment was relatively stable in the second half of 2024. U.S. unemployment of 4.0 percent in January 2025 was unchanged from May 2024.
Earnings continue to slide in the metro
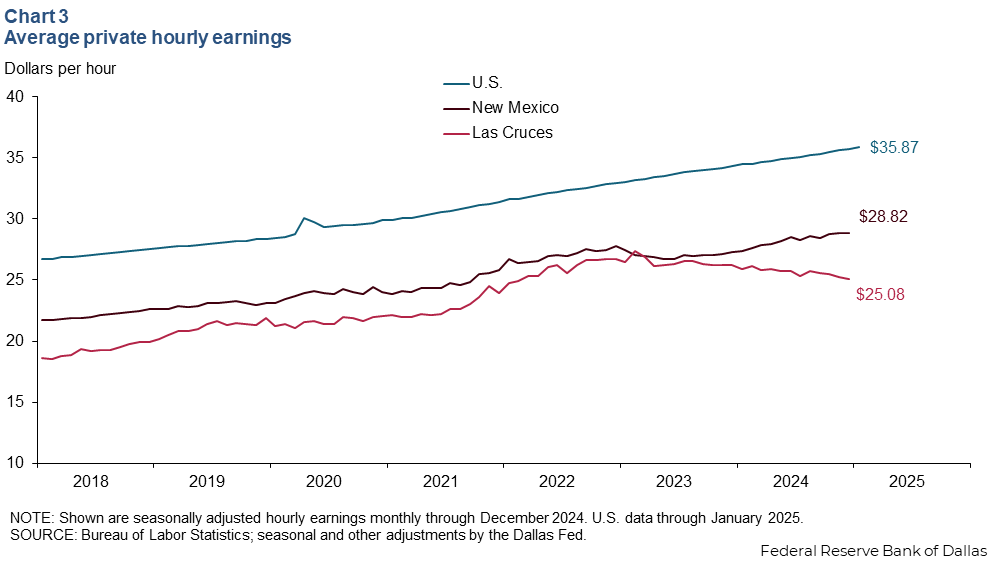
Average private hourly earnings in Las Cruces continued to tick down, to $25.08 in December, sliding from $25.56 in September (Chart 3). Year over year in December, hourly earnings fell 4.4 percent. Statewide earnings edged up to $28.82 in December from $28.46 in September. Earnings in New Mexico were up 5.7 percent year over year. U.S. hourly earnings of $35.70 exceeded those of both New Mexico and Las Cruces in December; however, year-over-year gains of 4.1 percent were slower than the state’s growth. U.S. earnings ticked up further in January to $35.87.
Energy production
Production of crude oil in New Mexico was 2.06 million barrels per day (mb/d) in November 2024 (Chart 4). This is slightly lower than August’s 2.09 mb/d production. The state has been experiencing rapid growth in oil and natural gas production since early 2021 as drillers tap into the extremely productive Delaware Basin in the southeast corner of the state. In November 2023, the state produced 1.89 mb/d of crude oil.
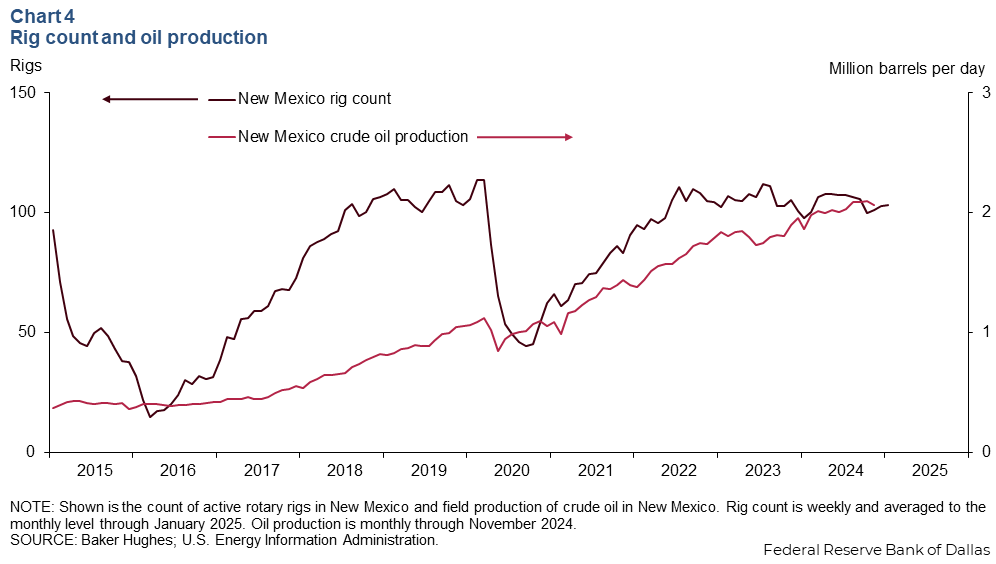
The average monthly rig count in New Mexico in January was 103. This is a slight increase from 98 active rigs in January 2024 but is unchanged from December. Recent improvements in oilfield efficiency have allowed energy production to expand without increasing the number of rigs.
International trade
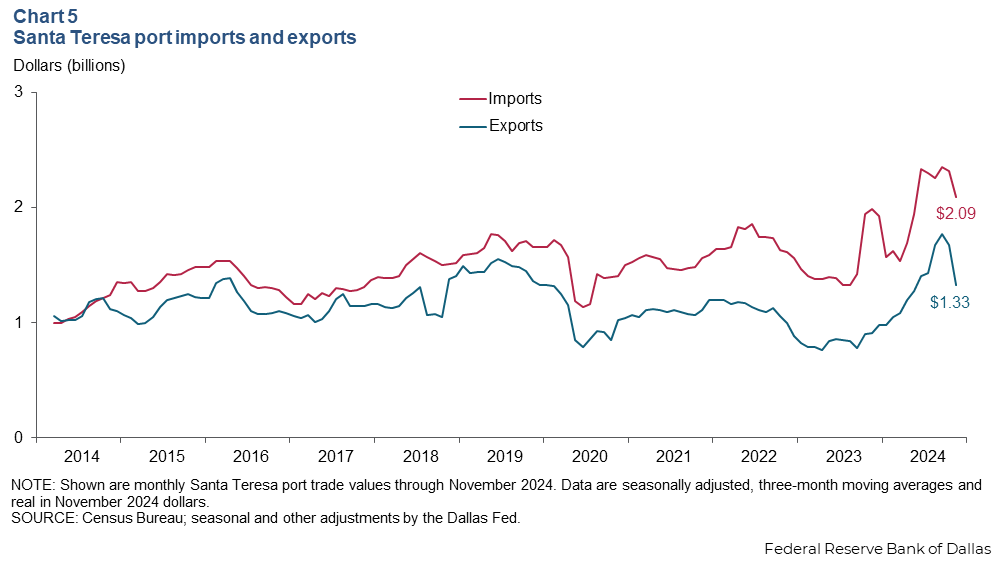
The real value of total trade passing through the Santa Teresa Port of Entry declined in November 2024. The three-month moving average of total exports dropped to $1.33 billion in November from $1.68 billion in October (Chart 5). Imports similarly declined, to $2.09 billion from $2.32 billion.
NOTES: Data may not match previously published numbers due to revisions. All New Mexico counties within the Federal Reserve’s Eleventh District are counted as part of southern New Mexico.
About Southern New Mexico Economic Indicators
Questions or suggestions can be addressed to Robert Leigh at Robert.Leigh@dal.frb.org. Southern New Mexico Economic Indicators is released quarterly.