San Antonio Economic Indicators

| San Antonio economy dashboard (December 2024) | |||
| Job growth (annualized) Sept.–Dec. '24 |
Unemployment rate |
Avg. hourly earnings |
Avg. hourly earnings growth y/y |
| 1.7% | 3.7% | $30.88 | 7.5% |
San Antonio payrolls and wages grew in December. Retail sales tax revenue ticked up, and unemployment ticked down. The supply of existing homes stayed stable as home prices rose.
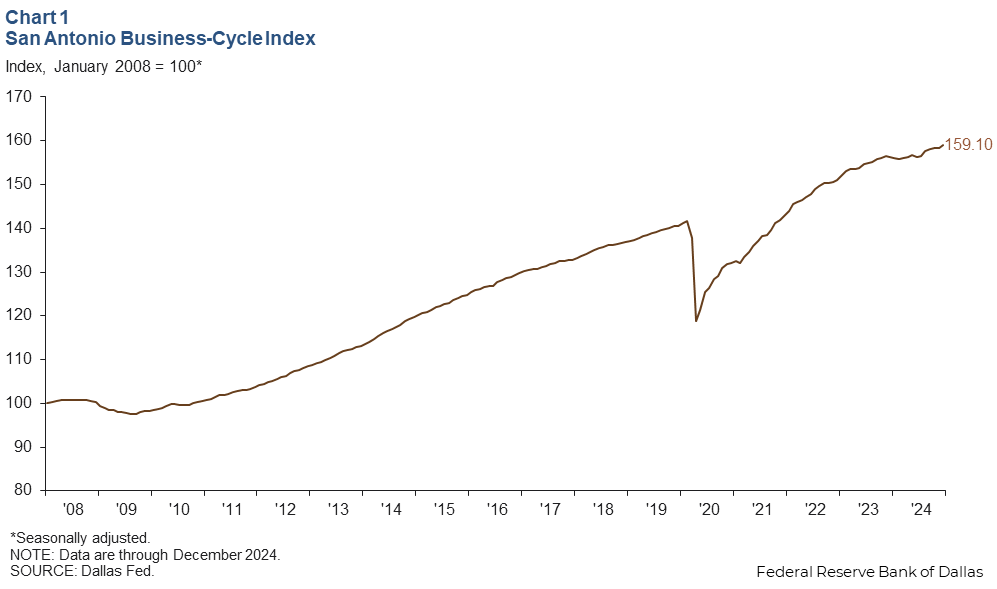
Business-cycle index
The San Antonio Business-Cycle Index, a gauge of economic conditions in the metro area, increased an annualized 5.5 percent in December (Chart 1).
Labor market
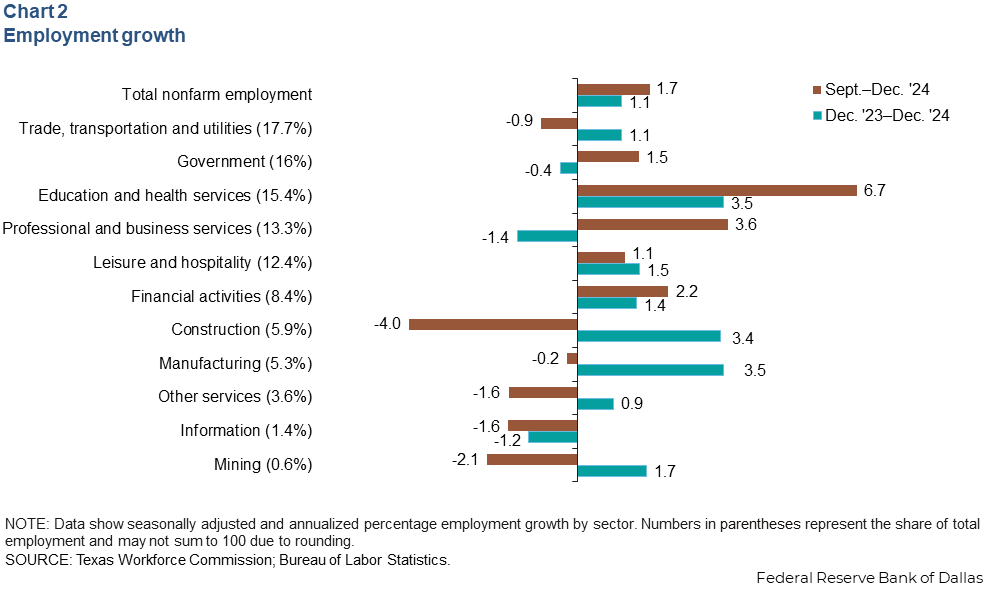
Employment growth continues
San Antonio payrolls rose in December, growing an annualized 2.9 percent (2,800 jobs). September through December, payrolls grew 1.7 percent (5,100 jobs), led by gains in education and health services (6.7 percent, or 3,000 jobs), professional and business services (3.6 percent, or 1,400 jobs), and government (1.5 percent, or 700 jobs) (Chart 2). The construction, manufacturing, information, mining, trade, transportation and utilities, and other services sectors lost jobs. Year over year, total nonfarm employment growth in San Antonio was 1.1 percent, slower than gains in Texas (1.7 percent) and the U.S. (1.4 percent).
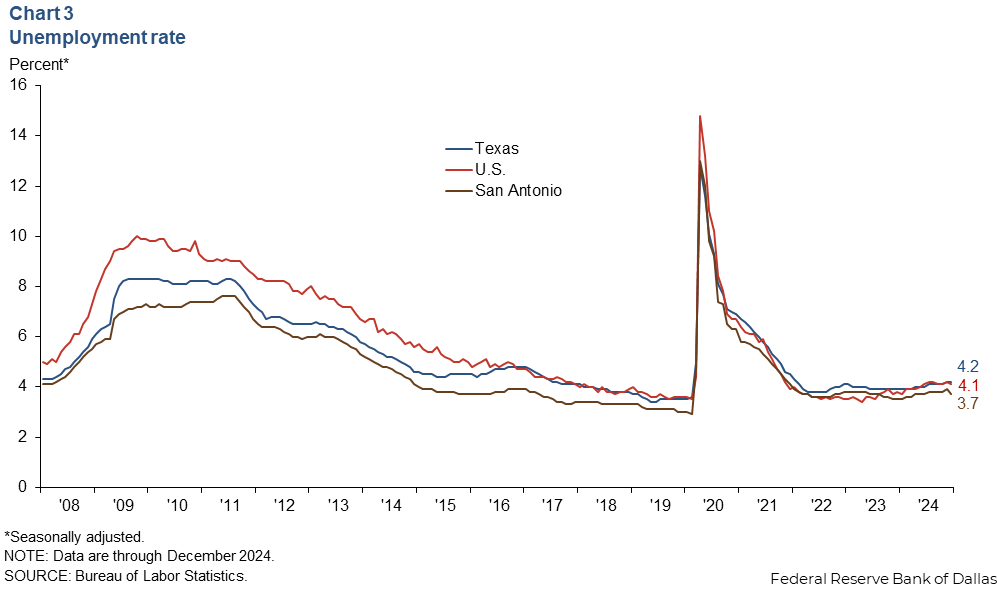
Unemployment rate ticks down
The San Antonio unemployment rate fell to 3.7 percent in December (Chart 3). The jobless rate in Texas remained at 4.2 percent, and the U.S. rate ticked down to 4.1 percent.
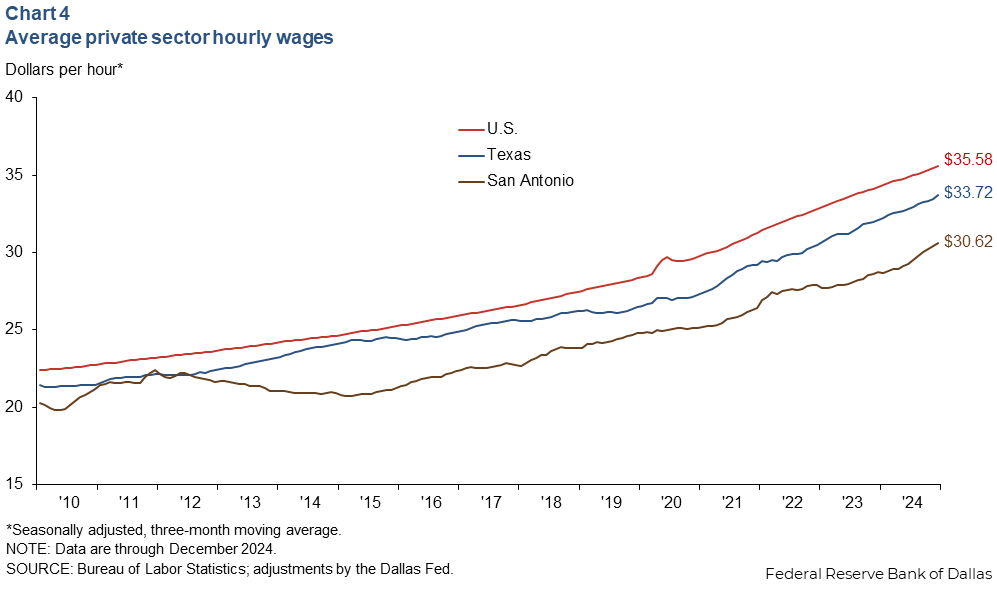
Wages rise
The average hourly wage in San Antonio rose to $30.88 in December from November’s $30.67. The three-month moving average of San Antonio wages grew an annualized 9.3 percent in December, while Texas smoothed wages rose 9.2 percent, and U.S. smoothed wages were up 4.1 percent. Smoothed hourly wages in San Antonio were $30.62, below both the state and national averages (Chart 4). Year over year, wages in San Antonio rose 6.6 percent—greater than the increases in Texas (5.1 percent) and the U.S. (4.0 percent).
Consumer spending
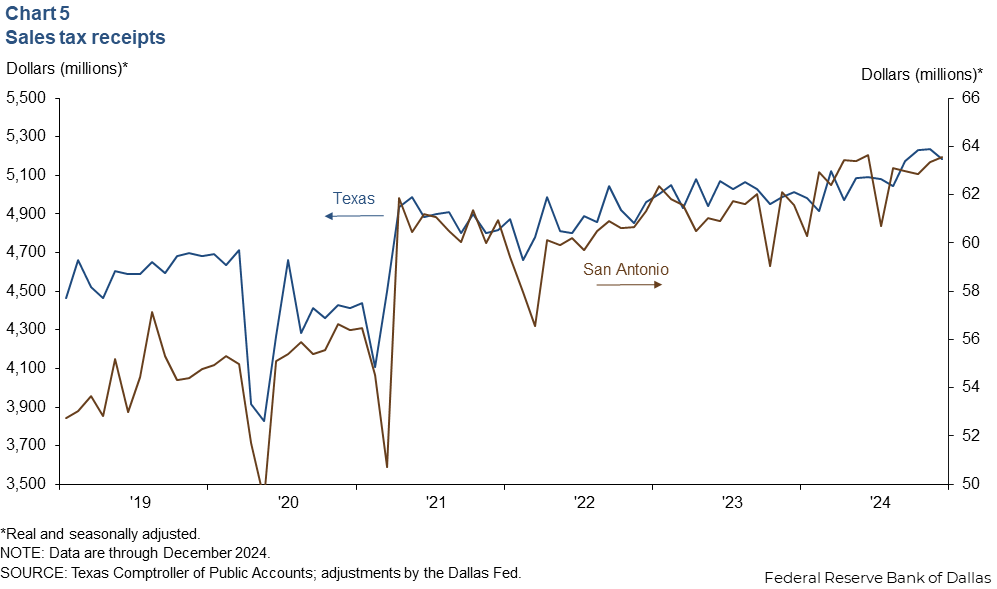
Sales tax receipts are a proxy for consumer spending patterns. San Antonio sales tax revenue, adjusted for inflation, rose 0.3 percent in December, and Texas sales tax revenue decreased 1.0 percent (Chart 5). Year over year, San Antonio sales tax revenue increased 3.2 percent , while the state’s sales tax revenue rose 3.4 percent.
Housing
The supply of existing homes held steady at 4.7 months in December, slightly greater than the state’s 4.5 months of supply (Chart 6). Since October 2012, inventories have remained below six months, which is generally considered a balanced housing market.
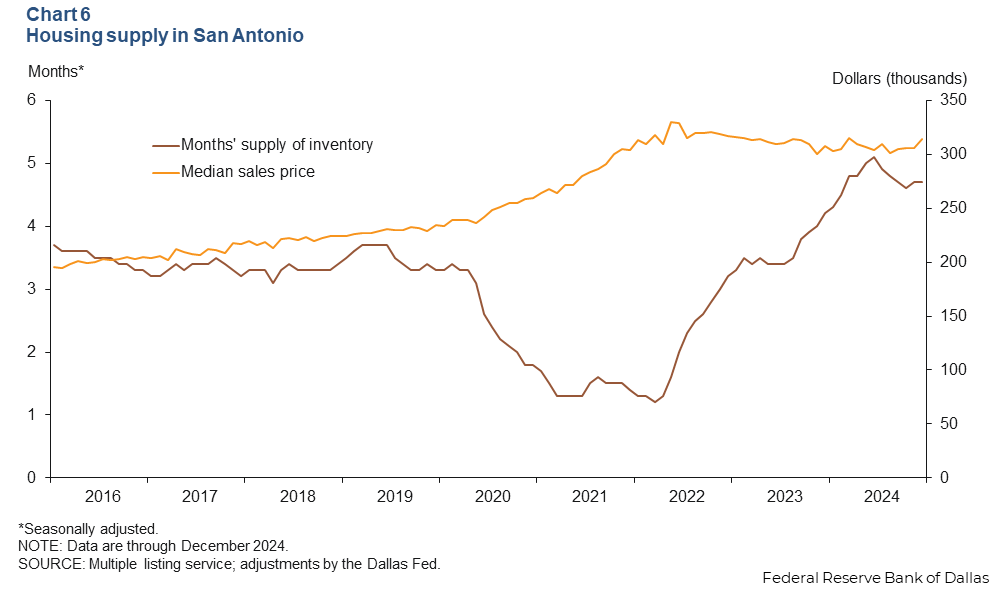
Median home prices rose 2.6 percent in December and were up 1.8 percent year over year. Meanwhile, home prices in Texas rose 0.6 percent in December and were up 1.4 percent year over year.
NOTE: Data may not match previously published numbers due to revisions.
About San Antonio Economic Indicators
Questions or suggestions can be addressed to Ethan Dixon at Ethan.Dixon@dal.frb.org. San Antonio Economic Indicators is published every month during the week after state and metro employment data are released.