Houston Economic Indicators

| Houston economy dashboard (February 2025) | |||||
| Job growth (annualized) Nov. '24–Feb. '25 |
Unemployment rate |
Avg. hourly earnings | Avg. hourly earnings growth y/y |
||
| 2.1% | 4.2% | $36.30 | 5.1% | ||
Houston’s labor market expanded at a moderate pace over the three months ending in February 2025, and the unemployment rate remained flat from January to February. Recent revisions to employment data from 2024 show the metro area added fewer jobs last year than previously estimated. The Houston Leading Index and Houston Purchasing Manager’s index in February 2025 suggest the local economy will grow at a slower pace over the next three to nine months compared to the prior three months. Surveys of local, state and national businesses showed a sharp uptick in input prices in February 2025.
Labor market
Job growth strong across sectors
Houston’s job growth for the three months ending in February 2025 of 2.1 percent (18,035 jobs) was above its long-run trend growth (Chart 1). Above average monthly growth in December (2.1 percent annualized) and January (5.2) was tempered by weakness in February (-0.9). On average, job growth was strong across most subsectors the past three months. Trade, transportation and utilities grew the fastest at 3.7 percent (6,417 jobs) from November 2024 through February 2025. These gains were partially offset by declines in manufacturing and construction. Manufacturing contracted an annualized 1.2 percent (-699) in February while construction declined 0.9 percent annualized (-554). Professional and business services remained flat at -0.1 percent annualized (-187).
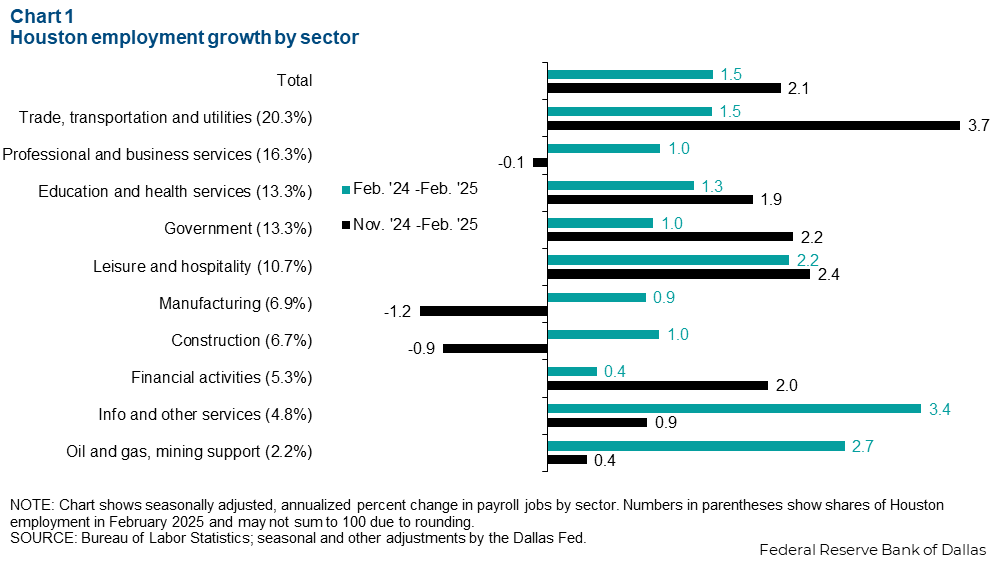
Year over year, jobs grew 1.5 percent (50,953 jobs) in February 2025 compared with one year ago. All subsectors experienced growth in this period, but information and other services was the fastest at 3.4 percent annualized growth (5,413). Trade, transportation and utilities expanded payrolls the most, hiring 10,279 more Houstonians from February 2024 to February 2025. While no sector saw a contraction over this period, financial activities came in the slowest at 0.4 percent growth (808 jobs).
Benchmark revisions push down Houston’s employment
Houston’s job growth in 2024 was weaker than initially estimated. The latest annual revision to employment data by the Bureau of Labor Statistics (BLS) showed 12-month growth in November 2024 of 1.3 percent compared to an initially estimated 1.8 percent. This translates to an overestimation of job growth by 17,600, bringing the metro area’s total 12-month employment growth in November 2024 to 45,200 total jobs (Chart 2).

While the BLS benchmarks its data annually with the release of January employment data, the Dallas Fed benchmarks employment data quarterly. The Dallas Fed’s estimation of Houston’s job growth from November 2023 to November 2024 came in at 1.5 percent. For job growth through February 2025, early benchmarked Dallas Fed data show Houston growing 1.5 percent versus the BLS payroll job series showing 1.3 percent.
Purchasing Manager's Index
Purchasing Manager’s Index and metro leading index tick down
The Houston Purchasing Manager’s Index (HPMI) declined from 52.1 in January 2025 to 50.0 in February as a smaller share of respondents reported expanding economic conditions (Chart 3). Index values above 50 generally indicate growth in the regional economy while those below 50 indicate contraction. The index dipped below 50 in September and October 2024 but resumed growing in the fourth quarter of 2024.

The subcomponents of the HPMI showed contraction in employment, lead times and finished goods inventories. Growth in sales dipped but remained above 50. Sharp upticks in input prices and purchased inventories reflect growing impacts from trade policies as higher prices hit the local economy and some sellers try to stock up.
The Houston Leading Index (HLI) decelerated over the three months ending in March to 0.3 percent from 1.3 percent in the three months ending in December. Declines in stock values, homebuilding permits and home sales contributed most to the deceleration in the HLI. The index was bolstered by West Texas Intermediate oil prices and growth in new orders.
Taken together, the downtick in the HLI and HPMI suggest economic activity over the next three to nine months will be slower compared with the past three months.
Purchasing manager surveys show sharp uptick in input prices
The diffusion index for input prices paid in Houston sharply accelerated from 8 in December 2024 to 31 in February 2025 (Chart 4). Diffusion indices for input prices in Texas and the U.S. similarly increased. The national manufacturing prices paid index increased from 4.9 in December 2024 to 38.7 in March 2025. The Texas Manufacturing Outlook Survey prices paid index increased from 6.9 in December 2024 to 44.6 in March 2025.

NOTE: Data may not match previously published numbers due to revisions.
About Houston Economic Indicators
Questions or suggestions can be addressed to Robert Leigh at robert.leigh@dal.frb.org. Houston Economic Indicators is posted on the second Monday after monthly Houston-area employment data are released.