Houston Economic Indicators

| Houston economy dashboard (December 2024) | |||||
| Job growth (annualized) Sept.–Dec. '24 |
Unemployment rate |
Avg. hourly earnings | Avg. hourly earnings growth y/y |
||
| 0.9% | 4.2% | $35.48 | 2.1% | ||
Houston’s labor market ended 2024 with below-trend job growth year over year. However, the unemployment rate fell from 4.6 in November 2024 to 4.2 percent in December 2024. Houston’s energy industry continues to show strength. Texas oil production increased in October while retail fuel prices ticked up slightly at the beginning of 2025. Activity through the port of Houston grew in November thanks mainly to increased oil and gas exports.
Labor market
Job growth weakened in late 2024
Over the three months ending December 2024, employment in Houston grew just 0.9 percent on an annualized basis (7,904 jobs), as Houston’s largest employment sectors logged either anemic gains or modest losses (Chart 1). From September to December 2024, trade, transportation and utilities grew just 0.5 percent annualized (920 jobs) while professional and business services contracted 0.4 percent annualized and education and health services contracted 0.2 percent annualized (-693 jobs combined).
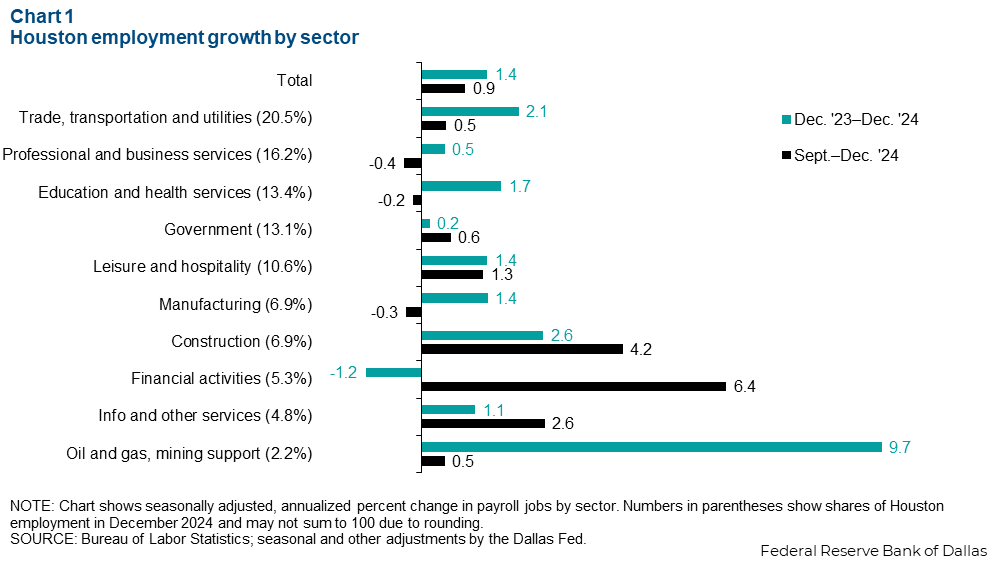
Weakness in these key industries was partially offset by strength in smaller sectors. Financial activities payrolls expanded an annualized 6.4 percent in the fourth quarter (2,838 jobs). Construction employment grew an annualized 4.2 percent (2,449 jobs).
Houston ended 2024 with below-trend employment growth of 1.4 percent (47,177 jobs) for the year. This follows state and national trends of cooling employment growth last year.
Oil and gas employment grew the fastest at 9.7 percent in 2024 (6,694 jobs). Trade, transportation and utilities, a much larger share of the metro area’s employment, added the most jobs for the year (14,220). While financial services ended the year with strong growth, job losses earlier in the year resulted in the sector shedding 1.2 percent of its payrolls (-2,182 jobs) year over year.
Energy market
Texas crude production steadily rises
Crude oil production in Texas increased to 5.9 million barrels per day (mb/d) in October 2024, an all-time high. Year over year, the state’s crude production increased 4.8 percent. The combined rig count in the Eagle Ford and Permian regions ticked up slightly to 355 active rigs in December 2024, a 2.8 percent decline year over year (shown as an index in Chart 2). Meanwhile, the number of new wells drilled also increased in December 2024 to 555. In contrast to the rig count, the number of new wells drilled each month has increased 3.0 percent year over year.

The well count has diverged from the rig count since early 2023 as oil field efficiency has increased. Rig crews are now drilling more new wells per day than before the pandemic. This and longer lateral drilling distances have increased oil field efficiency and productivity, driving Texas’ production of light sweet crude to record highs.
The U.S. produced more crude oil than any other country in 2024, and Texas by itself ranks among the top five oil producing countries in the world. Nonetheless, the U.S. imports significant amounts of crude oil with different chemical compositions from what can be produced domestically. The main source is Canada, from which the U.S. imported about 4 mb/d of crude in 2024.
Retail fuel prices decline
Nominal prices for fuel and oil increased into 2025 (Chart 3). The uptick in fuel prices comes as Brent crude prices increased from $1.80 per gallon in the last week of December up to $1.97 per gallon the week of January 13.

Diesel fuel increased from $3.20 per gallon in the final week of December to $3.45 the week of January 20, then retreated the following week to $3.38. The increase in the retail gasoline price was less notable. In the last week of December, retail gasoline prices in Houston were $2.53 per gallon, rising to $2.65 the week of January 27.
Port activity
Volume of trade through Houston ticks up
Seasonally adjusted imports into the Houston–Galveston port district increased to 7.2 million metric tons (mt) in November from 6.4 million mt in October (Chart 4). The district exported 32.8 million mt in November, up from October’s 30.5 million mt.
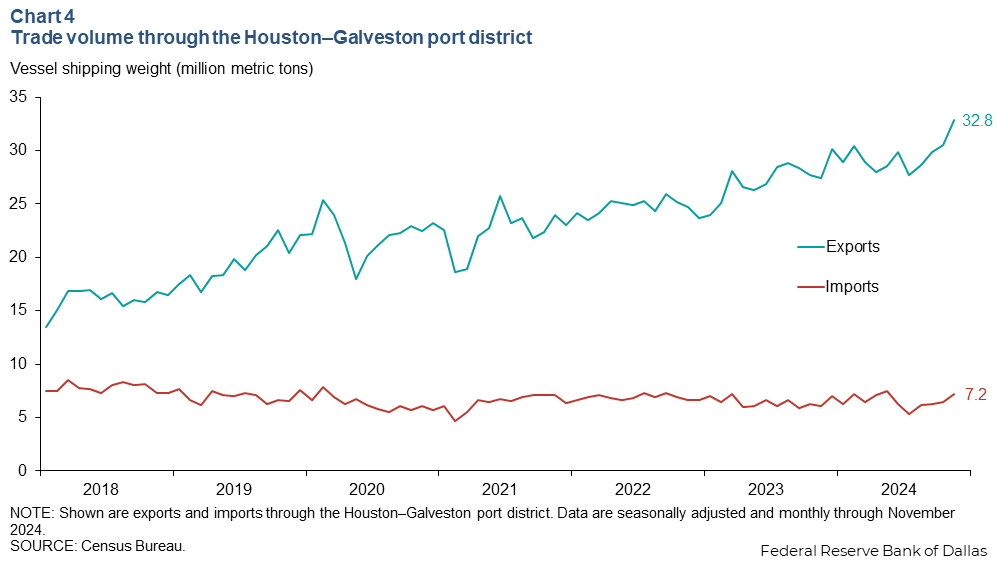
Export tonnage, which is skewed toward export of bulk liquids such as of crude oil, refined petroleum products and chemicals, far exceeds import tonnage at the Houston–Galveston port district. Imports are generally weighted toward consumer goods and intermediate inputs for Texas manufacturers and services firms.
Energy exports drive increasing trade volume
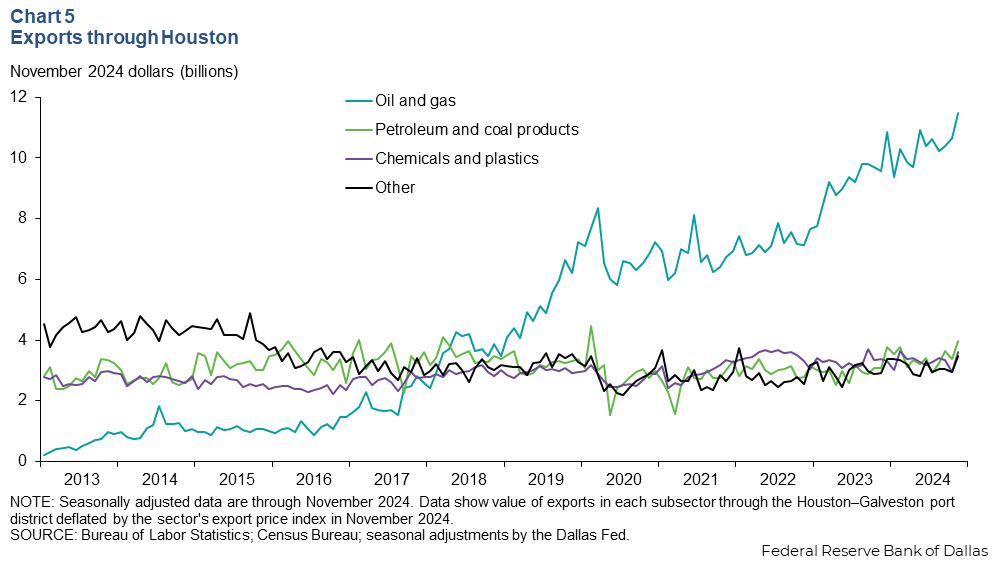
Real exports of oil and gas through the Houston–Galveston port district ticked up to $11.5 billion in November 2024 from $10.7 billion in October 2024 (Chart 5). Chemicals and plastics increased from $2.9 billion to $3.6 billion over the same time. Petroleum and coal product exports grew from $3.4 billion in October 2024 to $3.9 billion in November.
NOTE: Data may not match previously published numbers due to revisions.
About Houston Economic Indicators
Questions or suggestions can be addressed to Robert Leigh at robert.leigh@dal.frb.org. Houston Economic Indicators is posted on the second Monday after monthly Houston-area employment data are released.