Houston Economic Indicators

| Houston economy dashboard (June 2024) | |||||
| Job growth (annualized) March–June '24 |
Unemployment rate |
Avg. hourly earnings | Avg. hourly earnings growth y/y |
||
| 1.8% | 4.4% | $34.66 | 3.9% | ||
Houston’s labor market grew on trend in second quarter 2024 despite soft June data, and the unemployment rate ticked up. Initial unemployment insurance claims spiked following Hurricane Beryl. The housing market continues to cool with home prices and home sales stabilizing. Inventories of single-family homes for sale ticked up, and permits for new single-family units remained high in April. Apartment rent growth remained stable in June despite a decline in permits for new multifamily units.
Labor market
Slow June buoyed by strong April, May
Employment in Houston fell 0.7 percent from May through June (-2,009 jobs). However, combined with strong monthly growth in April and May, job growth remains modest. Over the three months ending in June, employment in Houston grew an annualized 1.8 percent, or 15,434 jobs (Chart 1). Mining and construction jobs spiked, with 10.0 percent growth in mining (1,623) and 14.0 percent growth in construction (7,643). Growth in construction employment was strong across subsectors, but heavy and civil engineering construction—the smallest of the three major construction subsectors—added the most jobs. Financial and information and other services both grew strongly from March through June.
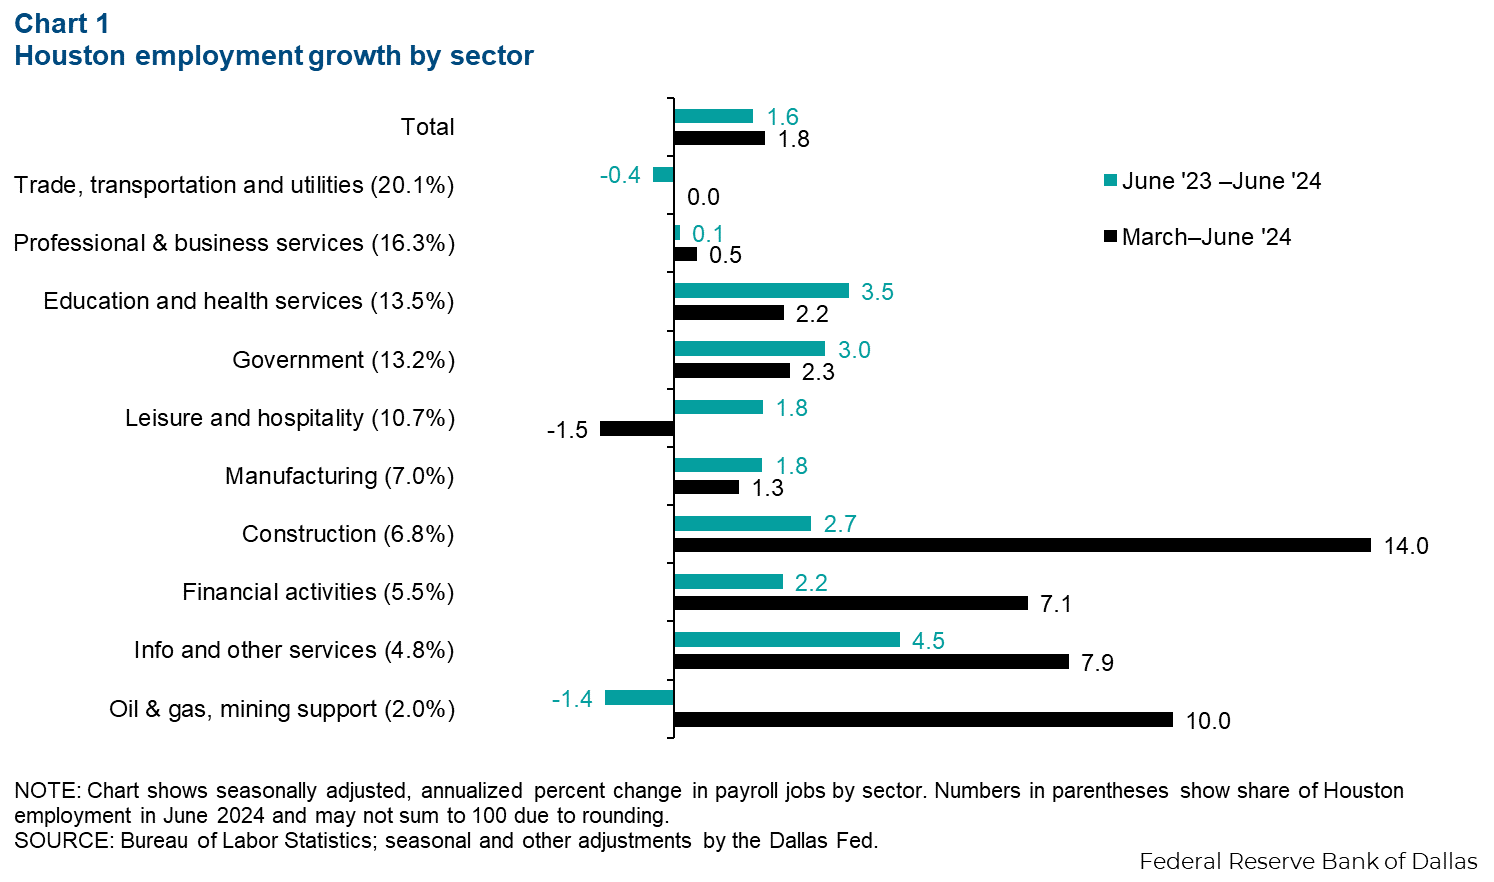
However, over the same period, employment in trade, transportation and utilities and professional and business services remained mostly flat. Due to the relative size of these sectors in Houston, their stagnant employment growth is weighing down Houston’s overall rate.
Year over year in June, Houston’s labor market was balanced. Employment grew 1.6 percent from June 2023 through June 2024. Education and health services and information and other services each grew more than 3.0 percent during that period. However, trade, transportation and utilities and professional and business services were again flat. Mining employment declined 1.4 percent (-979 jobs).
Hurricane Beryl causes spike in unemployment claims
Non-seasonally adjusted initial claims for unemployment insurance in Harris County jumped from 2,762 the week of July 6 to 8,645 the week of July 13 following Hurricane Beryl—a net increase of 5,883, or 213 percent. The entire state’s seasonally adjusted net change that week was 11,927 claims.
Unemployment claims typically spike the sharpest in the two to three weeks following a major hurricane but normalize around five or six weeks after the storm, all else equal. The week of July 27, there were 3,500 unemployment claims filed in Harris County—lower than the week following Beryl but higher than the six-week pre-Beryl average.
On a seasonally adjusted basis, the average weekly unemployment claims in Texas increased 66 percent in the three weeks following Beryl compared with the average over the six weeks prior to Beryl (Chart 2). Comparing average weekly claims for the six weeks prior to hurricanes Ike and Harvey with the average six weeks after those events, claims jumped 87.3 percent after Ike and 149.7 percent after Harvey. Claims data are expected to remain elevated as they update over the next few weeks.

Residential housing market
Nominal house-price growth stabilizes
First-quarter growth in the Houston Federal Housing Finance Administration home-price index was 2.7 percent year over year (Chart 3). This is just below Texas’ 2.9 percent growth. The price index—a repeat sales index that tracks the purchase prices of the same homes over time—was little changed from the two previous quarters. Year over year, the median price of Houston existing homes that sold was up 2.3 percent in May. Median home-price growth has settled from the recent high of 4.1 percent in February.

The median home price in Houston in May was $335,000. This is down from a peak in early 2022 of $360,000, adjusted for inflation to current dollars. However, even after adjusting for local inflation since 2018, median home prices have increased from $281,000 in January 2018 (in May 2024 dollars).
Houston home inventory rises
Houston’s inventory of homes ticked up to 4.0 months of supply in April from 3.4 months in January (Chart 4). This is the highest level of inventory seen since June 2019. This higher supply of inventory comes as the number of listings in the market has increased markedly, while monthly sales have ticked up more slowly. The number of home sales in April increased to 7,500. This is slightly above the average of 7,200 monthly sales from January 2023 through April 2024.

Houston’s population has risen in recent years, with employment growing 37.5 percent since January 2007. Dividing total home sales by the workforce puts the number of home sales in better historical context. Year to date, the monthly average number of home sales per 1,000 employed people is 2.10. That is an increase from 2.06 sales per 1,000 employed people in 2023 but below the 2.21 sales in 2013 and 2.43 sales in 2007.
Rent growth remains stable
Nominal apartment rents for new leases grew 0.6 percent year over year in June (Chart 5). This is little changed from 0.4 percent growth in May and is down from 1.5 percent growth at the beginning of the year.

Rent growth in Houston has been outpacing other Texas metros since mid-2023. Markets like Dallas and Austin entered the pandemic era with relatively tight apartment supplies and saw sharp acceleration in rents as a result. Thanks to new construction and slowing demand, rents in most major Texas metros, except Houston, have since declined. Higher homebuilding activity in Texas puts downward pressure on rent increases compared with the nation.
Permits for new housing units fall
The three-month moving average of building permits for single-family homes in the Houston metropolitan statistical area ticked down to 4,203 in June (Chart 6). This is a 0.7 percent decline from June 2023—meaning the new construction activity for single-family units in Houston has remained largely stable over the past year.

Multifamily permits further declined to 588 in June from 1,029 in April. Year to date in June, they fell 60 percent. High interest rates, rising costs, weakening occupancy and falling lease rates have made new investments less attractive.
NOTE: Data may not match previously published numbers due to revisions.
About Houston Economic Indicators
Questions or suggestions can be addressed to Robert Leigh at robert.leigh@dal.frb.org. Houston Economic Indicators is posted on the second Monday after monthly Houston-area employment data are released.