Houston Economic Indicators

| Houston economy dashboard (August 2023) | |||||
| Job growth (annualized) May–Aug. '23 |
Unemployment rate |
Avg. hourly earnings | Avg. hourly earnings growth y/y |
||
| 1.3% | 4.5% | $34.18 | 10.4% | ||
Houston job growth picked up in August, buoyed by a recovering construction sector, while the number of layoff notices remained below 2019 average levels. The metro’s Purchasing Managers Index (PMI) indicated expansion, while the Houston Leading Index (HLI) contracted slightly in August, driven by a slowing national economy. Construction showed signs of recovery, with jobs and single-family permits up, and pressures on home prices continued to ease.
Labor market
Job growth slows over summer
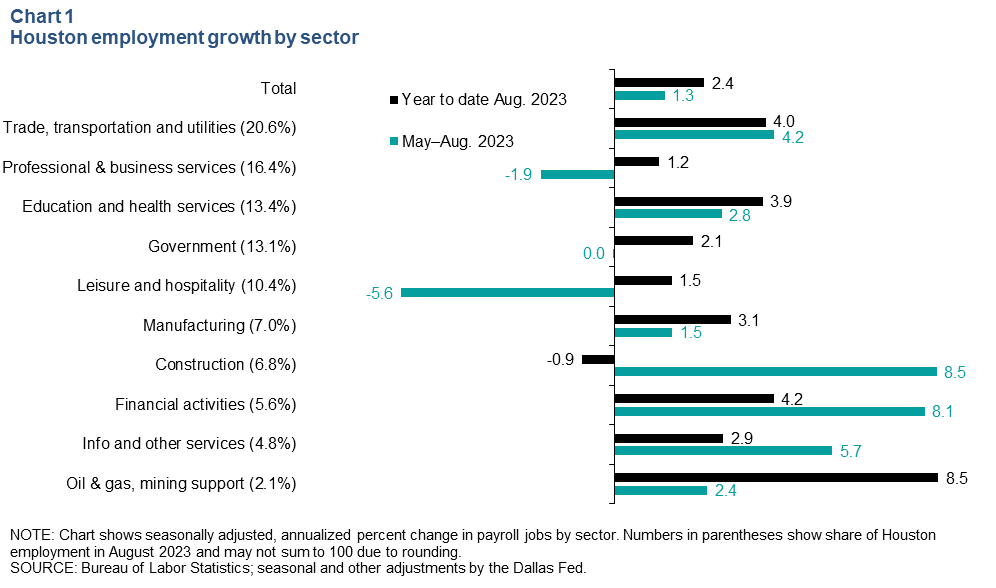
Houston added 10,997 jobs on net in the three months ending in August, bringing the year-to-date total to 51,792, an increase of 2.4 percent (Chart 1). Some sectors that saw slowing earlier in the year bounced back over the summer, with construction losing 5,883 jobs from January through May but gaining 4,577 jobs from May through August, bringing the net year-to-date job loss to 1,306. Other sectors saw slowing in the summer months, including professional and business services, which lost 2,714 jobs since May, and leisure and hospitality, which lost 5,082. Some of this change could be due to end-of-summer heat waves, which disproportionately impacted services like leisure and hospitality.
Layoffs are well below prepandemic levels
Only 880 layoffs have been announced in Houston this year—a 28.4 percent decrease from the first eight months of last year and a 79.6 percent decrease from 2019. The sectors most impacted this year have been construction and transportation and warehousing. The low number of layoffs, despite the fact that total payrolls are 6.4 percent above their average level in 2019, underscores the current strength of the Houston labor market.

The number of layoff notices in the Houston metro area surged 708.1 percent from 2019 to 2020 versus 458.3 percent in Texas, based on Worker Adjustment and Retraining Notification (WARN) Act filings (Chart 2). Layoffs announced under the WARN Act provide notice 60 days in advance of closures or mass layoffs and are an early measure of potential job losses.
Houston leading indicators
The Houston Institute for Supply Management’s PMI ticked up to 53.6 in August (Chart 3). The index is based on monthly surveys of Houston-area purchasing managers about the direction of sales, production, employment and other aspects of their business. A reading above 50 indicates expansion, and a reading below 50 indicates contraction.
The employment index, which tends to coincide with job growth, rose to 56.8 as payrolls increased 1.3 percent in the three months ending in August. New orders (sales) and production—components that tend to lead changes in job growth—both ticked up in August and remained in expansionary territory.

Both sales and production from the Houston PMI are included among the 10 components of the HLI. The latter fell a slight 0.2 percent from May through August, its first decline in six months. The biggest drag on growth was the U.S. Leading Index, which dipped as U.S. new orders and consumer confidence fell. However, recent increases in oil prices and the Houston Bloomberg 150 stock index boosted growth.
Notably, in 2022 slowing oil market indicators in the second half of the year compounded the effects of higher interest rates, which were impacting both construction permits and home sales components of the index. The double whammy caused the downturn in the HLI last year.
Real estate
Single-family permits jump up in July; inventories and sales drop
Permits and home sales remained above 2017 levels but are still well below mid-pandemic highs (Chart 4). From peak to trough, home sales fell 31.0 percent, and single-family permits dropped 40.6 percent. Both have recovered somewhat since their lows in early 2023, with single-family construction permits almost completely rebounding. In July, single-family permits were 39.0 percent above January 2017 levels—only slightly below their peak in May 2022.

Housing inventory ticked down to 2.6 months in July, indicating that the housing market remains tight. Inventory factors in both the number of homes on the market and the pace of monthly sales, making it a measure of balance in the market. Housing markets today are widely considered balanced at closer to four months’ supply, versus six months historically.
Home-price growth slows further in second quarter
Houston home-price pressures eased in the first half of 2023, with year-to-year price growth falling from 17.6 percent in fourth quarter 2022 to 5.7 percent in second quarter 2023, according to Federal Housing Finance Agency data (Chart 5). Though growth is slowing, Houston home prices were still rising faster than both the state (3.0 percent) and the nation (4.5 percent) year over year in the second quarter.

A monthly measure of existing-home prices from the Multiple Listing Service for Houston showed that the median price among homes sold in the metro declined 2.6 percent year over year in July 2023. Some of this decline could be due to composition changes, as this measure of home prices does not control for changes in the characteristics of the homes being sold (like size or age). Even so, this is the sixth straight month of year-over-year declines in median home prices.
NOTE: Data may not match previously published numbers due to revisions.
About Houston Economic Indicators
Questions or suggestions can be addressed to Ana Pranger at ana.pranger@dal.frb.org. Houston Economic Indicators is posted on the second Monday after monthly Houston-area employment data are released.