Houston Economic Indicators

December 9, 2021
After a turbulent year marked by extreme weather and two waves of COVID-19, Houston’s jobs recovery continues to make quick progress. The recent moderation of COVID hospitalizations combined with healthy payroll data, strong expansion in economic output and continued growth in leading indicators paint an optimistic picture for further recovery. While there are signs of slowing, the outlook for the Houston economy remains positive.
COVID-19
The surge in hospitalizations and deaths associated with the Delta variant has largely come and gone from Houston, though other areas of the U.S. are seeing different trends. Recent data may be skewed by the Thanksgiving holiday, but the number of COVID-positive patients in Houston-area hospitals flattened near 520 by the end of November (Chart 1). This implies that daily deaths attributed to COVID on death certificates in the nine-county metro will have leveled off between five and 10 per day by early December.

Furthermore, the pace of vaccination in Texas increased with the approval of the vaccine’s use for all school-age children and the administering of booster shots. The share of the state’s population that was fully vaccinated by the end of November—at least two doses—was over 59 percent. At that time, Houston’s metro vaccination rate was closer to 62 percent.
While the Delta wave of COVID-19 impacted the pace of recovery in sensitive industries like leisure and hospitality over the summer, its impact on economic activity was relatively muted compared with prior waves that were accompanied by mandates limiting business activity.
Barring the emergence of a new variant that once again overburdens hospitals and forces curbs on economic activity—by substantially evading both the existing vaccine and natural immunity—it seems increasingly unlikely that further waves of infection will significantly slow the pace of the local recovery. That said, the global impact of ongoing infections, limitations on travel and interruptions to port operations may affect energy demand and Houston supply chains for many months to come.
Employment
June 2021 payrolls in Houston were down a net 171,000 jobs compared with February 2020, based on the most recent revision to the data (Chart 2). From June to October 2021, payrolls added an estimated 56,000 jobs. Gains were led by educational and health services—mostly in social assistance, which includes child care. Professional and business services was close behind, with sectors like employment services (staffing firms) and professional, scientific and technical services driving the increase.

Year to date, Houston jobs are on pace to grow 4.2 percent this year, and total payroll job numbers should be fully recovered from the pandemic by mid-2022. In comparison, Texas jobs have grown at an annual pace of 4.9 percent and are on pace to fully recover to prepandemic levels in January 2022.
Consumer Spending
Houston payroll job growth may be lagging the nation this year, but real spending on credit cards in the Houston metro area has outperformed the nation and the state since June 2021 (Chart 3). The comparably high growth in spending since January 2020 suggests that consumer demand in relatively urban centers like Houston, Dallas–Fort Worth and Austin is faring well.

Leading Indicators
Activity High as Leading Indicators Slow
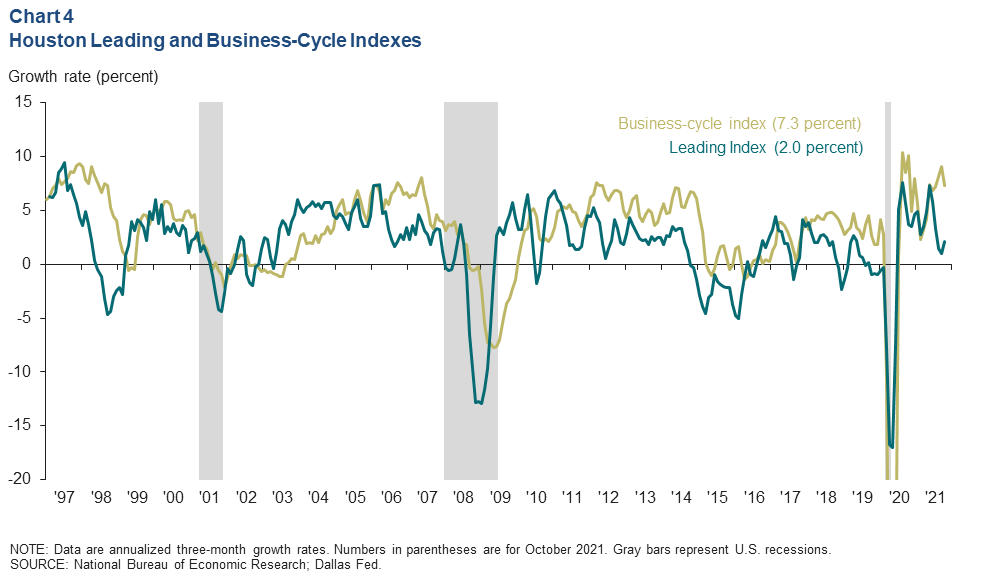
The Houston Business-Cycle Index, one of the timeliest measurements of broad economic activity in the region, grew 7.3 percent over the three months ending in October (Chart 4). Outside of the sharp slowdown caused by Winter Storm Uri in early 2021, the three-month pace of growth over most of the pandemic has oscillated between 5 and 10 percent. To put that in context, the average pace of annual growth over the 20 years prior to the pandemic was 2.9 percent.

An index of 10 leading indicators for economic activity in Houston grew at an annualized rate of 2.0 percent over the three months ending in October 2021. This compares to the average annual pace of growth in the index over the 20 years prior to the pandemic, which was 1.5 percent. Taken together, the leading and business-cycle indexes suggest that economic activity in the region is apt to slow over the next three to four months as the recovery matures and labor markets tighten further.
Slowing Widespread Across Components but Acute in Chemical Sector in Turbulent Year
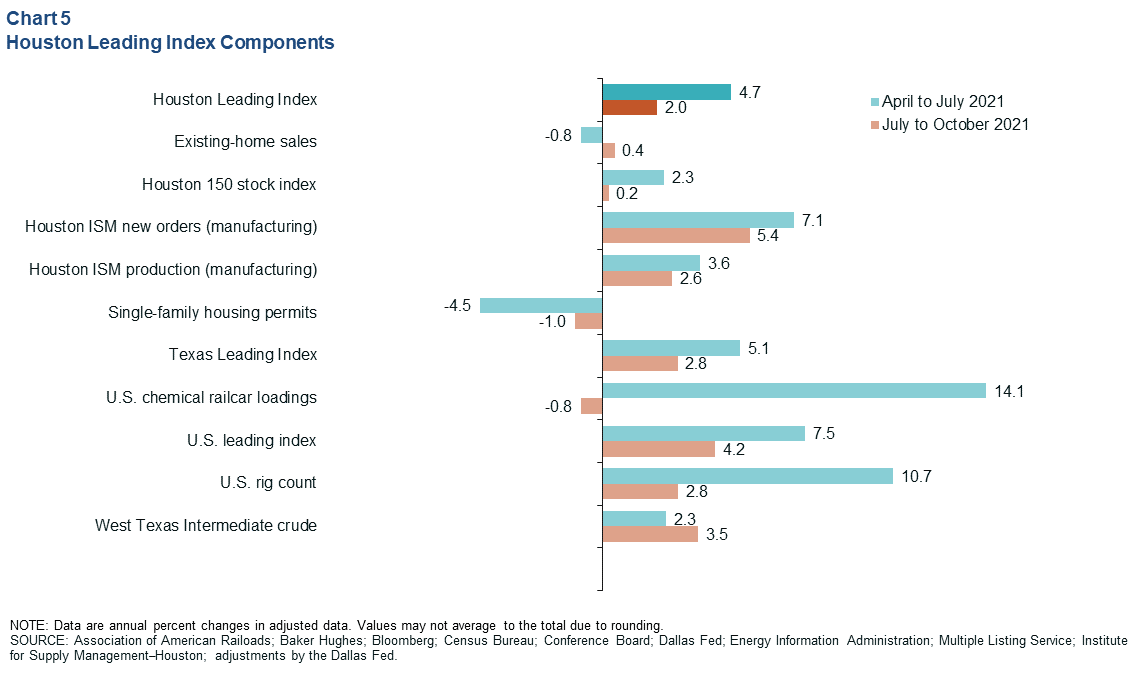
While the slowdown in the leading index was broad based—only housing permits, home sales and oil prices made positive contributions to the pace of the index—the extent of the slowing is partly distorted by the chemical sector, which was whipsawed by Winter Storm Uri at the end of the first quarter and Hurricane Ida at the end of the third quarter (Chart 5).

NOTE: Data may not match previously published numbers due to revisions.
About Houston Economic Indicators
Questions can be addressed to Jesse Thompson at jesse.thompson@dal.frb.org. Houston Economic Indicators is posted monthly after Houston-area employment data are released.