El Paso Economic Indicators

April 28, 2023
| El Paso economy dashboard (March 2023) | |||
| Job growth (annualized) Dec. '22–March '23 |
Unemployment rate |
Avg. hourly earnings |
Avg. hourly earnings growth y/y |
| 0.3% | 4.4% | $23.06 | 8.2% |
El Paso’s economy registered moderate growth in March. There was little change in the business-cycle index, overall nonfarm employment and single-family home construction. The unemployment rate declined. U.S. auto production and sales were down from the previous month.
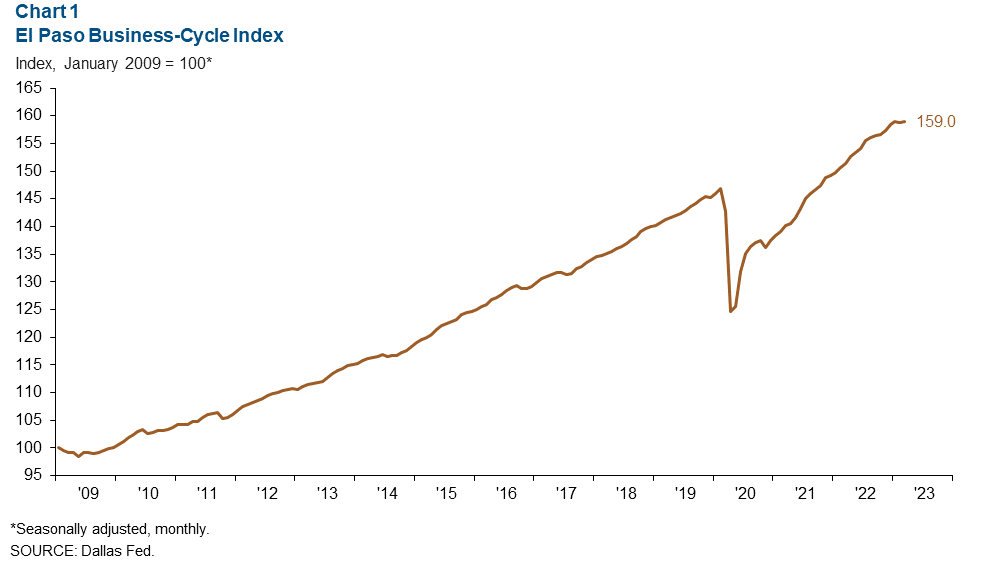
Business-cycle index
The El Paso Business-Cycle Index edged slightly up from 158.8 in February to 159 in March (Chart 1). The index has changed little since December 2022.
Labor market
Payrolls slightly grow
Employment expanded an annualized 0.4 percent in March (107 jobs) (Chart 2). Growth was not evenly distributed across sectors; some sectors experienced large upward swings, and some saw big reductions. Construction and mining (237) and government (185) experienced the greatest increases. Meanwhile, professional and business services (228), leisure and hospitality (179), and financial activities (110) contracted significantly.
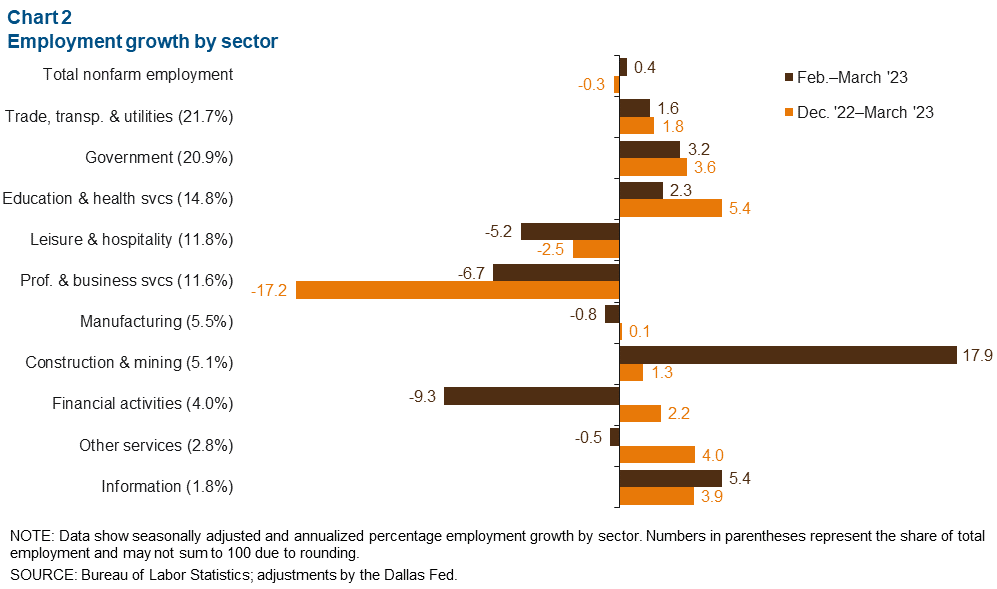
Total nonfarm employment contracted 0.3 percent annualized during first quarter 2023 (269 jobs). Most of the decrease can be attributed to professional and business services (1,899), although leisure and hospitality declined as well (251). Education and health services (653) and government (615) have held strong, registering lower year-to-date growth than Texas' 3.9 percent and the U.S'. 2.7 percent.
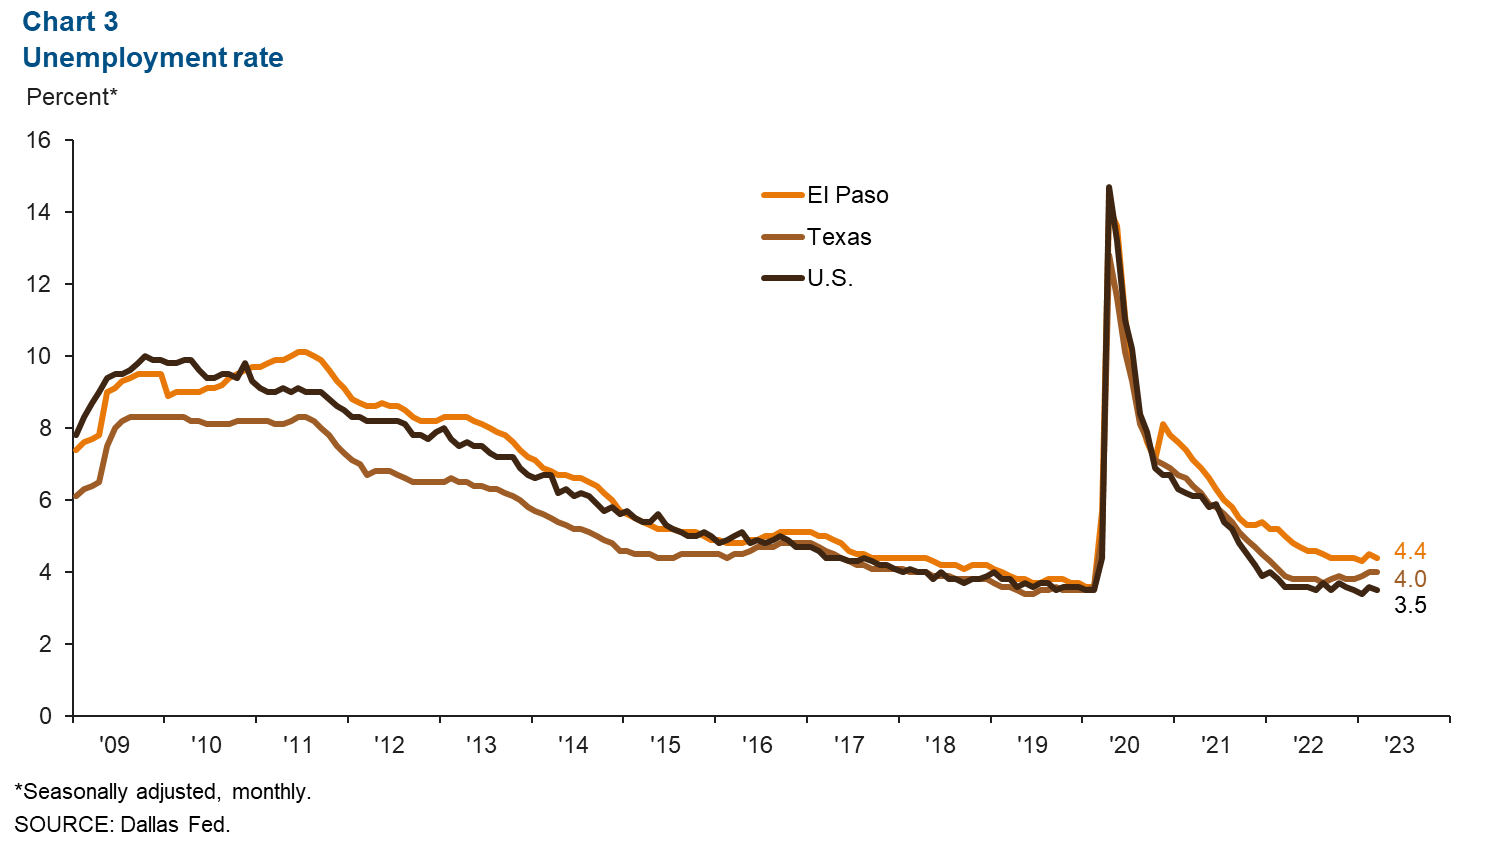
Unemployment rate declines
El Paso’s unemployment rate dipped from 4.5 percent in February to 4.4 percent in March (Chart 3). It has declined significantly since last March when it was 5.0 percent. However, it remains above the rates for Texas (4.0 percent) and the nation (3.5 percent).
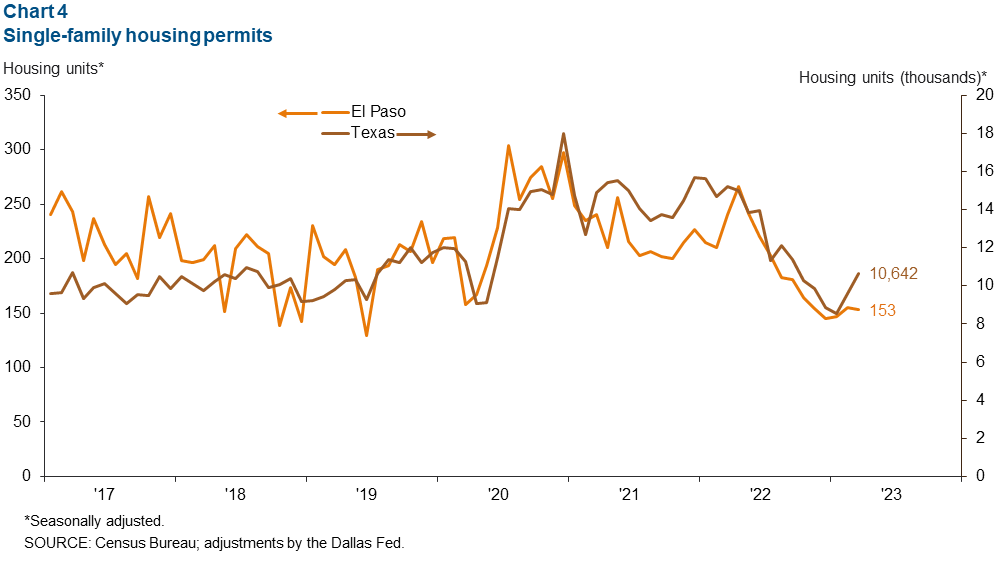
Housing construction
After declining for months, home construction has reached a trough in El Paso. New single-family housing permits totaled 153 units in March, down from 240 units one year ago (Chart 4). While El Paso’s decline in permits was in line with the state’s for most of 2022, Texas has experienced a larger rebound in construction thus far in 2023.
Industrial production and maquiladora-related activities
The monthly U.S. industrial production (IP) index increased 0.5 percent from last year and 0.4 percent from February to March (Chart 5). Meanwhile, the Mexico IP index rose 3.5 percent from February 2022 to February 2023 and grew 0.7 percent from January to February 2023. The Institute for Supply Management (ISM) manufacturing index fell 1.4 percentage points to 46.3 in March, down 10.7 points from last year. ISM indexes below 50 signal contraction in the manufacturing sector.
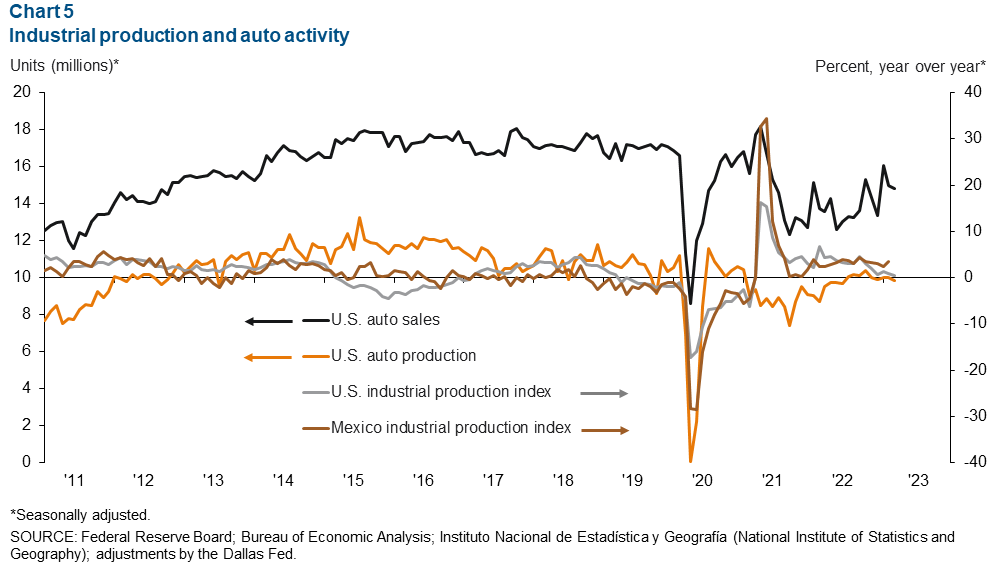
U.S. monthly auto production softened in March, declining by an annualized 177,600 units. Sales fell an annualized 184,000 units. However, production and sales were up 3.2 percent and 9.3 percent, respectively, from last year. Industrial and auto activity are closely linked to the El Paso-area economy because of cross-border manufacturing relationships. Roughly half of maquiladoras in Juárez are auto related.
NOTE: Data may not match previously published numbers due to revisions. The El Paso metropolitan statistical area includes El Paso and Hudspeth counties.
About El Paso Economic Indicators
Questions or suggestions can be addressed to Aparna Jayashankar at Aparna.Jayashankar@dal.frb.org. El Paso Economic Indicators is published every month after state and metro employment data are released.