El Paso Economic Indicators

March 30, 2023
| El Paso economy dashboard (February 2023) | |||
| Job growth (annualized) Nov. '22.–Feb. '23 |
Unemployment rate |
Avg. hourly earnings |
Avg. hourly earnings growth y/y |
| 1.6% | 5.0% | $23.12 | 9.2% |
El Paso economic indicators weakened in February. Employment fell, the unemployment rate jumped and the number of job postings declined. Additionally, both monthly auto production and sales decreased.
Labor market
Payrolls contract
Payrolls contracted in February for the first time since last August, falling an annualized 2.6 percent (-738 jobs) (Chart 1). The government sector (232 jobs) and financial activities (113) experienced strong gains. Professional and business services (-620 jobs), leisure and hospitality (-307) and construction and mining (-276) saw significant declines.
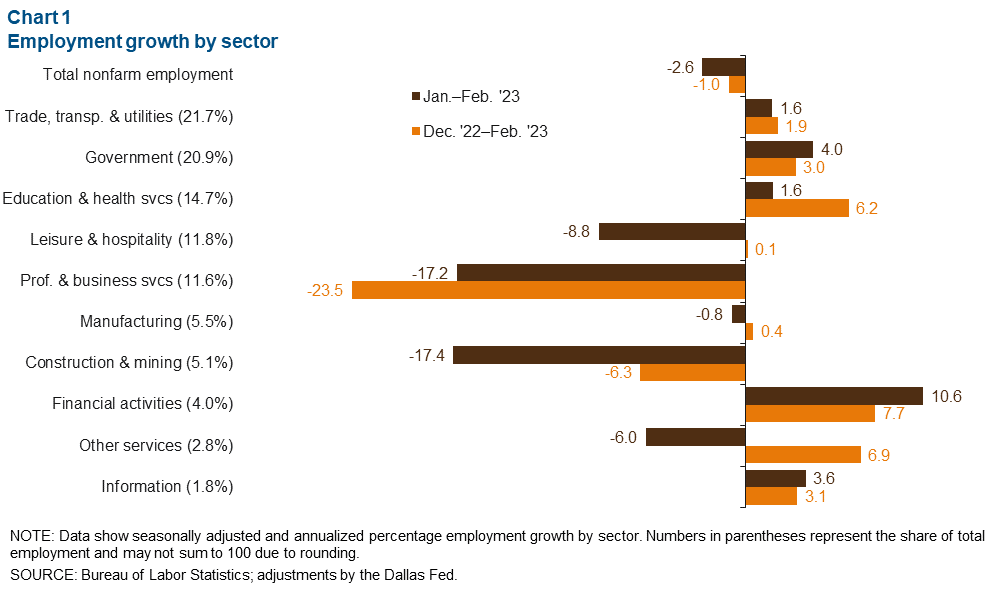
Thus far in 2023, El Paso has lost a net 573 jobs. The biggest declines have come in professional and business services, down 23.5 percent (-1,782 jobs) from December 2022 to February, and construction and mining, down 6.3 percent (-187). All other sectors have experienced positive year-to-date employment growth.
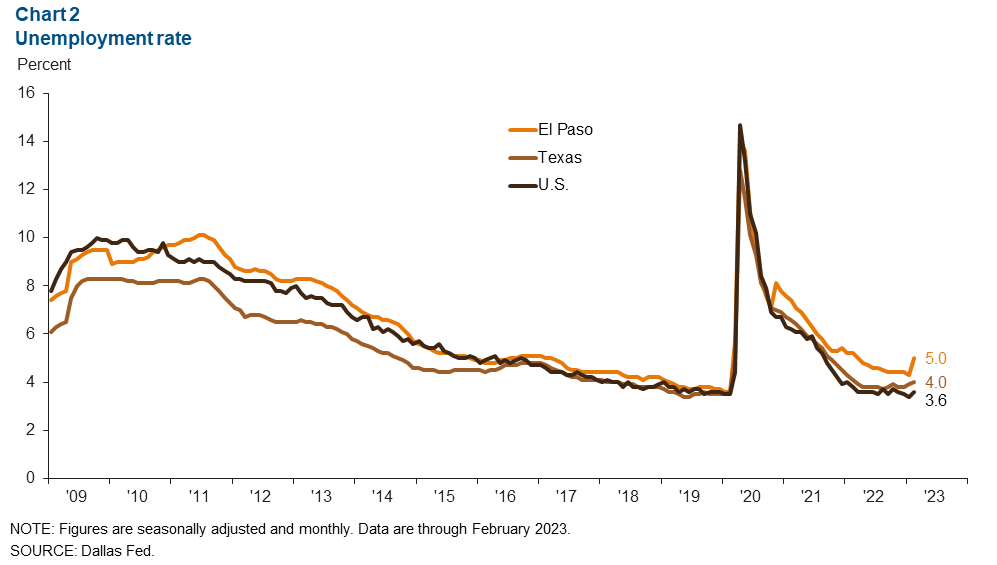
Unemployment rate jumps
El Paso’s unemployment rate spiked from 4.3 percent in January to 5.0 percent in February (Chart 2). Compared with El Paso, unemployment increases were relatively small in Texas (3.9 to 4.0 percent) and the nation (3.4 to 3.6 percent).
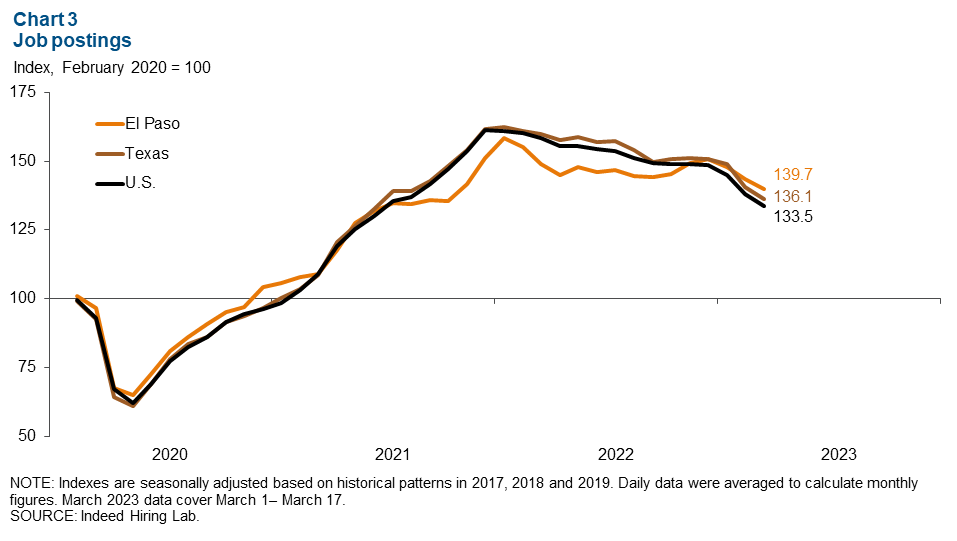
Job postings continue to fall
The Indeed Job Posting Index for El Paso dropped 2.7 percent in March to 139.7, continuing a downward trend in the number of job postings since January 2022 (Chart 3). The index also fell 3.3 percent in both Texas and the U.S.
Industrial production and maquiladora-related activities
The monthly U.S. industrial production (IP) index was unchanged from January to February at 102.6 and near its reading from last February (Chart 4). Mexico’s IP in January increased 2.5 percent from the previous year. The Institute for Supply Management (ISM) manufacturing index rose slightly from January (47.4) to February (47.7) but remained below 50. ISM indexes below 50 signal contraction in the manufacturing sector.

U.S. monthly auto production was down 205,600 units in February, while sales were down almost 1 million units. Auto production was up 17.8 percent from the same month in 2022, and sales increased 8.5 percent. Industrial and auto activity are closely linked to the El Paso-area economy because of cross-border manufacturing relationships. Roughly half of maquiladoras in Juárez are auto related.
NOTE: Data may not match previously published numbers due to revisions. The El Paso metropolitan statistical area includes El Paso and Hudspeth counties.
About El Paso Economic Indicators
Questions or suggestions can be addressed to Aparna Jayashankar at Aparna.Jayashankar@dal.frb.org. El Paso Economic Indicators is published every month after state and metro employment data are released.