El Paso Economic Indicators

January 25, 2023
| El Paso Economy Dashboard (January 2023) | |||
| Job growth (annualized) Oct. '22.–Jan. '23 |
Unemployment rate |
Avg. hourly earnings |
Avg. hourly earnings growth y/y |
| -2.9% | 4.3% | $22.09 | 7.2% |
In December, El Paso experienced strong employment growth, and the unemployment rate declined. In addition, the business-cycle index increased, and trade volume in the district was higher than last year. In contrast, U.S. manufacturing production, and auto production and sales fell.
Business-cycle index
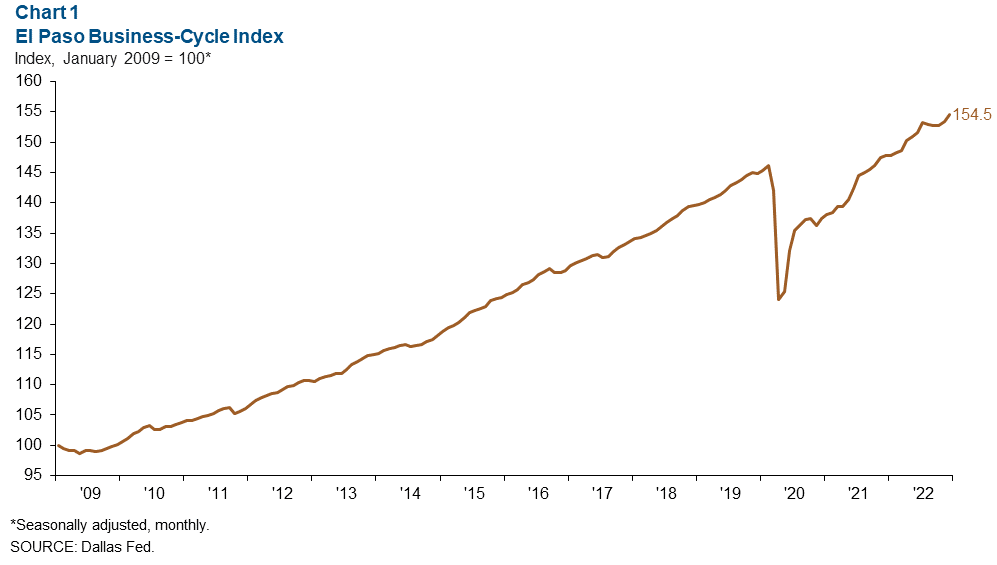
The El Paso Business-Cycle Index continued its upward trajectory in December, increasing an annualized 9.1 percent (Chart 1). The index was up 4.6 percent from 2021.
Labor market
Employment growth rebounds
Payrolls grew 6.8 percent annualized in December (1,831 jobs), a heightened pace compared with 3.2 percent growth in November and a 1.1 percent decline in October (Chart 2). Trade, transportation and utilities (725), professional and business services (566), financial activities (177) and manufacturing (163) experienced strong gains. Construction and mining (-160), leisure and hospitality (-134), and information (-23) saw declines.
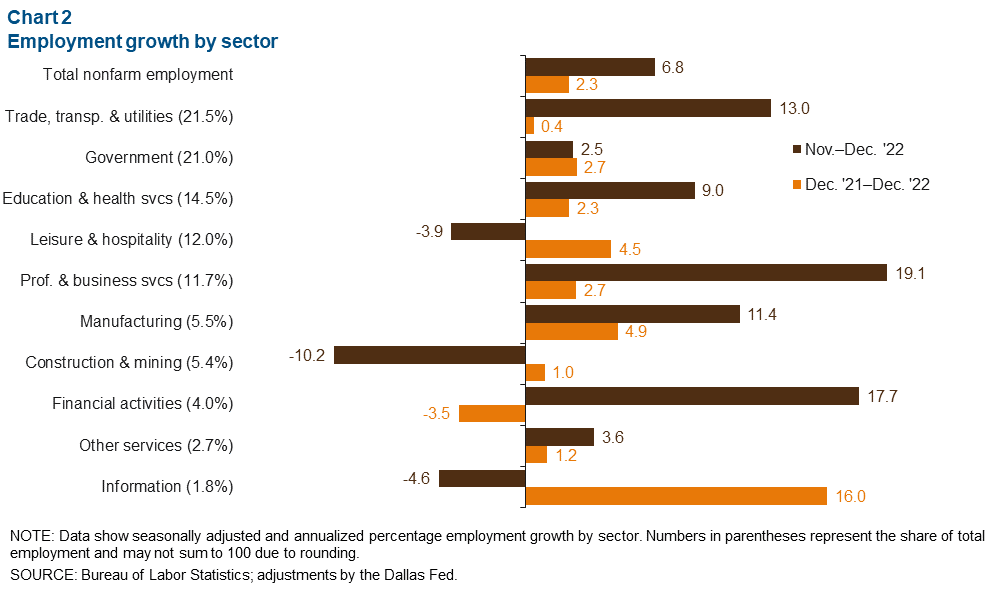
El Paso added 7,498 jobs in 2022, exceeding 2021 growth (5,673) and falling just short of 2020’s number (7,509). Employment in 2022 expanded across all sectors but financial activities, which lost 481 jobs over the last year. Gains were driven by government (1,859), leisure and hospitality (1,738), education and health services (1,102), and professional and business services (1,028). The information sector experienced the most growth despite comprising a small share of El Paso’s employment, expanding 16 percent (805).
Unemployment ticks down
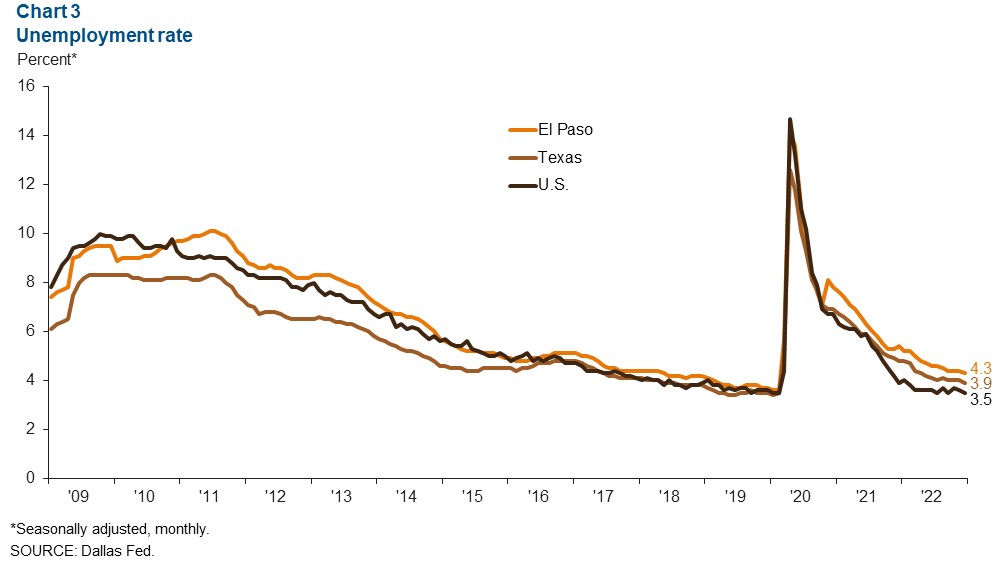
El Paso’s unemployment rate fell to 4.3 percent in December after staying at 4.4 percent for three months (Chart 3). It remained above the prepandemic level (3.6) and exceeded the rates of both Texas (3.9) and the U.S. (3.5).
Trade volume
In November, El Paso’s trade volume totaled $138.1 billion annualized, up 3 percent from 2021 (Chart 4). Exports rose 1.2 percent from November 2021, while imports increased 4.3 percent. Trade primarily flowed through the ports of Ysleta (61 percent), Santa Teresa (20 percent) and El Paso (18 percent). Both imports and exports have surpassed prepandemic levels.

Industrial production and maquiladora-related activities
In December, the monthly U.S. industrial production (IP) index fell 0.7 percent to 103.4 (Chart 5). It was up 1.6 percent from the previous year, while Mexico’s IP increased 2.9 percent from November 2021. The Institute for Supply Management (ISM) manufacturing index fell 0.6 points in December, dropping to 48.4. The index was below 50 for the second consecutive month, indicating contraction in the manufacturing sector.
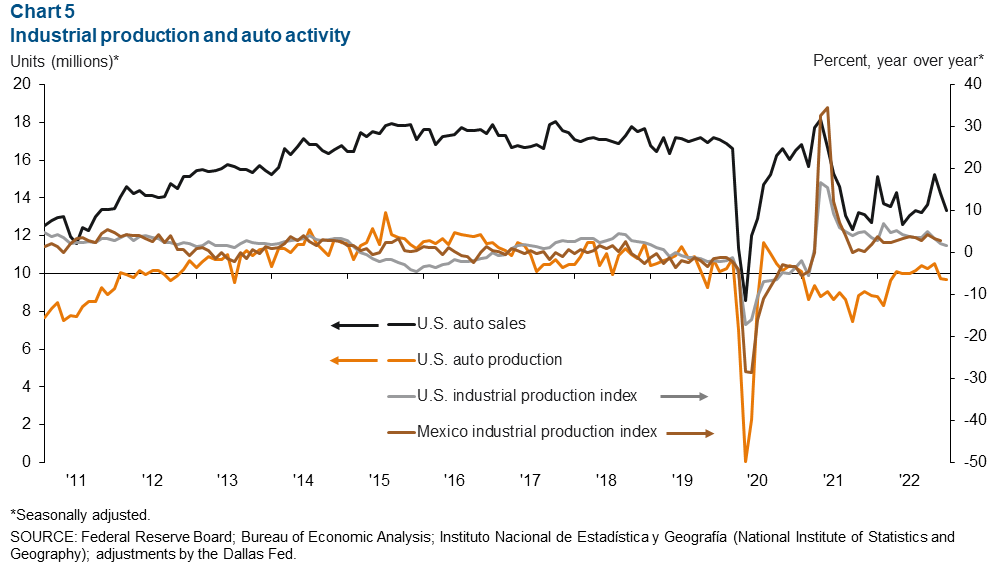
Compared with November, U.S. monthly auto production was down 67,800 units in December, while sales were down about 899,000 units. Auto production was up 9.5 percent from 2021 (9.7 million units) in December, while sales rose 4.7 percent (13.3). Industrial and auto activity are closely linked to the El Paso-area economy because of cross-border manufacturing relationships. Roughly half of maquiladoras in Juárez are auto related.
NOTE: Data may not match previously published numbers due to revisions. The El Paso metropolitan statistical area includes El Paso and Hudspeth counties.
About El Paso Economic Indicators
Questions or suggestions can be addressed to Aparna Jayashankar at Aparna.Jayashankar@dal.frb.org. El Paso Economic Indicators is published every month after state and metro employment data are released.