Dallas-Fort Worth Economic Indicators

April 23, 2020
The Dallas–Fort Worth economy contracted in March. Payroll employment posted its largest drop since the series began in 1990, and unemployment rose as containment measures related to the COVID-19 pandemic triggered mass layoffs, particularly in the leisure and hospitality sector. The Dallas and Fort Worth business-cycle indexes fell. Home sales dipped in March, and pending home sales, a forward-looking indicator, fell as well. Office leasing activity softened in the first quarter.
Labor Market
Payrolls Contract Sharply
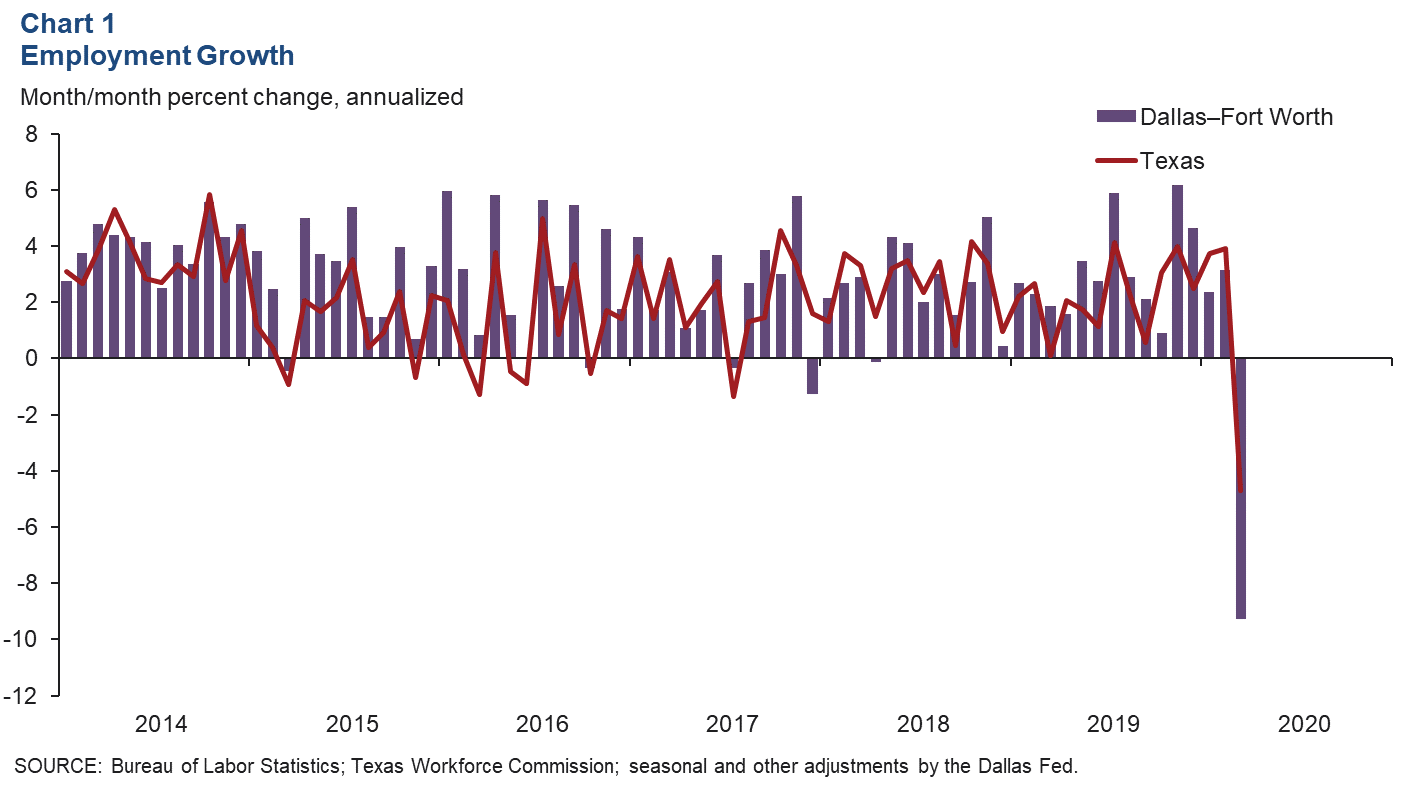
DFW employment fell an annualized 9.3 percent in March following a 2.8 percent increase in the first two months of the year (Chart 1). This was the first time since early 2018 that payrolls weakened. Payrolls contracted 5.3 percent in Dallas, but they plummeted 18.4 percent in Fort Worth—the largest drop among Texas metros. Declines in March erased gains made earlier, sending DFW employment down 1.4 percent in the first quarter.
Employment Losses Widespread
Job declines were broad based, with only employment in government expanding in March (Chart 2). Employment in the goods-producing sector fell an annualized 5.3 percent, but cuts were steeper in the service sector, with payrolls falling 9.9 percent. Declines in education and health services, leisure and hospitality, and “other services” employment led the service sector contraction. Losses were less pronounced in trade, transportation and utilities—the metro’s largest sector—as well as financial activities and information. Employment in manufacturing and the construction and mining industry also fell, though both are generally considered essential and not subject to mandated closures.

Unemployment Increases
Unemployment rose in March from near-record lows. The unemployment rate jumped to 4.0 percent in Dallas and 4.2 percent in Fort Worth, partly reflective of the layoffs occurring in recent weeks (Chart 3). Unemployment remained below the state and U.S. rates, which rose from 3.5 percent to 4.7 percent and 4.4 percent, respectively. According to weekly data, the surge in initial unemployment claims occurred from mid-March to mid-April and will be reflected in the April data, when Texas unemployment is expected to spike to 12 percent.

Business-Cycle Indexes
The Dallas and Fort Worth business-cycle indexes dipped in March, driven by widespread job losses and rising unemployment in the metroplex. The Dallas index saw a modest drop of 1.4 percent (annualized), but the contraction in the Fort Worth index was much more severe at 15.5 percent, partly due to a larger employment decline. Year over year in March, the Dallas index rose 4.8 percent and the Fort Worth index was up 2.2 percent (Chart 4). While the Dallas index remained above its long-term average year over year, the Fort Worth index fell below its average.

Real Estate
Office Absorption Lackluster
Demand for office space in the DFW market slowed in the first quarter, with the COVID-19 pandemic likely affecting leasing activity in the latter part of the quarter. Net absorption was negative, down 150,750 square feet—its first drop in two years—according to CBRE Research data (Chart 5). The vacancy rate ticked up to 20.7 percent. Construction remained vigorous at 5.4 million square feet, but it is likely to be off-schedule or delayed. The Eleventh District Beige Book reported that commercial leasing and sales activity is being impacted by heightened economic uncertainty.

Home Sales Fall
DFW home sales fell 6.4 percent in March, their biggest drop since January 2019, and the three-month moving average dipped as well (Chart 6). According to business contacts, sales held up in the earlier half of the month but weakened notably in the latter half as shelter-in-place mandates were instituted. Sales were down 8.3 percent in Dallas and 2.6 percent in Fort Worth during the month. Homes sales fell statewide as well, down 4.5 percent.

For all of North Texas, pending single-family home sales—a forward-looking measure that tallies properties under contract but not yet closed—dipped relative to February and year-ago levels. Active listings dropped year-over-year, notably as many sellers took their homes off the market. New listings of homes were down, too, relative to March 2019 as potential home sellers took a wait-and-see approach. Home listings typically rise in early spring, which marks the beginning of the home shopping season.
NOTE: Data may not match previously published numbers due to revisions.
About Dallas–Fort Worth Economic Indicators
Questions can be addressed to Laila Assanie at laila.assanie@dal.frb.org. Dallas–Fort Worth Economic Indicators is published every month on the Tuesday after state and metro employment data are released.