Austin Economic Indicators

| Austin economy dashboard (December 2024) | |||
| Job growth (annualized) Sept.–Dec. '24 |
Unemployment rate |
Avg. hourly earnings |
Avg. hourly earnings growth y/y |
| 3.2% | 3.3% | $35.51 | 4.1% |
Austin experienced employment growth in December, accompanied by a declining unemployment rate. Home prices and inventories rose, and single-family housing permits were up in December but down for 2024.
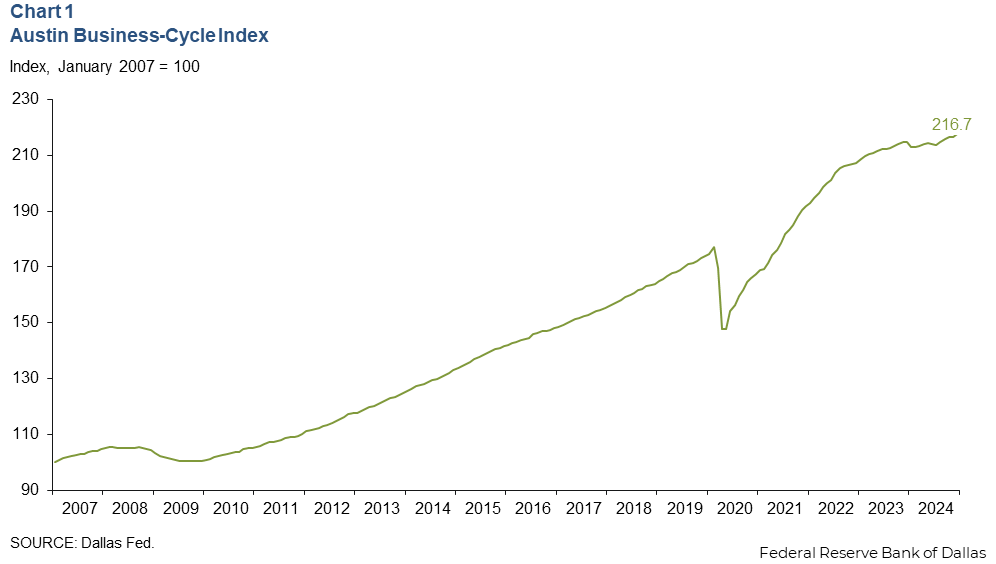
Business-cycle index
The Austin Business-Cycle Index, a broad measure of economic activity, grew an annualized 5.9 percent in December, faster than the 1.2 percent gain in November (Chart 1). Year over year, the index was up 1.4 percent.
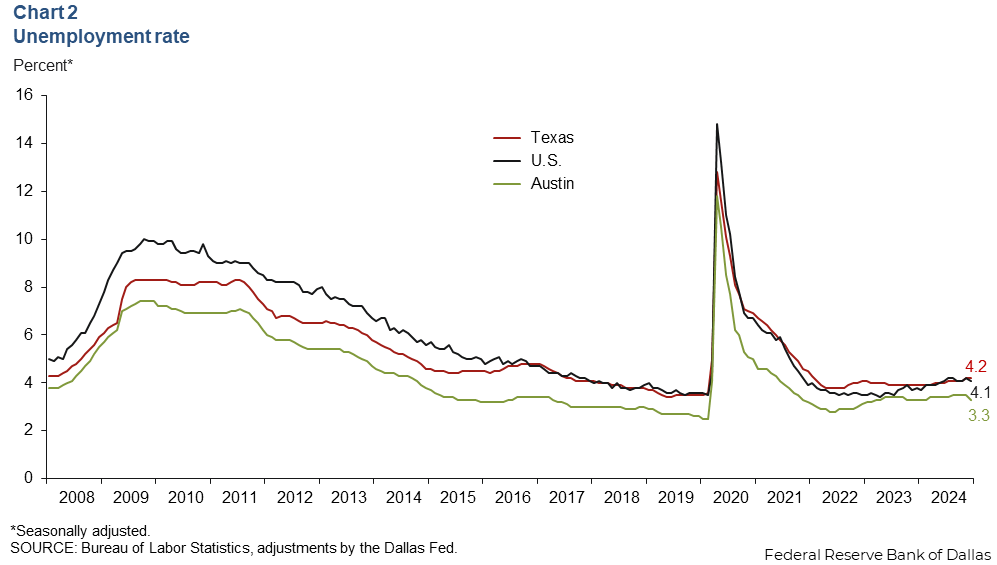
Labor market
Unemployment ticks down
Austin’s unemployment rate dipped to 3.3 percent in December, below the state and national rates of 4.2 percent and 4.1 percent, respectively (Chart 2). In December, the local labor force grew an annualized 7.5 percent, while the state’s increased 3.1 percent, and the nation’s grew 1.7 percent.
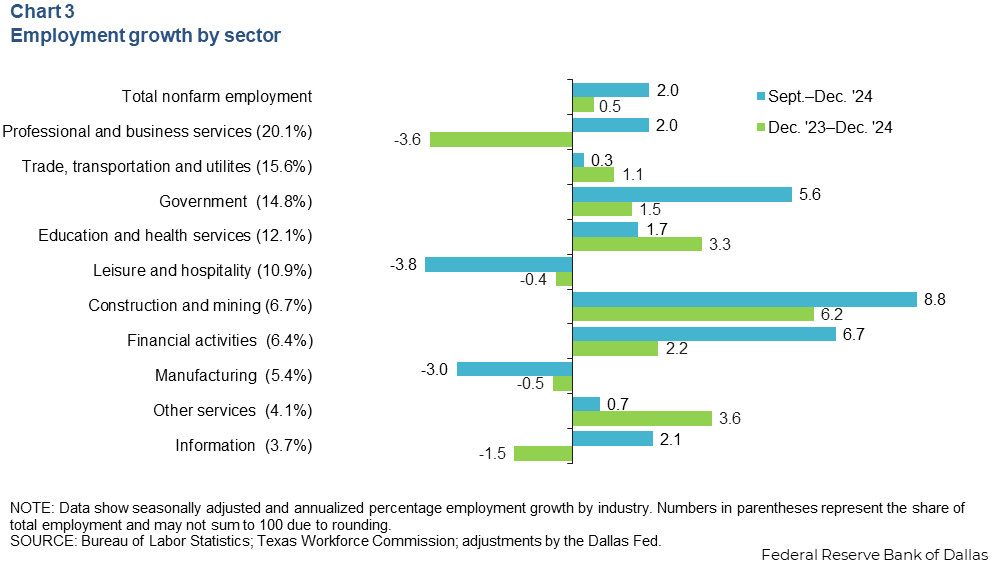
Employment growth continues
Austin employment grew an annualized 2.4 percent in December, faster than the 0.5 percent growth in November. Job growth was 2.0 percent during the fourth quarter (Chart 3). Growth was broad based, with the greatest gains seen in government (2,700 jobs) and construction and mining (1,900 jobs). Sectors that saw declines included leisure and hospitality (1,400 jobs) and manufacturing (500 jobs). Year over year, Austin’s employment growth was sluggish at an annualized 0.5 percent, slower than the state’s 1.7 percent increase and the nation’s 1.3 percent growth.
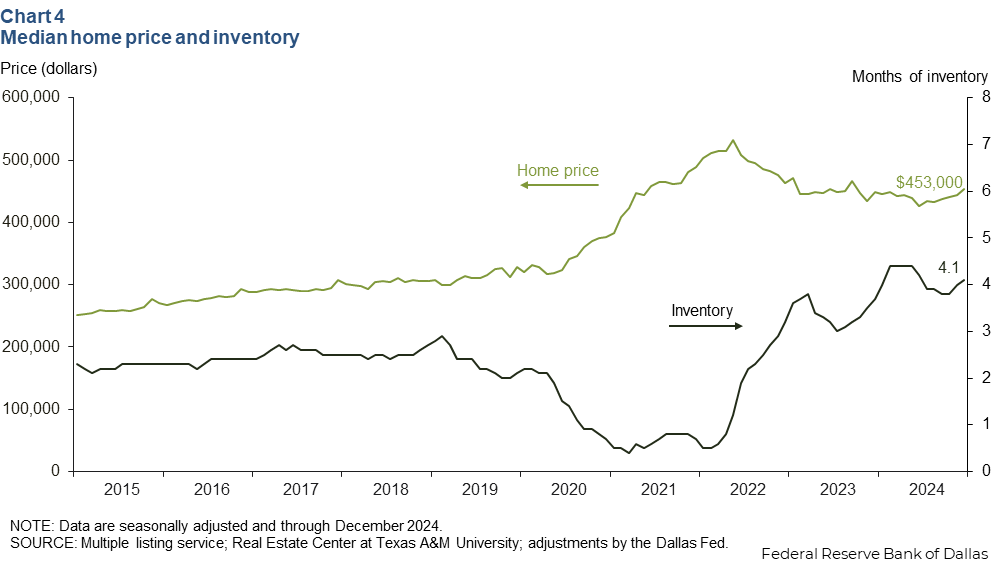
Housing
Housing prices edge up
Austin’s median home price increased 1.9 percent in December (Chart 4). Year over year, median home prices rose 1.0 percent in the metro area and 1.4 percent in Texas. Austin home inventories ticked up to 4.1 months in December, remaining below six months, which is generally considered a balanced housing market. A year ago, home inventory levels in Austin were 3.7 months.
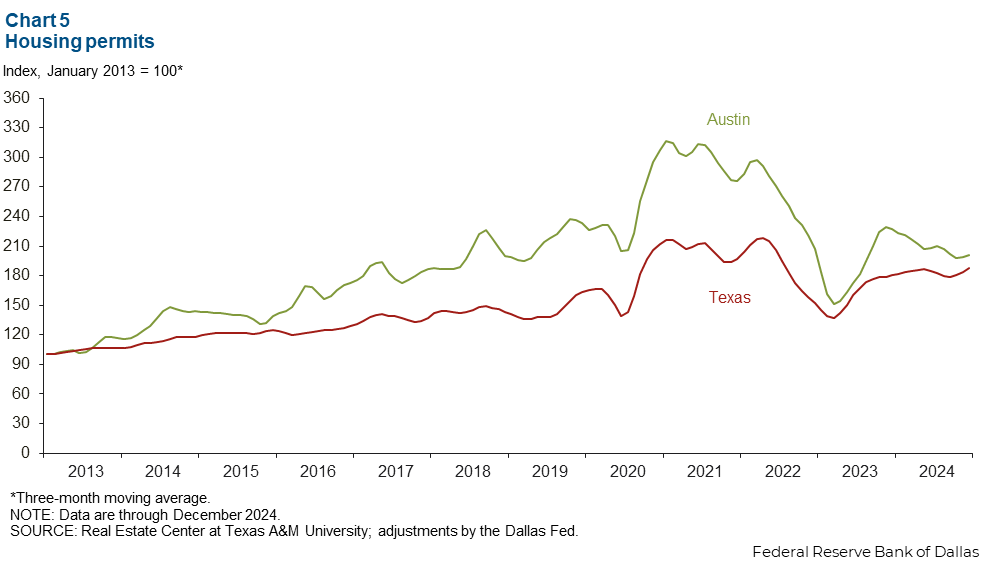
Housing permits tick up
The three-month moving average of Austin’s single-family home permits increased 1.3 percent in December, less than the 3.3 percent increase seen across the state (Chart 5). Year over year in December, the three-month moving average of single-family home permits dropped 7.9 percent, while the state’s permits rose 5.3 percent.
NOTE: Data may not match previously published numbers due to revisions.
About Austin Economic Indicators
Questions or suggestions can be addressed to Isabel Dhillon at Isabel.Dhillon@dal.frb.org.
Austin Economic Indicators is released on the first Thursday of every month.