Austin Economic Indicators
January 8, 2021
The Austin economy slowed in November as the Austin Business-Cycle Index decelerated due to an increase in the unemployment rate. Nonetheless, job growth was positive in most industries, and regional consumer spending since mid-July continues to hold at pre-COVID-19 levels. Office space demand continued to weaken, and existing-home sales contracted slightly in November.
Business-Cycle Index
The Austin Business-Cycle Index—a broad measure of economic activity—expanded an annualized 2.4 percent in November. This marked the seventh consecutive month of growth, which suggests continued, albeit slowing, improvement in the Austin economy (Chart 1).

Labor Market
Unemployment Rate Rises
Austin’s unemployment rate increased to 6.3 percent in November, while the state’s rate rose to 8.1 percent, and the nation’s rate fell to 6.7 percent (Chart 2). The rise in metro and state unemployment rates was largely due to an increase in individuals reentering the labor force seeking jobs.

Most Sectors Post Job Gains
Austin payrolls grew an annualized 7.4 percent, or 19,320 net jobs, in the three months ending in November (Chart 3). Financial activities led job expansion (25.5 percent, or 4,000 jobs), followed by leisure and hospitality (23.1 percent, or 5,140 jobs) and other services (21.5 percent, or 2,040 jobs). Sectors that posted job contractions were government (-7.3 percent, or 3,525 jobs) and construction and mining (-0.4 percent, or 80 jobs). Financial activities and professional and business services were the only sectors to post positive job growth for the first 11 months of the year.

Consumer Spending
Since late July, consumer spending (measured by credit and debit card spending) in Travis County has surpassed January 2020 levels. As of Dec. 6, spending in the county was up 12.4 percent relative to January, while spending in Texas was down 1.0 percent (Chart 4).

Real Estate
Office Space Declines
Demand for office space in Austin continued to decline in the fourth quarter. Net absorption remained negative for the third consecutive quarter (-839,994 square feet in the fourth quarter), and the vacancy rate increased to 16.7 percent—the highest since fourth quarter 2011 (Chart 5). Average asking rent was $39.39 per square foot, which was unchanged from the third quarter but 1.3 percent higher than fourth quarter 2019.

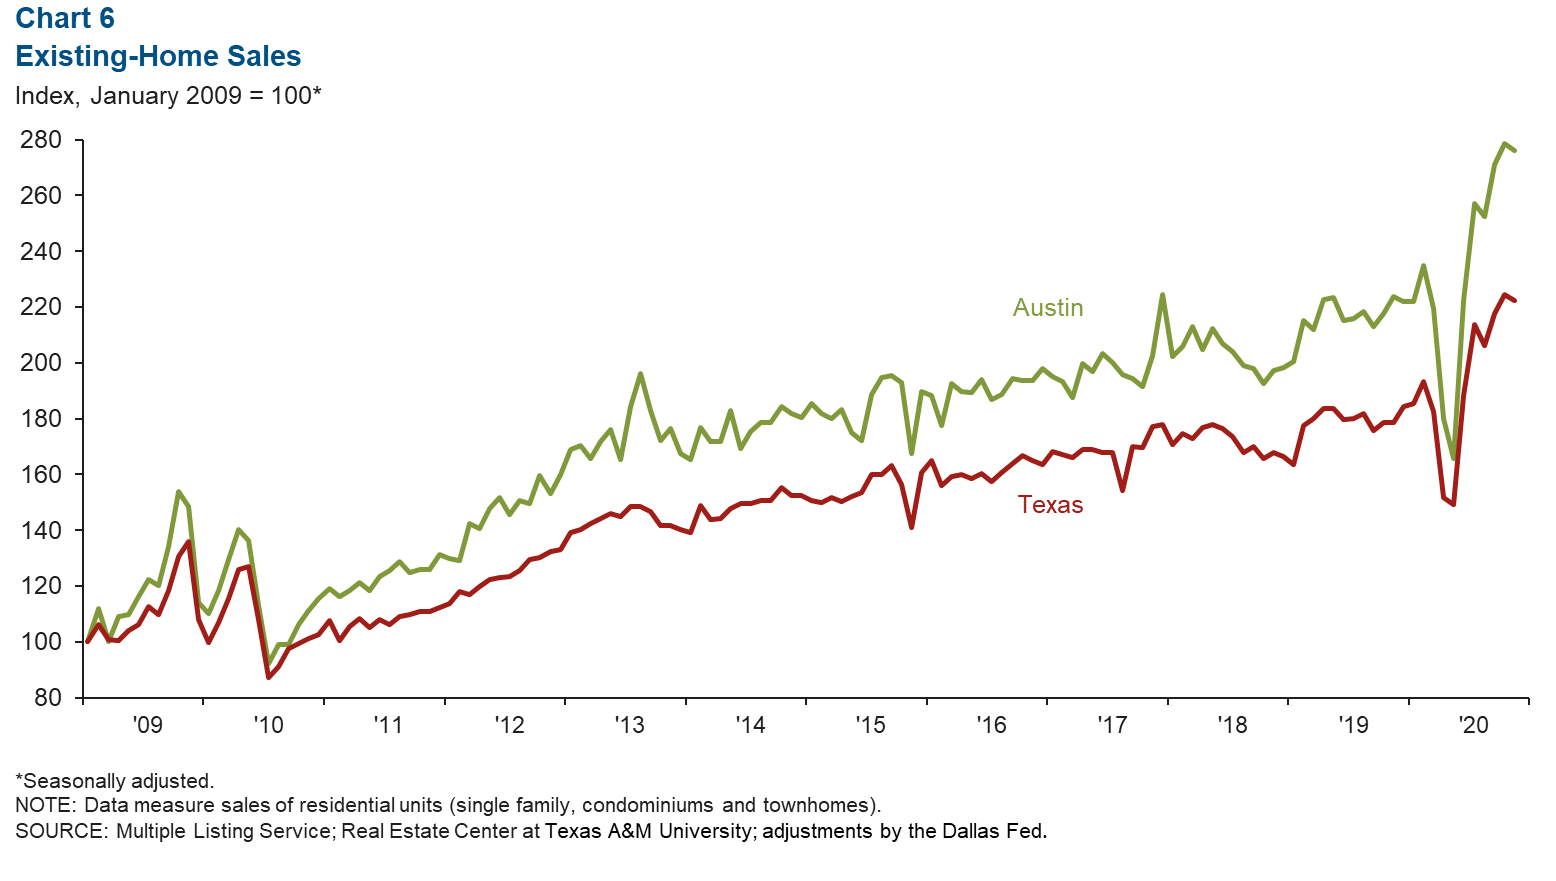
Home Sales Tick Down
Existing-home sales in November contracted 0.9 percent in Austin and the state (Chart 6). However, metro home sales for the year remained robust—up 8.5 percent in the first 11 months of the year relative to the same period in 2019. At the state level, sales were up 8.8 percent for that same period. The median price of homes sold in November was $367,511 in the metro, a 17.4 percent rise year over year, compared with $272,738 in Texas, an 11.0 percent gain.
NOTE: Data may not match previously published numbers due to revisions.
About Austin Economic Indicators
Questions can be addressed to Judy Teng at judy.teng@dal.frb.org. Austin Economic Indicators is released on the first Thursday of every month.