Austin Economic Indicators
November 5, 2020
The Austin economy continued to recover in September, although the pace of growth slowed. The Austin Business-Cycle Index decelerated. Job growth was broad based in the third quarter, but the unemployment rate recently ticked up. Regional consumer spending since mid-July continues to hold at pre-COVID-19 levels. Existing-home sales and building permit activity posted strong performances, and home inventories declined to a record low.
Business-Cycle Index
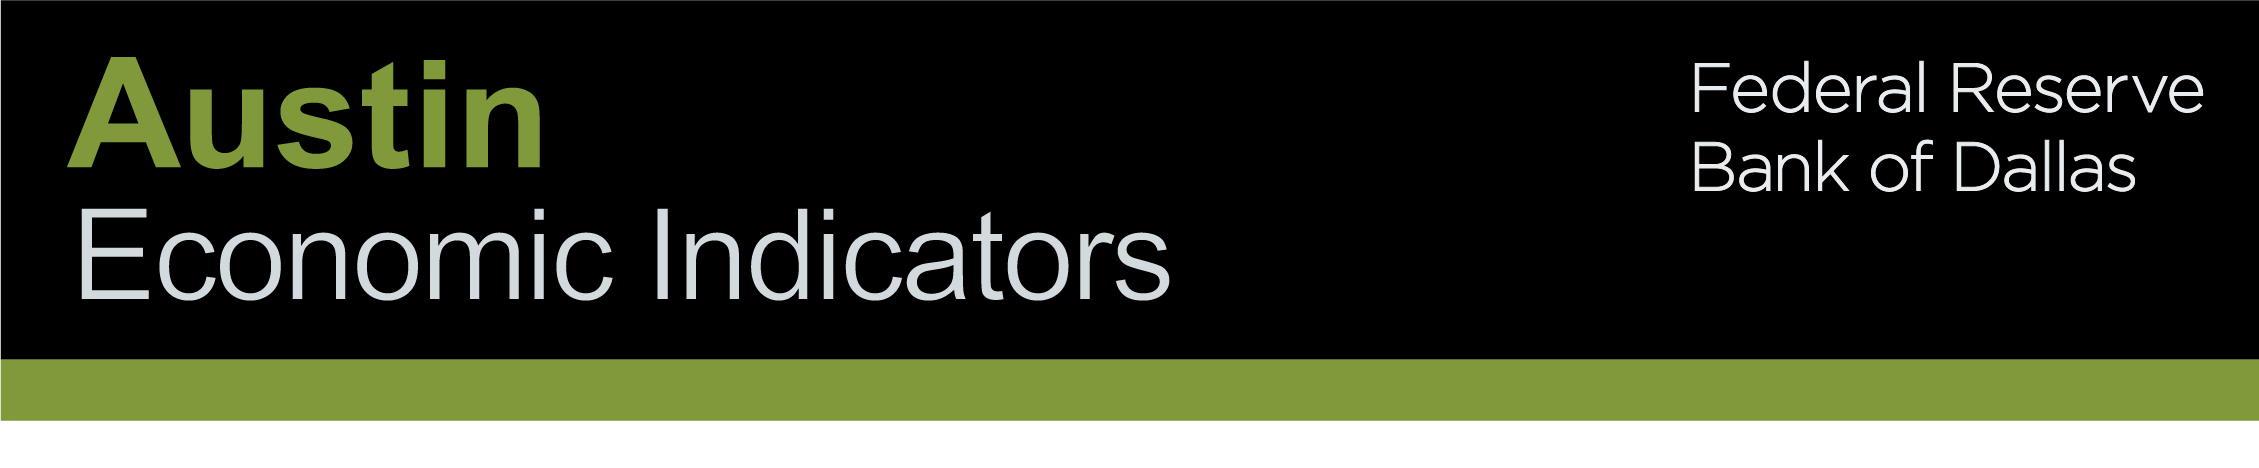
The Austin Business-Cycle Index—a broad measure of economic activity in the metro—increased for the fifth consecutive month at an annualized rate of 1.2 percent in September, suggesting continued, albeit slowing, improvement in the Austin economy (Chart 1).
Labor Market
Unemployment Rate Rises
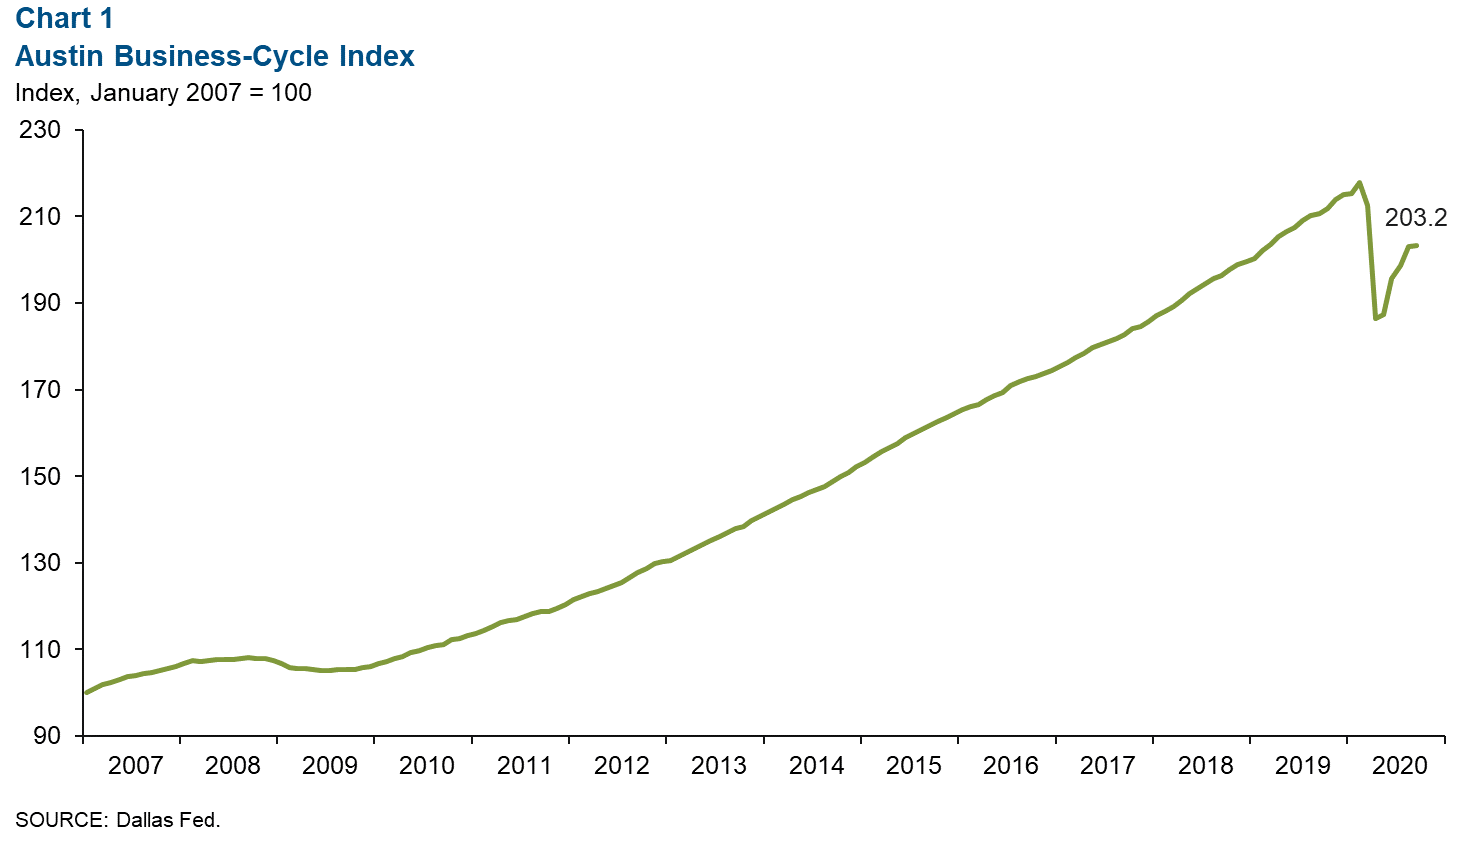
Austin’s unemployment rate rose to 6.7 percent in September, the highest level since May (Chart 2). The jobless rate ticked up to 8.3 percent in the state, above the nation’s 7.9 percent.
Most Sectors See Recent Job Gains
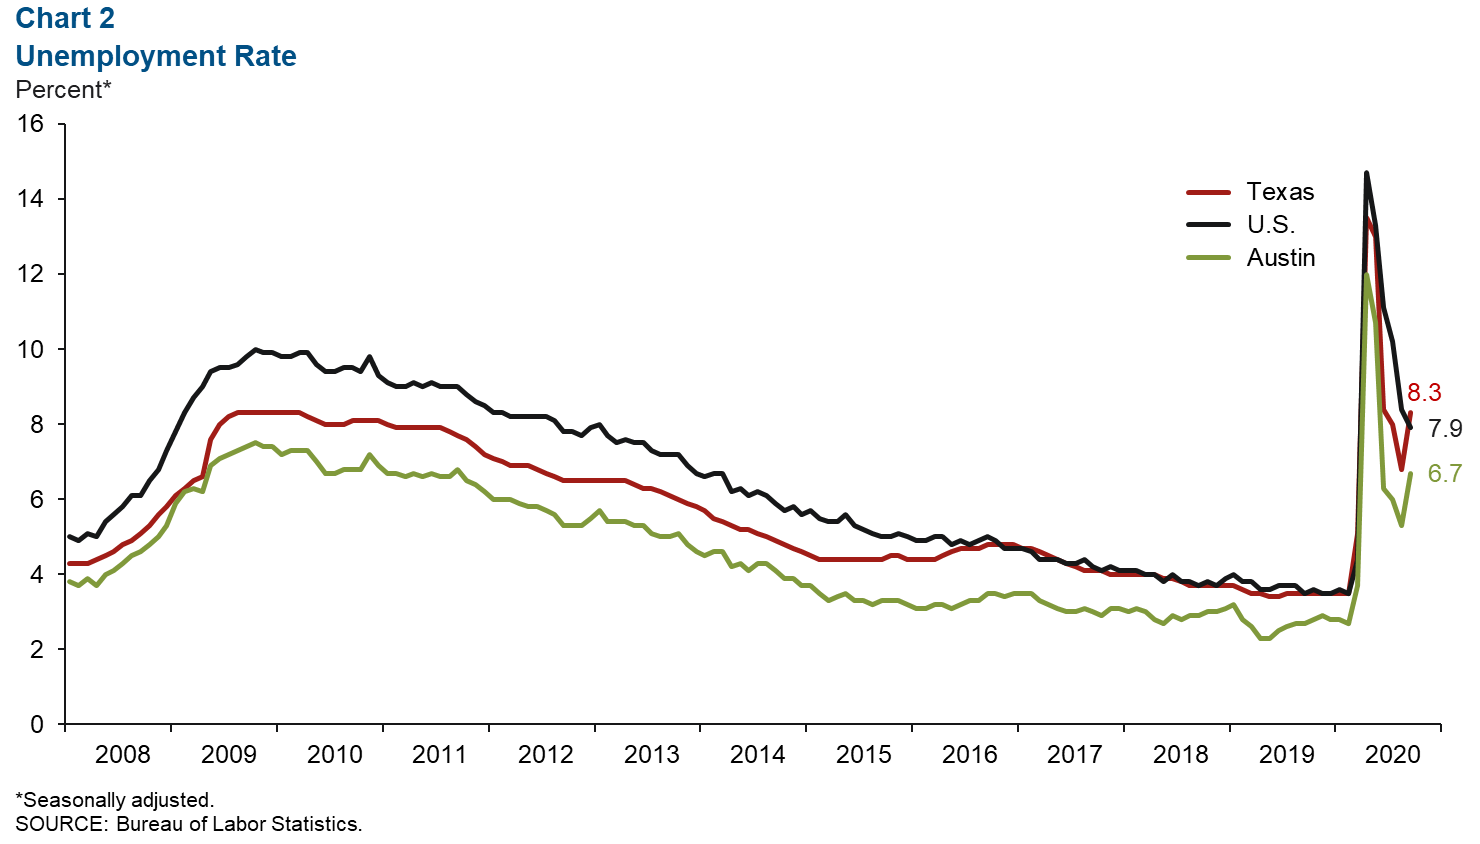
Austin payrolls expanded an annualized 11.1 percent, or by 28,340 net jobs, in the third quarter (Chart 3). The professional and business services sector led the expansion with 23.9 percent growth, or 10,680 jobs. This was followed by other services (22.9 percent, or 2,250 jobs), government (17.7 percent, or 7,150 jobs) and financial activities (10.6 percent, or 1,840 jobs). The only sector that contracted was construction and mining (-13.8 percent, or 2,645 jobs). Professional and business services, manufacturing, and financial activities were the only sectors to post positive job growth for the first nine months of the year.
Consumer Spending
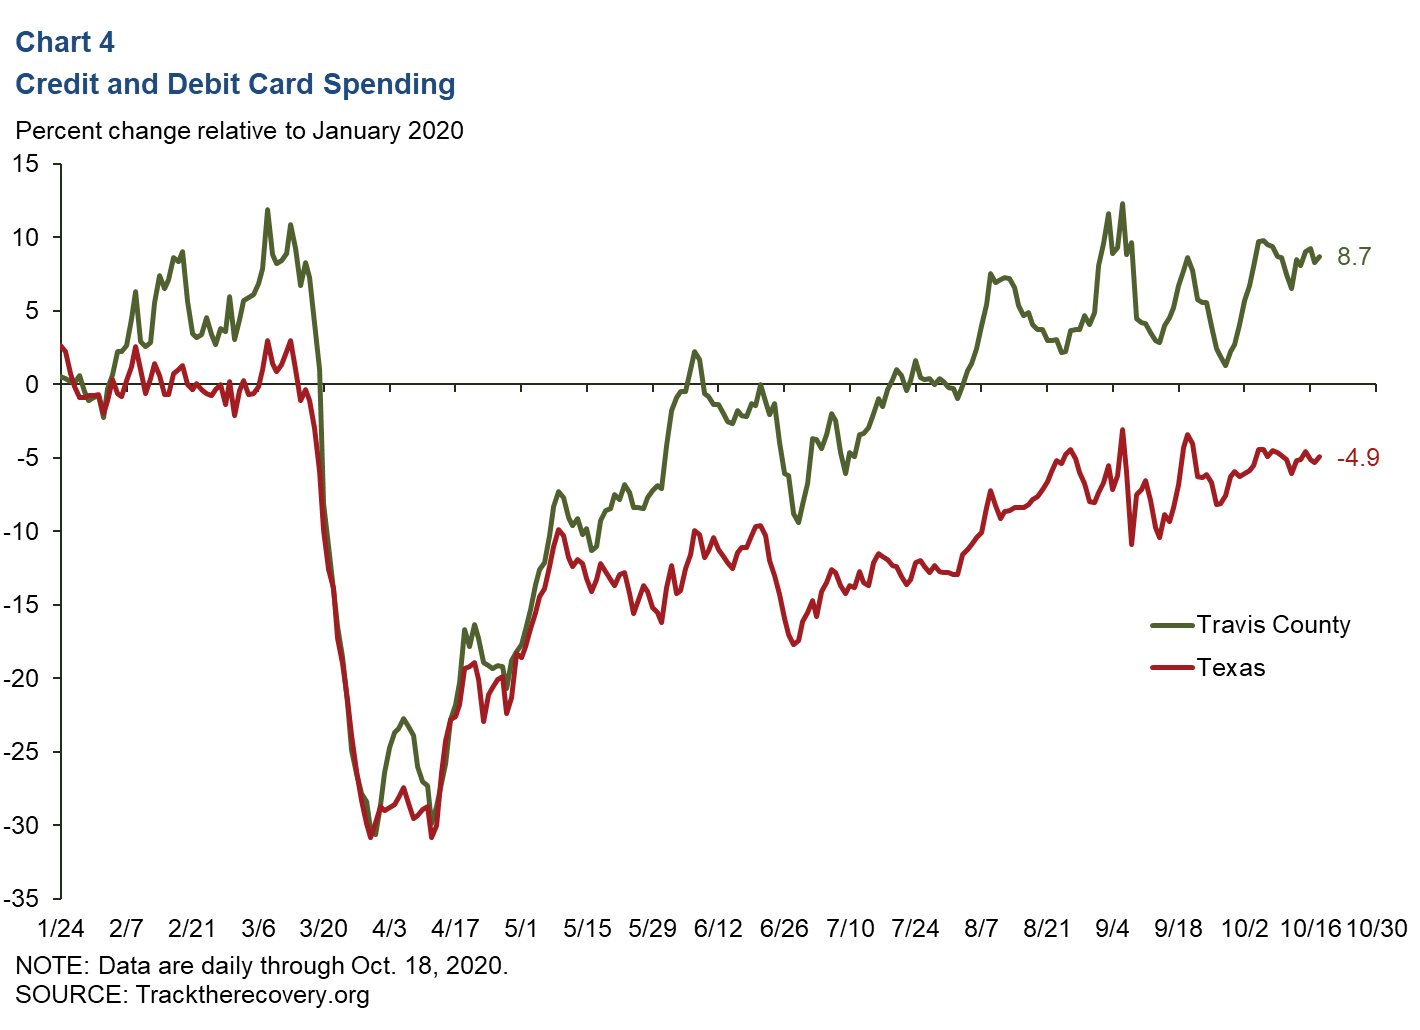
Since late July, consumer spending (measured by credit and debit card spending) in Travis County has remained above January 2020 levels. As of Oct. 18, spending in the county was up 8.7 percent relative to January, while spending in Texas was down 4.9 percent (Chart 4).
Real Estate
Year-to-Date Home Sales Robust
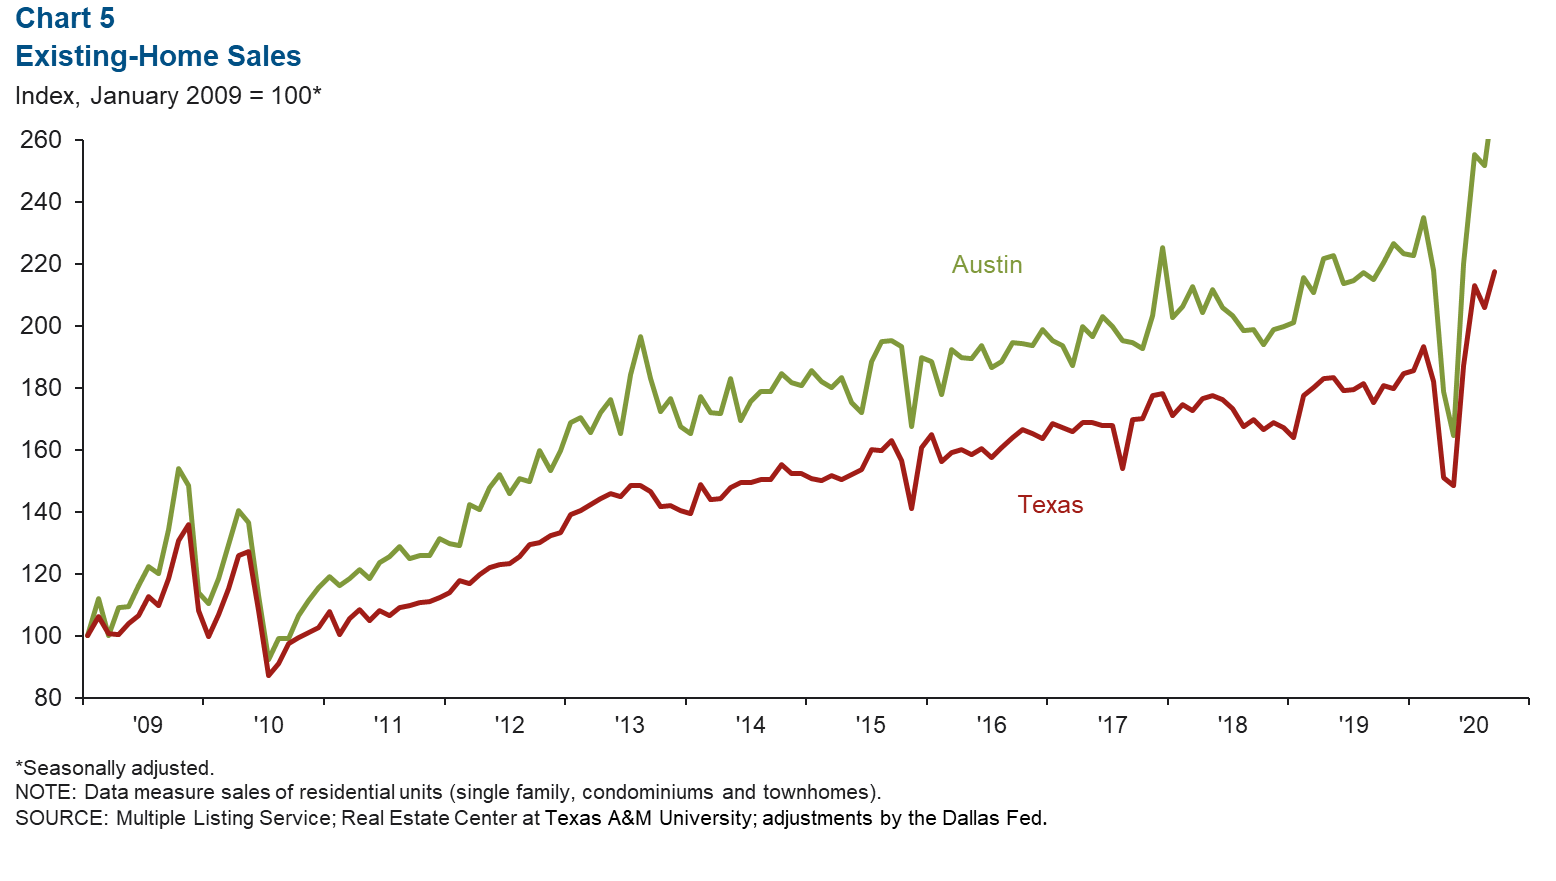
Existing-home sales in September expanded 9.6 percent in Austin and 5.6 percent in the state (Chart 5). In the first nine months of the year, the metro’s home sales are up 4.6 percent relative to the same period in 2019, slightly below the 5.1 percent growth in the state. The median price of homes sold in September was $358,425 in the metro, a 10.4 percent rise year over year, compared with $266,627 in Texas, an 8.5 percent gain.
Home Construction Permits Continue to Rise
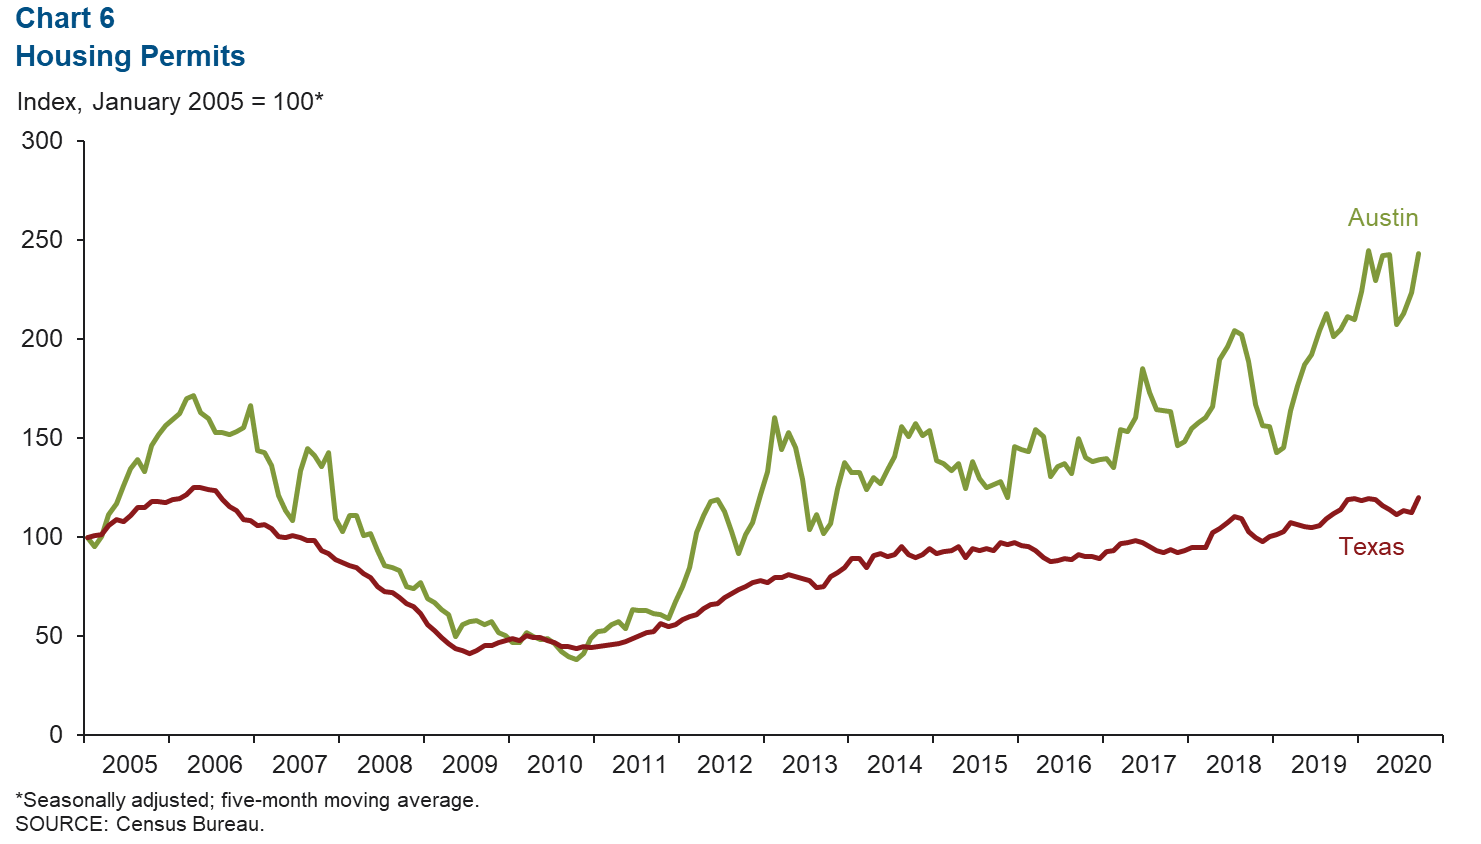
From August to September, the five-month moving average of total housing permits (single family and multifamily) strengthened 8.8 percent in Austin and 6.6 percent in Texas (Chart 6). Austin’s existing-home inventories ticked down to 1.1 months, the lowest level since the data series began in 1990 and considerably below the six months of supply considered to be a balanced market.
NOTE: Data may not match previously published numbers due to revisions.
About Austin Economic Indicators
Questions can be addressed to Judy Teng at judy.teng@dal.frb.org. Austin Economic Indicators is released on the first Thursday of every month.