Austin Economic Indicators

Austin economic activity accelerated in March. The Austin Business-Cycle Index grew at its fastest pace since late 2015, bolstered by strong employment growth over the first quarter of this year. The unemployment rate increased slightly but remained near a two-decade low. Regional real estate indicators point to robust housing growth, while manufacturing indicators suggest positive but moderating activity.
Austin Business-Cycle Index
The Austin Business-Cycle Index expanded at a 7.8 percent pace in March (Chart 1). This is above last year’s rate of 7.1 percent and the long-term average of 6 percent. March employment data were somewhat weaker than in the first two months of the year, however, as jobs declined slightly and the unemployment rate held steady.

Labor Market
Unemployment Rate Lowest Among Major State Metros
Austin’s unemployment rate held at a low 3.0 percent in March, near the 18-year low of 2.7 percent in October (Chart 2). The local labor force expanded at a strong 6.0 percent annualized pace in the first quarter, tied with Dallas for fastest expansion among the state’s large metro areas. The state and U.S. jobless figures held steady at 4.0 and 4.1 percent, respectively.

First-Quarter Job Growth Accelerates
Austin jobs grew at a healthy 4.9 percent annualized rate over the first quarter of the year (Chart 3). Growth was broad based, with the exception of declines in leisure and hospitality and health care. Construction and mining saw the fastest growth, with employment surging by nearly 15 percent. Professional and business services followed closely, adding 6,200 jobs over the quarter. Hiring at temp agencies was particularly strong, growing at a 12.3 percent rate. Trade, transportation and utilities jobs also expanded rapidly, primarily due to a 24.2 percent rise in wholesale trade employment.

Wage Growth Holding Steady
Hourly wages in Austin rose to a new high in March, and the three-month average of $28.92 was well above the U.S. and Texas averages (Chart 4). However, wage growth over the first quarter decelerated to a 1.1 percent annualized pace compared with 2.7 percent for 2017. This was also slower than the 2.7 percent growth nationally in the first quarter, though ahead of the 2.0 percent decline statewide.

Real Estate
March home sales in Austin picked up to 3,066, an increase from February and only 5 percent lower than an all-time high set in December 2017 (Chart 5). Year-to-date home sales were up over 8 percent in Austin relative to the first quarter of last year, compared with just 3 percent for the state overall. Austin home prices held relatively steady at $298,303, and home inventories remained very lean at 2.4 months’ supply.

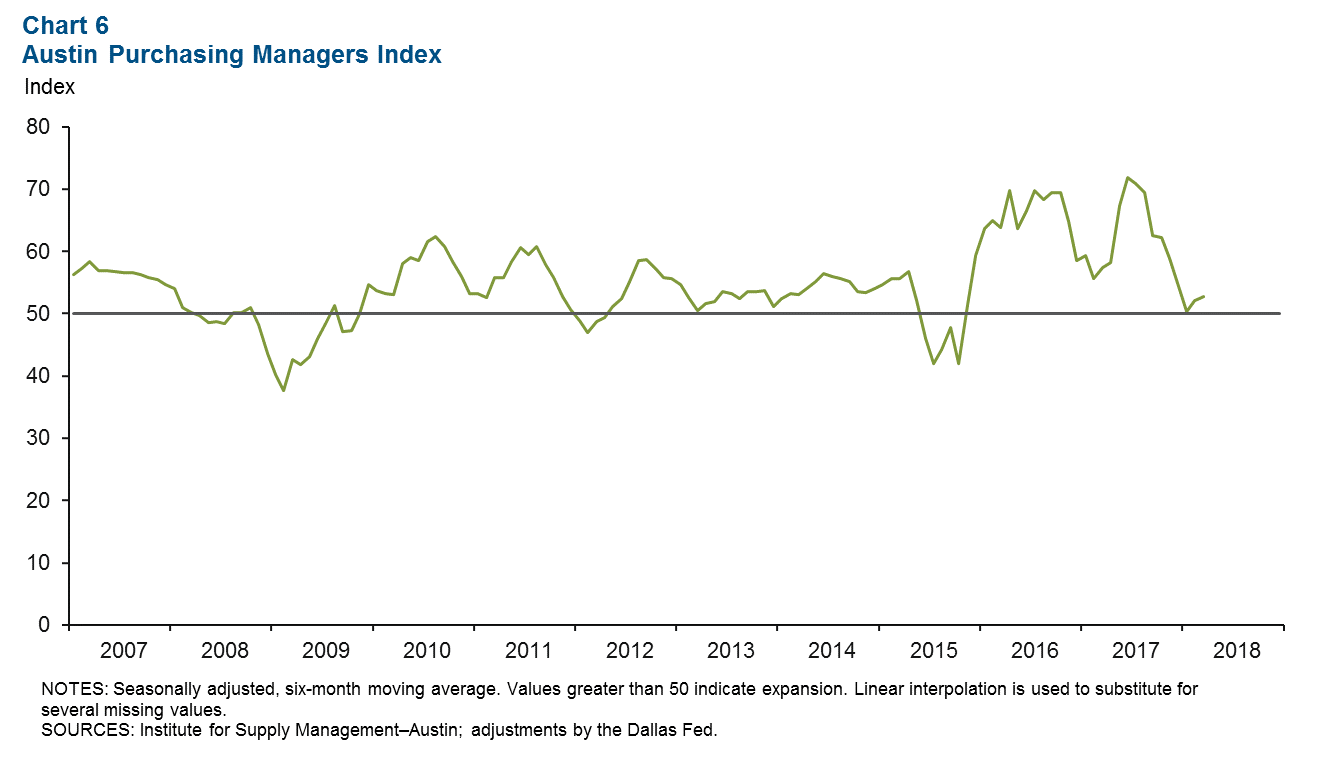
Austin Purchasing Managers Index
The Austin Purchasing Managers Index indicated continued but subdued growth in the area’s manufacturing sector (Chart 6). The six-month moving average of the headline index was 52.8 in March, indicating that on net, production, orders and employment indicators were rising across the firms surveyed. This moderate growth is reflected in manufacturing payroll employment, which was positive in the first quarter but decelerated slightly compared with last year.
NOTE: Data may not match previously published numbers due to revisions.
About Austin Economic Indicators
Questions can be addressed to Christopher Slijk at christopher.slijk@dal.frb.org. Austin Economic Indicators is released on the first Thursday of every month.