Energy Indicators

| Energy dashboard (February 2025) | |||
| WTI price avg. Jan. 27–Jan. 31 |
WTI price change from 4 weeks prior |
Henry Hub price avg. Jan. 27–Jan. 31 |
Henry Hub price change from 4 weeks prior |
| $73.31/barrel | 13% | $3.31/MMBtu | 4% |
Natural gas liquids production increased in 2024 as did exports. The number of U.S. chemical railcar loadings remained flat compared with last year. Intermediate chemical prices have risen in recent months, while chemical export numbers, adjusted for inflation, are on the decline.
Natural gas liquids
NGL production grows in 2024
U.S. ethane production increased 28 percent year to date in November 2024 to 3.0 million barrels per day, propane grew 15 percent during that time period to 2.2 mb/d, and butane rose 20 percent to 0.7 mb/d (Chart 1). Collectively called natural gas liquids (NGLs), these molecules have a wide range of uses such as inputs for petrochemical production and refining, general heating and cooking.
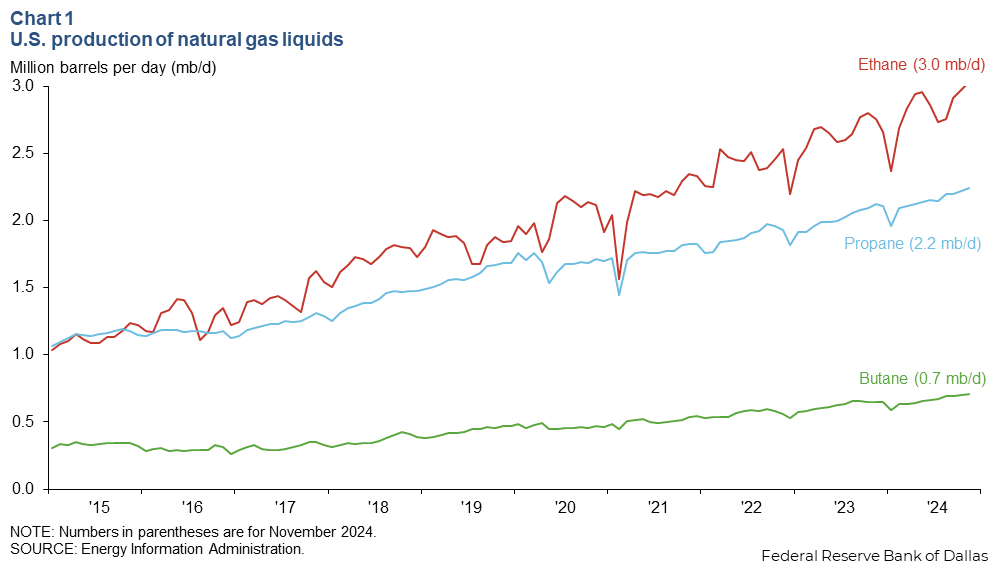
The rise in U.S. NGL production in 2024 was primarily because of an increase in associated gas production, including methane and other products, that are co-produced with oil from oil wells.
NGL exports trend higher
Exports of propane reached 2.01 mb/d in November 2024 while ethane notched 0.53 mb/d and butane reached 0.50 mb/d (Chart 2). Propane grew the most in total, increasing 0.23 mb/d year over year while ethane increased 0.13 mb/d and butane grew 0.06 mb/d.
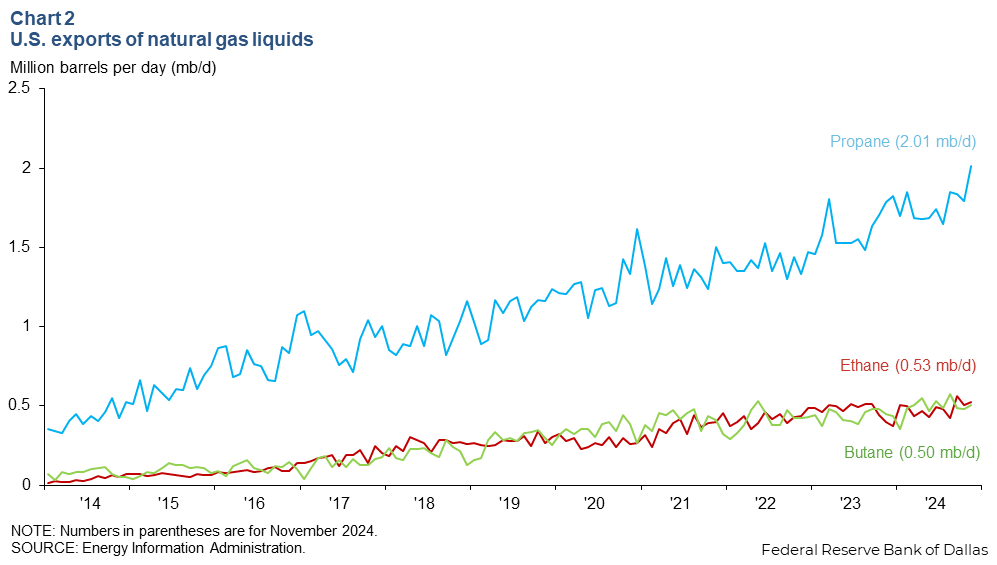
U.S. exports of propane mainly went to Japan, followed by China and South Korea. Among these three countries, Japan’s propane imports from the U.S. increased the most, by 0.18 mb/d year over year. Exports to Asia have increased in recent years due in part to the region’s demand for propylene, a chemical made from propane and used to manufacture ingredients such as propylene glycol and polypropylene used in the manufacture of myriad consumer products.
U.S exports of butane went to various countries including Morocco, Japan, Indonesia and Egypt. Morocco and Japan use butane for cooking and heating. In Morocco, increased urbanization and industrialization contributed to an increase in the country’s butane imports.
The largest share of ethane went to China as the nation’s petrochemical manufacturing demand for ethylene has increased substantially in recent years. There is significant ongoing investment in China to build infrastructure to support an expected surge in U.S. ethane imports. This is because, as a close substitute for heating and power consumption, ethane is tied to the price of natural gas. Since the fallout from Russia’s invasion of Ukraine significantly disrupted global LNG markets, LNG pricing in Asian markets has settled at around $12 to $16/MMBtu, four to eight times the price of domestic U.S. natural gas.
Chemicals
Growth in chemical railcars stabilizes
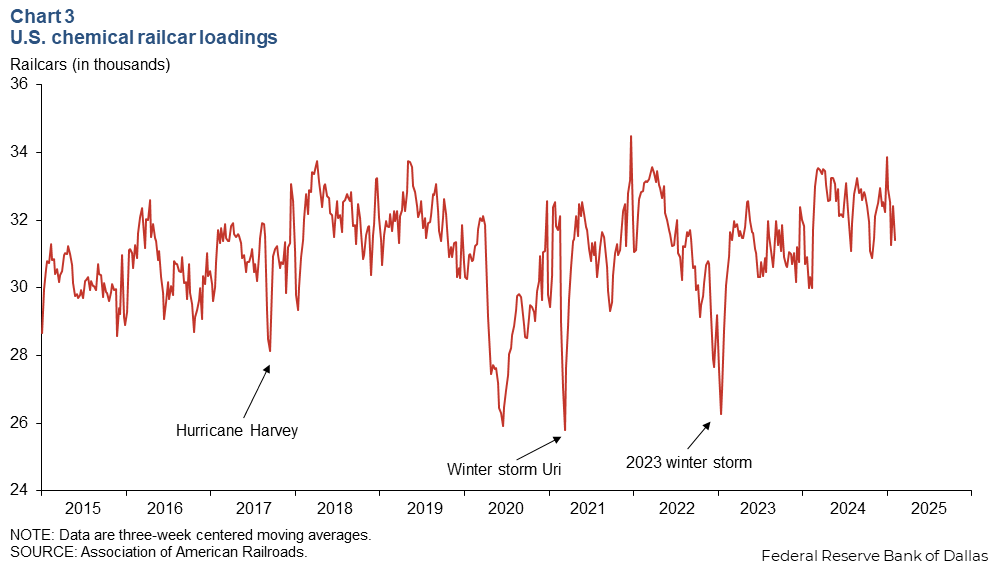
The pace of chemical railcar loadings has held nearly flat when compared with the same period in 2024, averaging 31,261 railcar loadings for the first week of 2025 compared with 30,901 loadings for the first week of 2024 (Chart 3). Chemical railcar loadings account for about 20 percent of chemical transportation by tonnage, with trucks, barges and pipelines carrying the rest, but railcars are well tracked and highly correlated with capacity utilization. That’s particularly true on the Gulf Coast, where over 75 percent of U.S. basic petrochemical manufacturing capacity is located. According to the Association of American Railroads, chemical carloads set a new annual record in 2024 as lower domestic natural gas price incented greater production.
Producer prices rise for major chemical intermediates
Over the three months ending January 2025, producer prices indexes for alkalis and chlorine rose 6.8 percent, while basic organic chemicals producer prices grew 6.4 percent, and plastics and resins producer prices grew 5.4 percent (Chart 4). On average in 2024, producer prices contracted 4.5 percent for alkalis and chlorine, 2.0 percent for plastics and resins and 1.4 percent for basic organic chemicals.
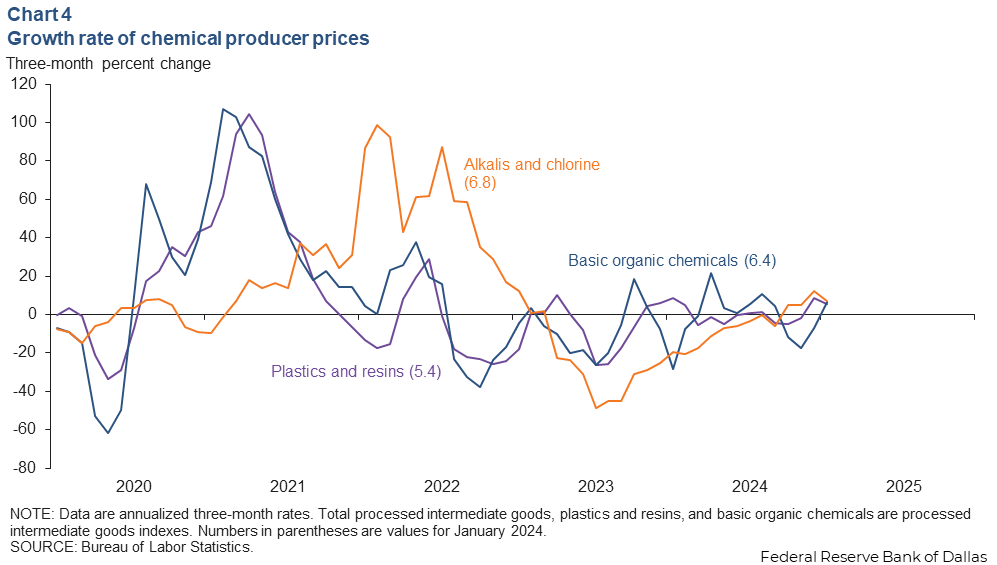
Chemicals in the chlor-alkali family are used for a range of manufacturing processes and products, including purified water, construction products (PVC pipes), aluminum, pharmaceuticals, and even corrugated boxes and consumer products (soap). That makes chlor-alkali chemicals important indicators for trends in industrial production. Plastics and resins (like polymers) are used for products like packaging materials, textile and industrial fibers, and biomedical devices. Basic organic chemicals, such as ethylene and benzene, are used to produce lots of different intermediate products (including plastic resins) that ultimately go into everything from grocery bags to car parts.
Intermediate chemical prices on the rise
The nominal price of ethane was 10.9 cents per pound in January 2025, while ethylene hit 33.4 cents per pound and Houston’s high-density polyethylene (HDPE) reached 42 cents per pound (Chart 5). While HDPE exhibited flat growth year over year, contracting 0.3 percent, ethane’s prices grew 28.5 percent and ethylene spiked up 72.2 percent.
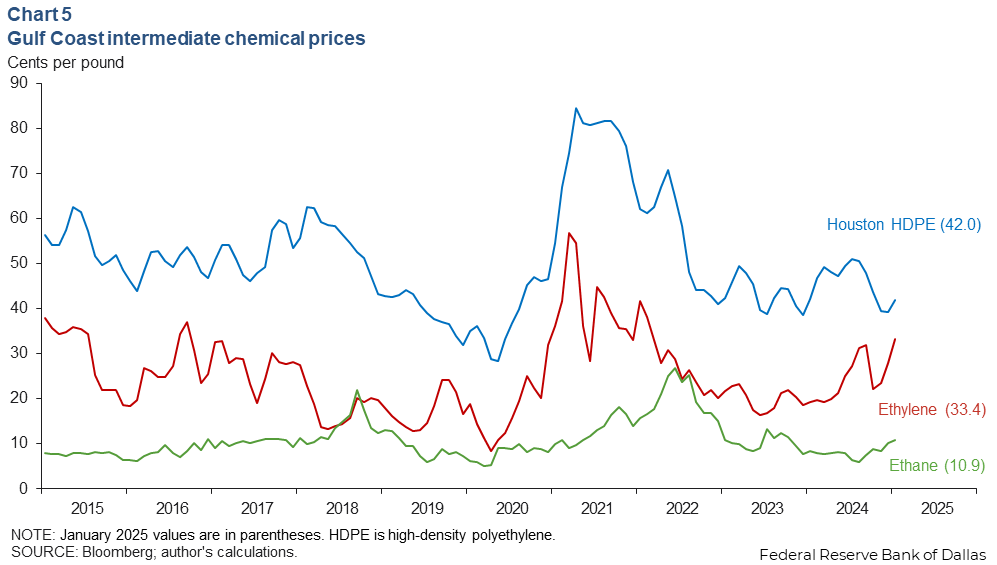
Ethane, which is tied to the price of natural gas in the U.S., is a low-cost feedstock here, giving the nation a comparative advantage over other global producers in Europe, Asia and the Latin American countries dependent on oil-derived feedstocks to produce chemical intermediates. A proxy for this cost advantage is the ratio of the price of Brent crude to Henry Hub natural gas, which fell to 24.5 in December 2024 versus 30.5 a year prior. According to industry feedback, a ratio over 7 translates into a significant export advantage.
Ethylene’s price factors vary and include, but are not limited to, production levels, input costs, energy (crude and natural gas) prices and geopolitical tensions. Higher prices in 2024 were associated with a number of planned and unplanned outages in ethylene capacity over the course of the year amid incremental increases in exports of ethylene.
Basic chemical exports on the decline
The inflation adjusted export value of basic chemicals was $6.1 billion in December 2024, $7.7 billion for other chemicals (excluding pharmaceuticals) and $2.9 billion for plastics and rubber products (Chart 6). Exports of basic chemicals shrunk 4.8 percent year over year and exports of plastics and rubber dropped 2.9 percent year over year. Exports of other chemicals grew 6.0 percent year over year.
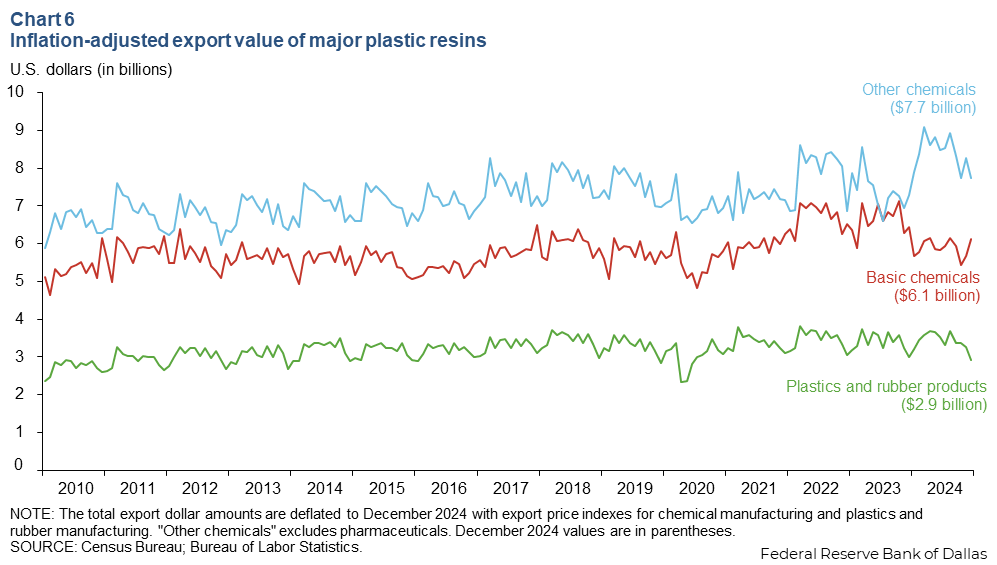
The leading destinations for U.S. chemical exports by dollar value in 2024 were Canada (13 percent), Mexico (11 percent) and China (9 percent). Texas is the top exporter of these chemicals in the U.S., accounting for roughly 20 percent of all chemical exports in 2024 (exclusive of pharmaceuticals).
About Energy Indicators
Questions can be addressed to Sasha Samperio at sasha.samperio@dal.frb.org. Energy Indicators is released monthly and can be received by signing up for an email alert. For additional energy-related research, please visit the Dallas Fed’s energy home page.