Energy Indicators

| Energy dashboard (January 2025) | |||
| WTI price avg. Dec. 30–Jan. 3 |
WTI price change from 4 weeks prior |
Henry Hub price avg. Dec. 30–Jan. 3 |
Henry Hub price change from 4 weeks prior |
| $73.15/barrel | 6.2% | $3.46/MMBtu | 19.1% |
U.S. exports of liquefied natural gas (LNG) are expected to continue to grow further into 2025. From October 2024 through the beginning of this year, heating oil prices remained fairly steady, while U.S. natural gas and propane prices increased. Propane prices in 2024 increased above 2023 levels. Residential power prices continue to be lower in Texas compared with the national average. ERCOT projects stable grid conditions through the end of this winter period, but the risks from winter storms remain elevated.
Natural gas
LNG exports expected to grow through 2025
The Energy Information Administration (EIA) reported LNG exports were 13.6 billion cubic feet per day (bcf/d) in December, and pipeline exports were 9.3 bcf/d (Chart 1). According to the EIA’s projections, the export share of U.S. dry gas production will rise from 22.0 percent in December 2024 to 23.5 percent in December 2025.
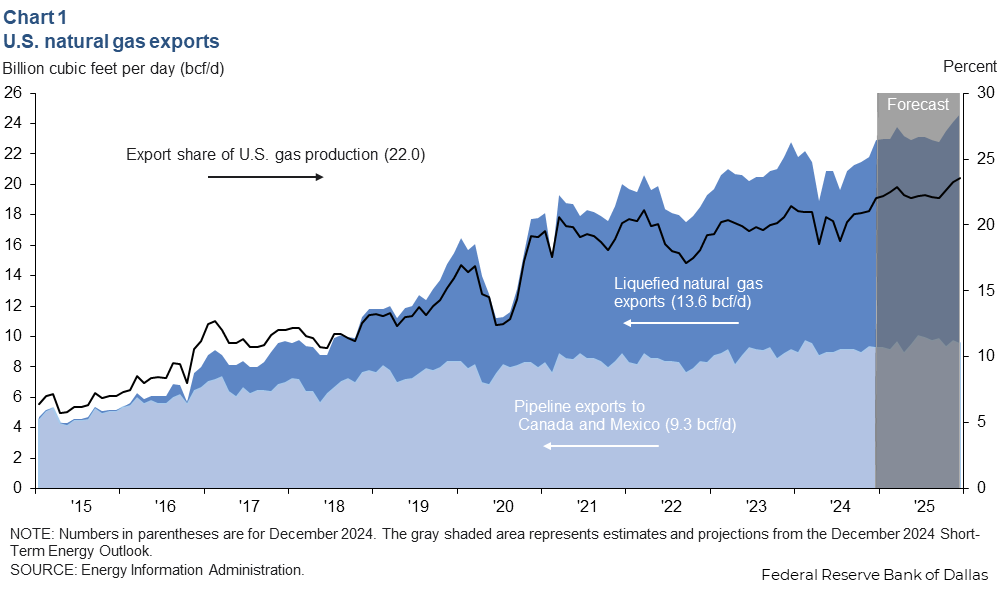
Plaquemines LNG—the newest U.S. export terminal—shipped its first cargo on Dec. 26, 2024. Once both phases of the Plaquemines terminal are completed and Corpus Christi’s LNG Stage 3 terminal begins shipping LNG exports, the EIA foresees LNG nominal production capacity to rise to 15.4 bcf/d by the end of 2025.
Global natural gas prices on the rise
Natural gas prices rose from January 2024 to January 2025, particularly in Europe where the Dutch TTF benchmark rose 35 percent year over year to $13.64 per million British thermal units (MMBtu) for the week ending Jan. 10 (Chart 2). Asian LNG, represented by the LNG Japan/Korea Marker benchmark, increased 26 percent to $14.15 MMBtu year over year for that same week, and Henry Hub rose 20 percent to $3.99 MMBtu. For context, Brent crude prices fell slightly—1 percent year over year.
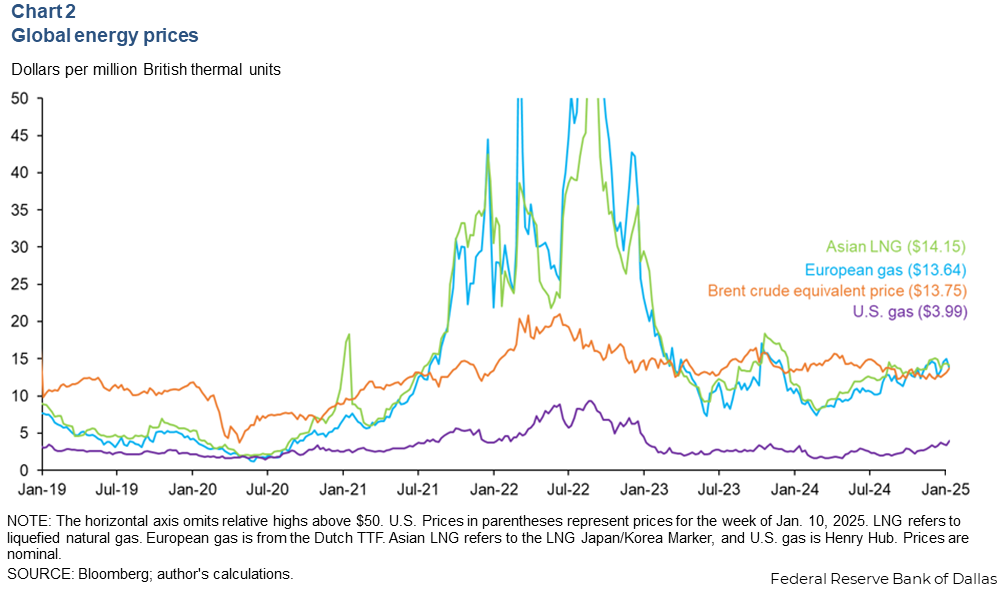
According to Bloomberg New Energy Finance, global LNG shortfalls are forecast through 2027 as the global economy will need to shoulder the burden of European demand without supply from Russian natural gas. All else equal, this would keep upward pressure on international natural gas benchmarks over that time.
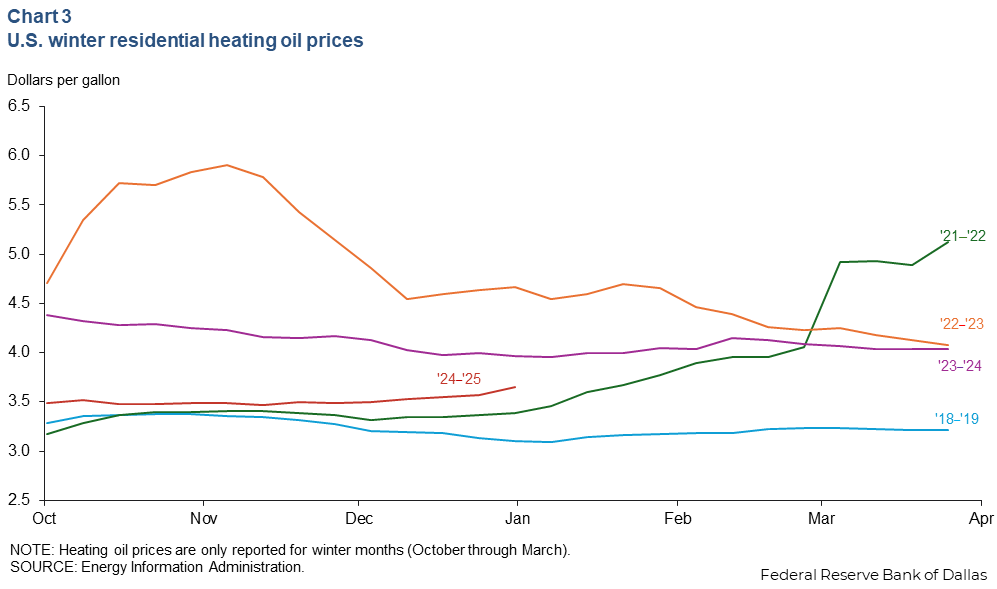
U.S. heating oil prices set to remain flat
U.S. heating oil prices have remained relatively flat compared with previous years’ winter-month periods, October through March (Chart 3). For the week of Jan. 6, 2025, U.S. residential heating oil prices were $3.65 per gallon. In the Northeast (PADD 1), which makes up 90 percent of domestic demand, heating oil prices were 3.67 per gallon. In the Midwest (PADD 2), prices were $3.24 per gallon. Lower heating oil prices are partly due to the declines in the cost of diesel, which was down about 10 percent year over year at the end of December.
U.S. propane prices rising above 2023 levels
U.S. residential propane prices have risen slightly in recent weeks. Prices rose 7 percent from the first week of October to the first week of January, hitting $2.58 per gallon for the week of Jan. 6 (Chart 4). The growth rate from the first week of October 2023 to the first week of January 2024 was only 5 percent.
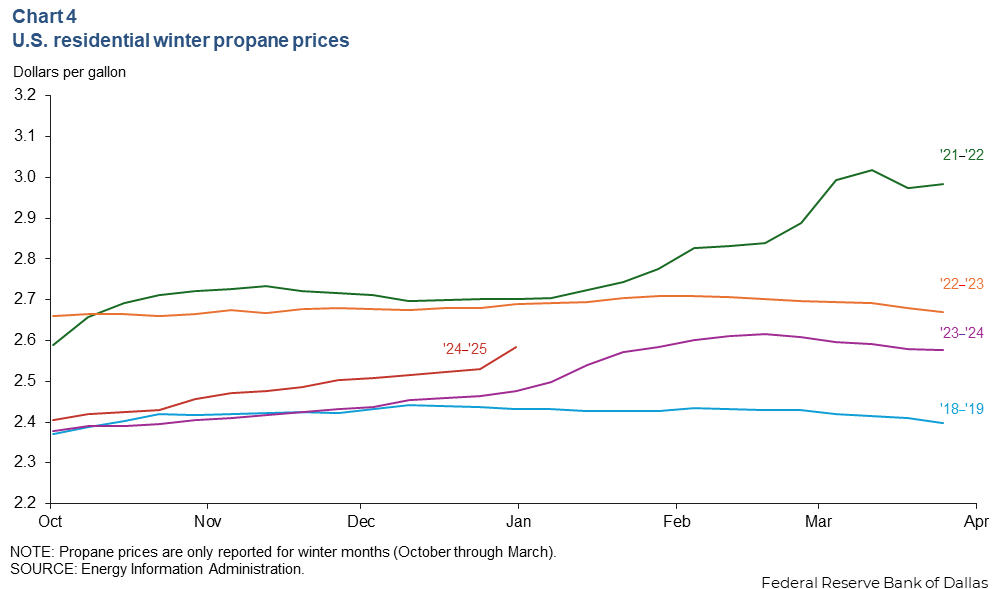
Like heating oil, U.S. propane heating demand is concentrated primarily in the densely populated Northeast. The price of propane in PADD 1 rose 5.5 percent to $3.47 per gallon from the beginning of October to the beginning of January. Wholesale propane prices for consumers in the Northeast are typically higher because they are farther away from the refineries and gas plants where the petroleum product is produced.
Electricity
Texas electricity rates still below national average
Inflation-adjusted (real) retail power prices for residential consumers in the state increased slightly last year, from a seasonally adjusted average of 14.1 cents per kilowatt hour (kWh) in January 2024 to a seasonally adjusted average of 14.4 cents/kWh in October 2024—a 2 percent increase (Chart 5). U.S. electricity prices rose from 15.6 cents/kWh in January 2024 to 15.7 cents/kWh in October 2024—a 1 percent increase.
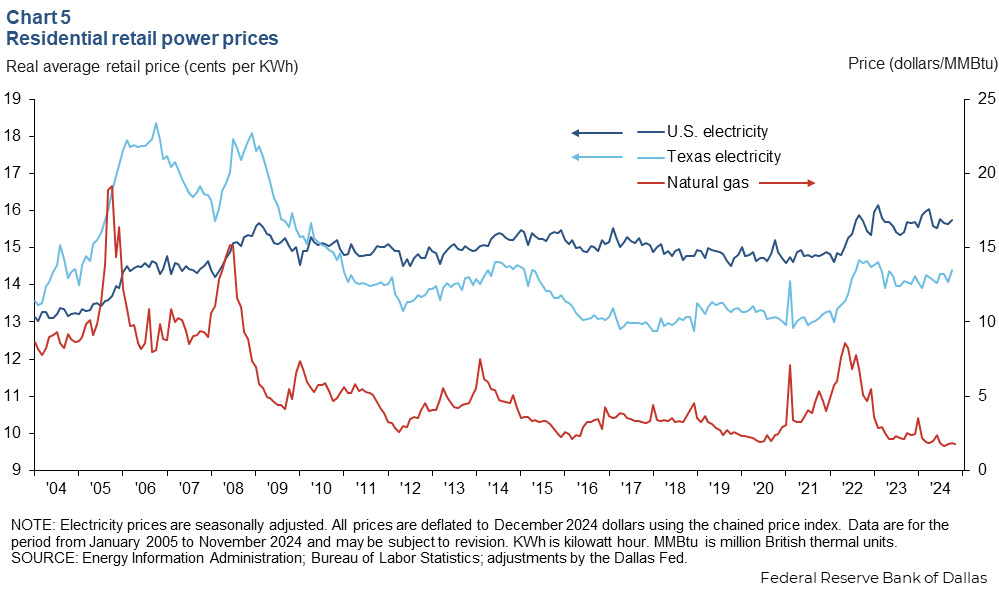
Natural gas prices declined from $3.50 per MMBtu in January 2024 to $1.80 per MMBtu in November 2024—a 48 percent decline. However, winter weather and rising LNG exports have caused natural gas prices to increase substantially since then. This natural gas price increase—along with heating demand in both power and natural gas markets—likely drove an increase in the cost of power to residents since.
Texas typically has lower power prices than the rest of the nation. The average price paid by residential customers per kWh in Texas was 9 percent lower than the national average. Texas’ average was 14.2 cents, while the U.S. average was 15.7 cents. All power prices have generally continued to drift upward since mid-2023 despite steady declines in natural gas costs. Historically, natural gas and residential power prices are heavily correlated, especially in Texas. However, in recent months, power prices have been more resilient.
Texas grid looks stable, though winter storm risks remain
Peak load for the Texas grid is expected to rise from 71.5 gigawatts (GW) in January to 75 GW in February (Chart 6). The Electric Reliability Council of Texas (ERCOT) projects that there is a low risk of it declaring an energy emergency alert for the months of January and February.
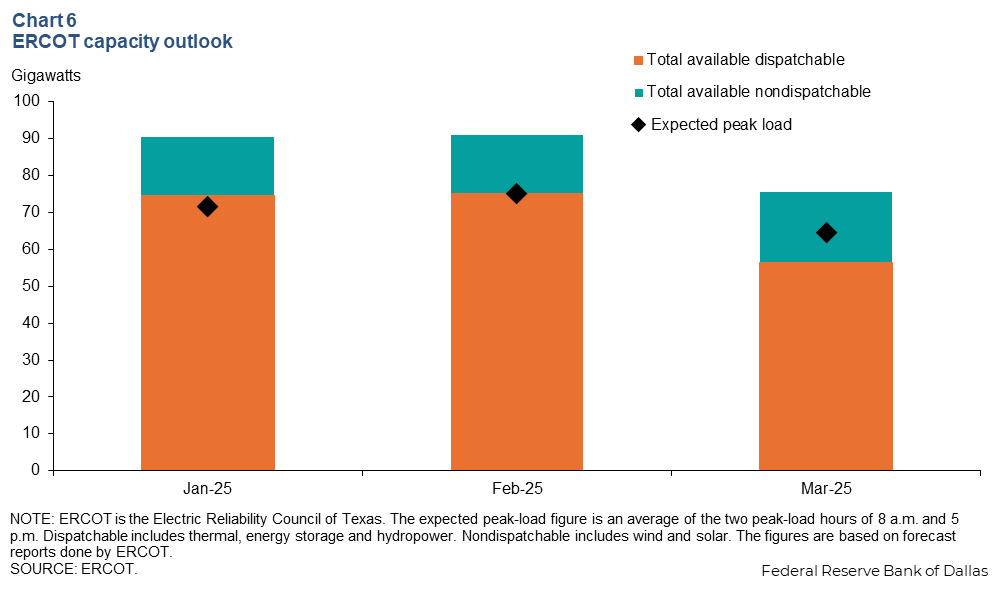
ERCOT’s Monthly Outlook for Resource Adequacy over the past three months highlighted the possibility of low wind production as a significant driver for risk to its reserves over that time frame. Winter risks are particularly elevated during the overnight and early morning hours when the temperatures are the lowest, solar generation hasn’t kicked in, and acute heating demand can outlast battery storage. In severe cold, even natural gas supplies can become strained as infrastructure freezes.
About Energy Indicators
Questions can be addressed to Sasha Samperio at sasha.samperio@dal.frb.org. Energy Indicators is released monthly and can be received by signing up for an email alert. For additional energy-related research, please visit the Dallas Fed’s energy home page.