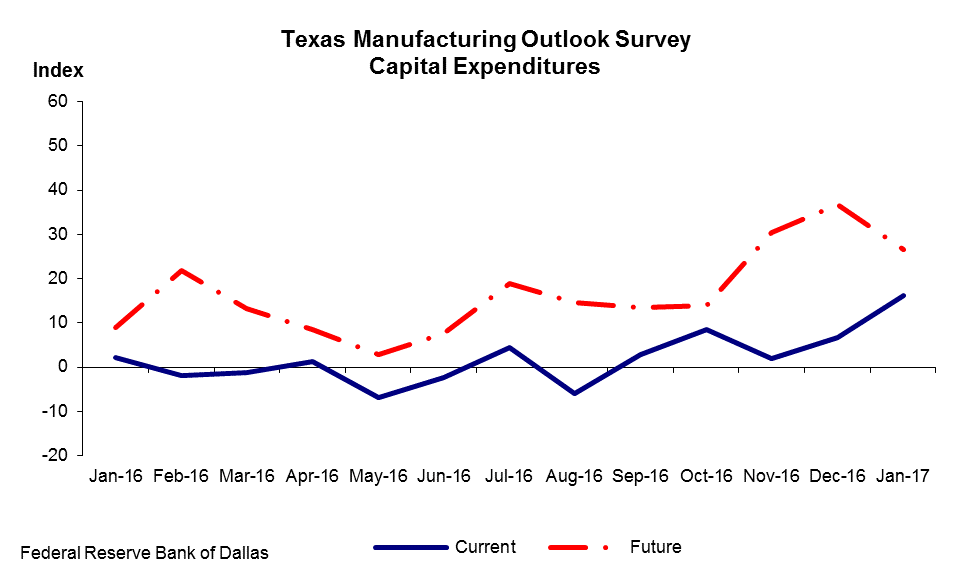
Capital Expenditures Index
January 2017

Capital Expenditures—Index
| Jan 16 | Feb 16 | Mar 16 | Apr 16 | May 16 | Jun 16 | Jul 16 | Aug 16 | Sep 16 | Oct 16 | Nov 16 | Dec 16 | Jan 17 |
Current Capital Expenditures, seasonally adjusted | ||||||||||||
2.2 | –1.9 | –1.3 | 1.2 | –6.9 | –2.4 | 4.5 | –6.0 | 2.9 | 8.6 | 2.0 | 6.7 | 16.3 |
Future Capital Expenditures, seasonally adjusted (six months from report period) | ||||||||||||
8.9 | 21.8 | 13.3 | 8.5 | 2.9 | 7.7 | 18.8 | 14.7 | 13.5 | 14.0 | 30.4 | 36.8 | 26.6 |
Capital Expenditures—Composition of Responses
| Jan 16 | Feb 16 | Mar 16 | Apr 16 | May 16 | Jun 16 | Jul 16 | Aug 16 | Sep 16 | Oct 16 | Nov 16 | Dec 16 | Jan 17 | |
Current Capital Expenditures, seasonally adjusted | |||||||||||||
% Increase | 15.7 | 15.5 | 13.9 | 13.5 | 13.1 | 13.9 | 12.2 | 9.6 | 13.8 | 17.2 | 11.3 | 17.2 | 23.0 |
% No Change | 70.8 | 67.0 | 70.8 | 74.2 | 66.9 | 69.8 | 80.1 | 74.8 | 75.4 | 74.1 | 79.4 | 72.2 | 70.3 |
% Decrease | 13.5 | 17.4 | 15.2 | 12.3 | 20.0 | 16.3 | 7.7 | 15.6 | 10.9 | 8.6 | 9.3 | 10.5 | 6.7 |
Future Capital Expenditures, seasonally adjusted (six months from report period) | |||||||||||||
% Increase | 24.1 | 28.2 | 23.8 | 20.2 | 18.6 | 18.3 | 27.1 | 24.5 | 25.2 | 29.9 | 37.1 | 41.7 | 35.2 |
% No Change | 60.7 | 65.5 | 65.7 | 68.1 | 65.7 | 71.2 | 64.6 | 65.7 | 63.1 | 54.2 | 56.2 | 53.4 | 56.2 |
% Decrease | 15.2 | 6.4 | 10.5 | 11.7 | 15.7 | 10.6 | 8.3 | 9.8 | 11.7 | 15.9 | 6.7 | 4.9 | 8.6 |
NOTE: Survey responses are used to calculate an index for each indicator. Each index is calculated by subtracting the percentage of respondents reporting a decrease from the percentage reporting an increase. When the share of firms reporting an increase exceeds the share of firms reporting a decrease, the index will be greater than zero, suggesting the indicator has increased over the prior month. If the share of firms reporting a decrease exceeds the share reporting an increase, the index will be below zero, suggesting the indicator has decreased over the prior month. An index will be zero when the number of firms reporting an increase is equal to the number of firms reporting a decrease. Items may not add up to 100 percent because of rounding.