El Paso Economic Indicators
September 20, 2023
| El Paso economy dashboard (August 2023) | |||
| Job growth (annualized) May–Aug. '23 |
Unemployment rate |
Avg. hourly earnings |
Avg. hourly earnings growth y/y |
| -0.1% | 4.6% | $22.86 | 3.1% |
El Paso’s employment declined in August. In addition, the business-cycle index edged down, the unemployment rate remained flat, and job postings continued to decline. Both U.S. and Mexico industrial production rose, but U.S. auto production and sales decreased.
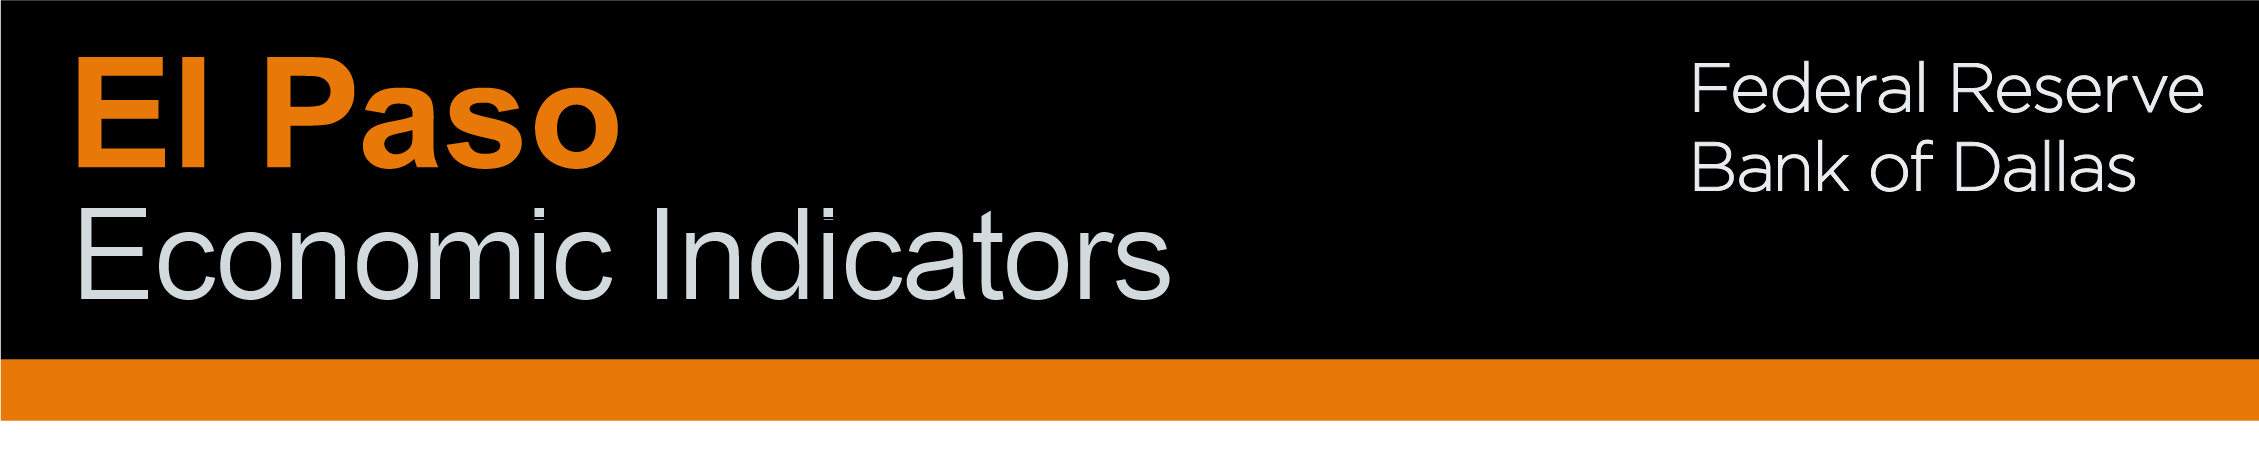
Business-cycle index
In August, El Paso’s business-cycle index ticked down to 160.5 from 160.8 in July (Chart 1). The index was up 2.9 percent from last year.
Labor market
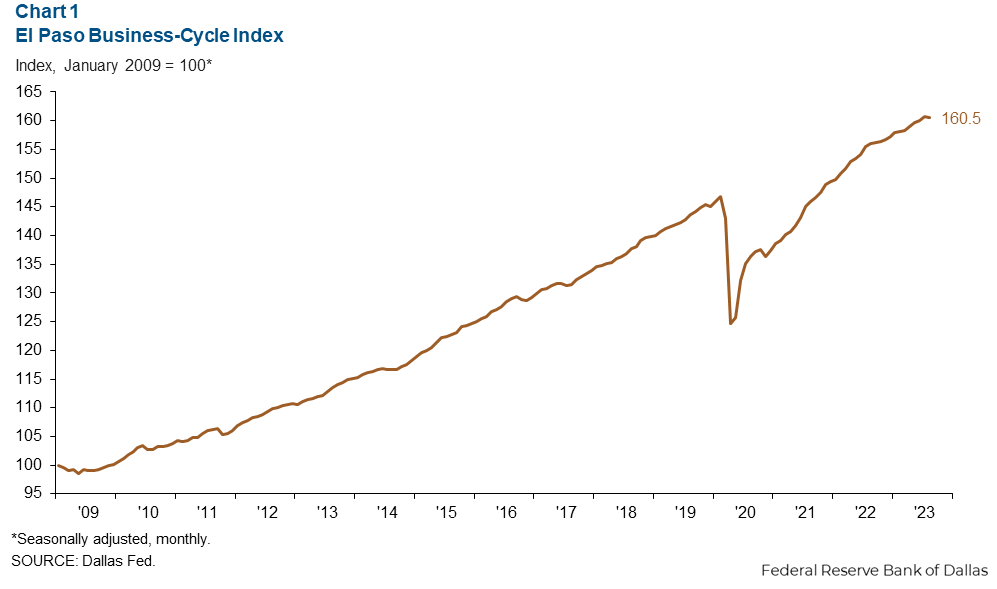
Payrolls contract
Employment fell an annualized 6.0 percent in August (1,757 jobs) (Chart 2). Losses were greatest in professional and business services (982), government (806), and education and health services (394). Among sectors that gained jobs, leisure and hospitality saw the most growth (576).
Total nonfarm employment has expanded 1.2 percent year to date (2,773 jobs). Government (1,891), education and health services (1,610), and leisure and hospitality (977) added the most jobs on net. The only sectors that lost jobs were professional and business services (2,956) and manufacturing (508).
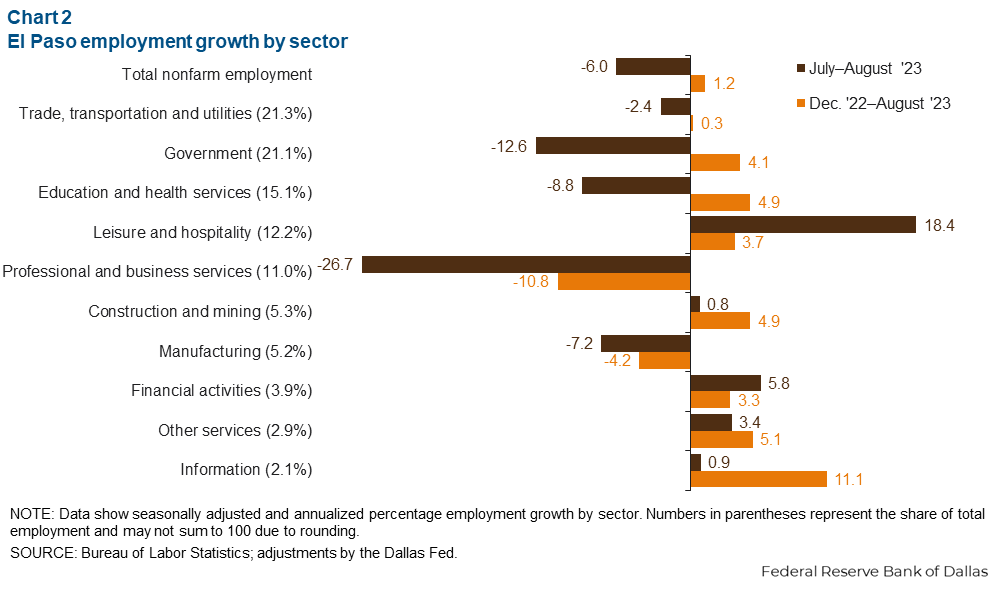
Unemployment rate stays flat
El Paso’s unemployment rate was 4.6 percent in August (Chart 3). The July unemployment rate was revised from 5.4 percent to 4.6 percent. Meanwhile, August unemployment was 4.1 percent in Texas—unchanged from July—and 3.8 percent in the nation.
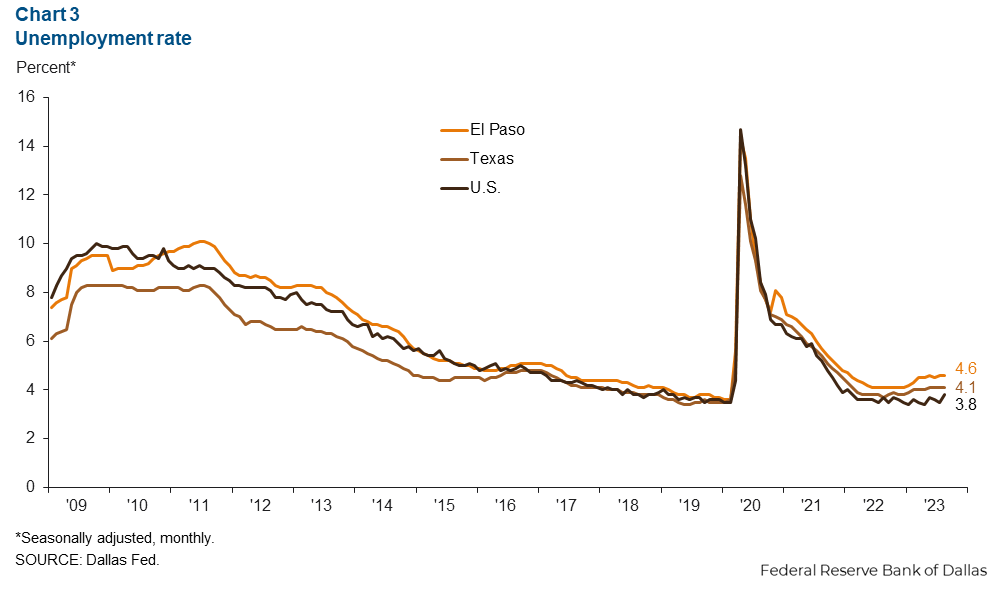
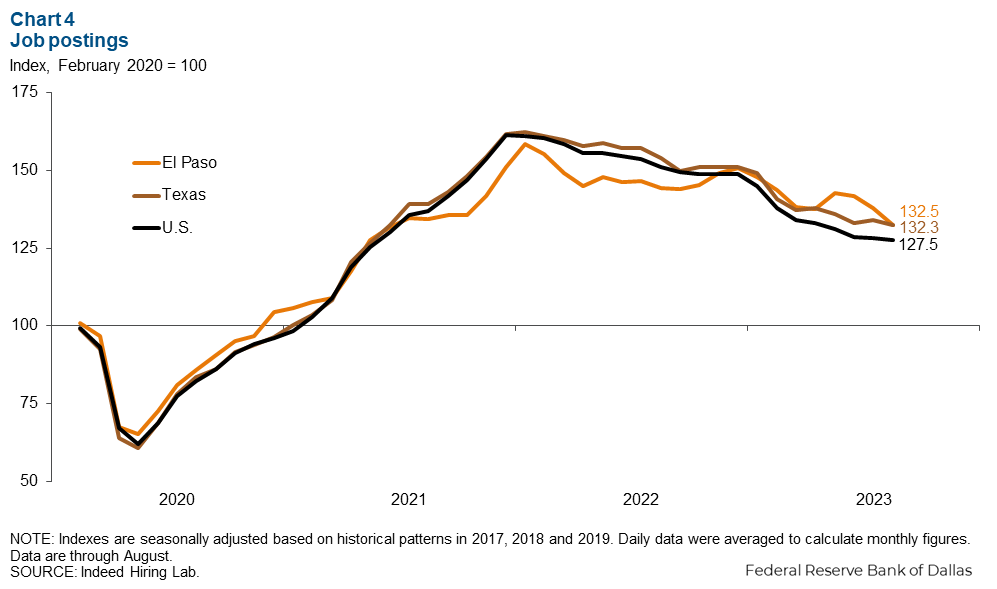
Job postings continue to fall
El Paso’s Indeed Job Postings Index dropped 3.9 percent in August (Chart 4). The index fell 1.3 percent in Texas and 0.5 percent in the U.S. Job postings have steadily decreased since January 2022 for El Paso, Texas and the U.S.
Industrial production and maquiladora-related activities
The U.S. industrial production index rose 0.4 percent in August and was up 0.2 percent from August 2022 (Chart 5). The Institute for Supply Management (ISM) index increased 1.2 points in August to 47.6 but was down 5.3 points from last August. ISM indexes below 50 signal contraction in the manufacturing sector. Meanwhile, Mexico’s IP index grew 0.5 percent in July and was up 4.9 percent from July 2022.
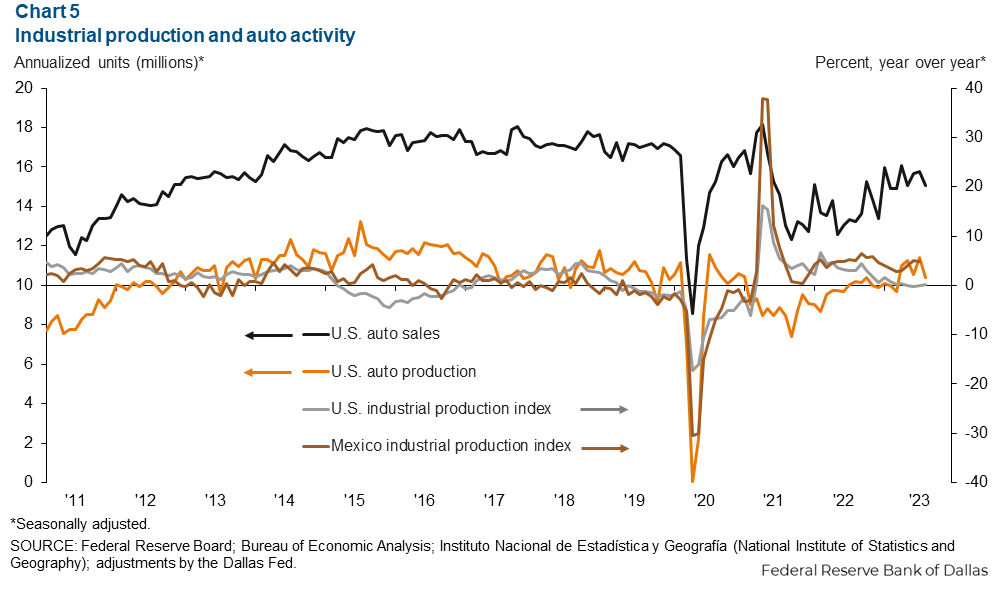
U.S. monthly auto production decreased by an annualized 1 million units in August, and sales fell by an annualized 712,000 units. Production has increased 2.1 percent from last August, while sales have increased 13.6 percent. Industrial and auto activity are closely linked to the El Paso-area economy because of cross-border manufacturing relationships. Roughly half of the maquiladoras in Juárez are auto related.
NOTE: Data may not match previously published numbers due to revisions. The El Paso metropolitan statistical area includes El Paso and Hudspeth counties.
About El Paso Economic Indicators
Questions or suggestions can be addressed to Aparna Jayashankar at Aparna.Jayashankar@dal.frb.org. El Paso Economic Indicators is published every month after state and metro employment data are released.