El Paso Economic Indicators
June 21, 2023
| El Paso economy dashboard (May 2023) | |||
| Job growth (annualized) Feb.–May '23 |
Unemployment rate |
Avg. hourly earnings |
Avg. hourly earnings growth y/y |
| 2.2% | 4.8% | $22.77 | 4.8% |
El Paso’s employment grew slightly and its business-cycle index inched up during May. However, the unemployment rate rose and imports and exports cooled. U.S. auto production edged up, while sales fell.
Business-cycle index
The El Paso Business-Cycle Index increased an annualized 2.3 percent in May. It is up 2.4 percent from May 2022.

Labor market
Jobs up in leisure and hospitality, down in manufacturing
Payrolls grew an annualized 1.0 percent in May (286 jobs) (Chart 2). Gains were concentrated in leisure and hospitality (279) and professional and business services (178). Manufacturing (144) and construction and mining (103) lost jobs.
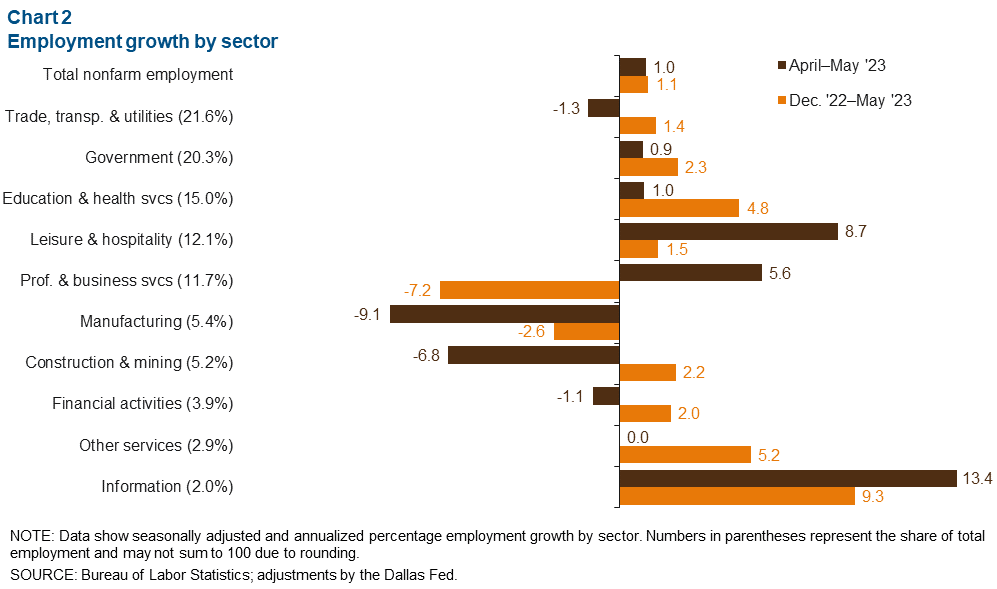
Total nonfarm employment has grown 1.1 percent year to date (1,576 jobs). Employment increased across all sectors except professional and business services (-1,226) and manufacturing (-200). Education and health services (967) and government (639) added the most jobs on net.
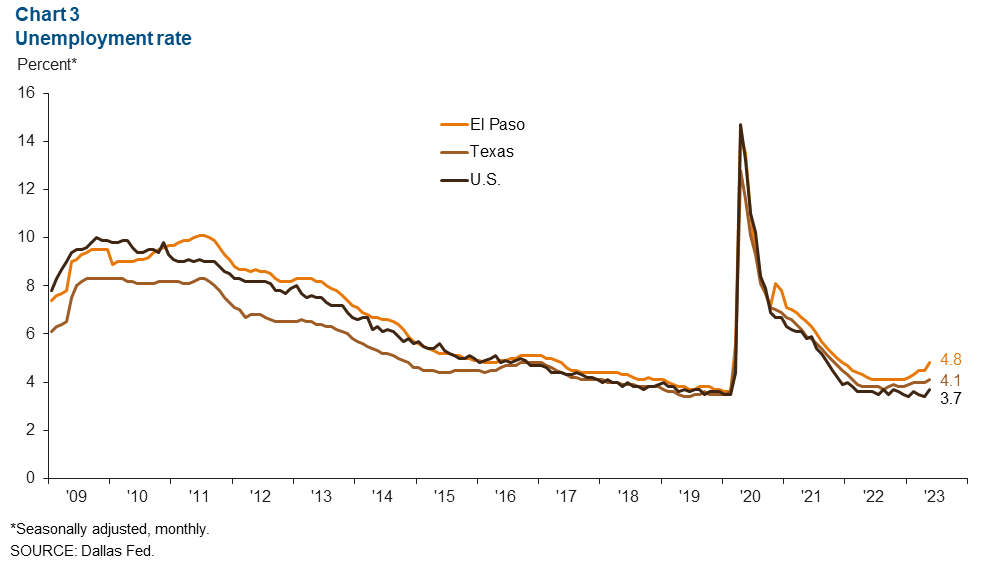
Unemployment rate rises in May
El Paso’s unemployment rate increased from 4.5 percent in April to 4.8 percent in May (Chart 3). Unemployment has climbed from last May, when it was 4.2 percent. It remains above the rates in Texas (4.1 percent) and the U.S. (3.7 percent).
Trade volume
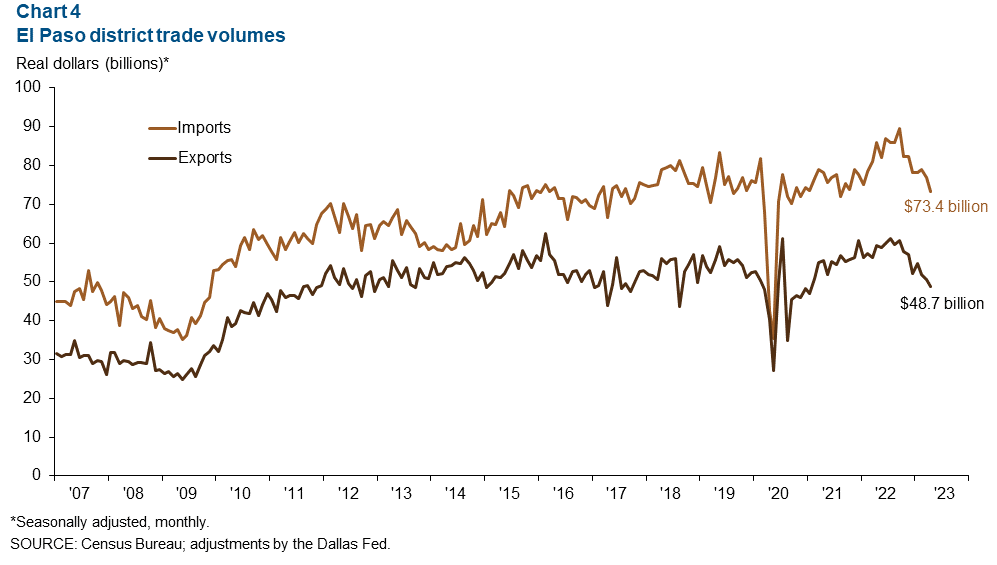
The El Paso district’s trade volume has cooled, falling in line with prepandemic levels (Chart 4). In April, an annualized $122.1 billion in trade passed through the El Paso district, down 15.9 percent from April 2022. Exports fell 17.9 percent from last year, and imports dropped 14.6 percent. Total trade volume peaked in September 2022, reaching an annualized $150.1 billion. Trade primarily flowed through the ports of Ysleta (62 percent), Santa Teresa (19 percent) and El Paso (18 percent).
Industrial production and maquiladora-related activities
The monthly U.S. industrial production (IP) index fell 0.2 percent in May but is up 0.2 percent from May 2022 (Chart 5). The Mexico IP index rose 0.4 percent in April and is up 1.6 percent from April 2022. The Institute for Supply Management (ISM) manufacturing index continued its downward trend in May, falling 0.2 percentage points to 46.9. ISM indexes below 50 signal contraction in the manufacturing sector.
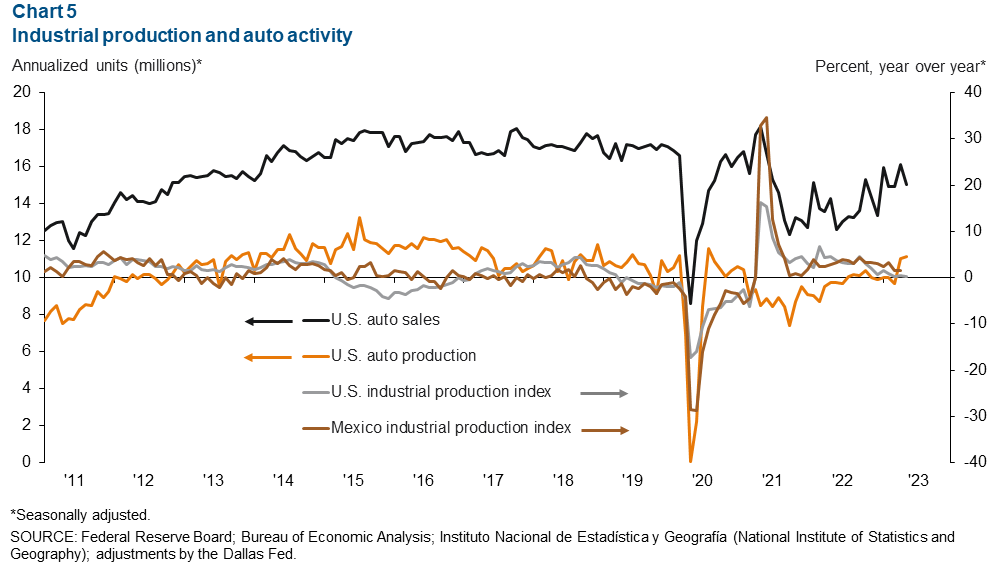
In May, U.S. monthly auto production increased by an annualized 77,100 units, while sales dropped by an annualized 1 million units. Production and sales grew 14.3 percent and 19.6 percent, respectively, compared with last May. Industrial and auto activity are closely linked to the El Paso-area economy because of cross-border manufacturing relationships. Roughly half of maquiladoras in Juárez are auto related.
NOTE: Data may not match previously published numbers due to revisions. The El Paso metropolitan statistical area includes El Paso and Hudspeth counties.
About El Paso Economic Indicators
Questions or suggestions can be addressed to Aparna Jayashankar at Aparna.Jayashankar@dal.frb.org. El Paso Economic Indicators is published every month after state and metro employment data are released.