El Paso Economic Indicators

March 16, 2022
El Paso’s economic expansion resumed in January after pausing in December. The metro’s business-cycle index rose, and its labor market posted gains. Housing permits were relatively flat, and existing-home inventories remained low. Trade volumes dipped in January. However, industrial production strengthened, and manufacturing activity continued to expand.
Business-cycle index
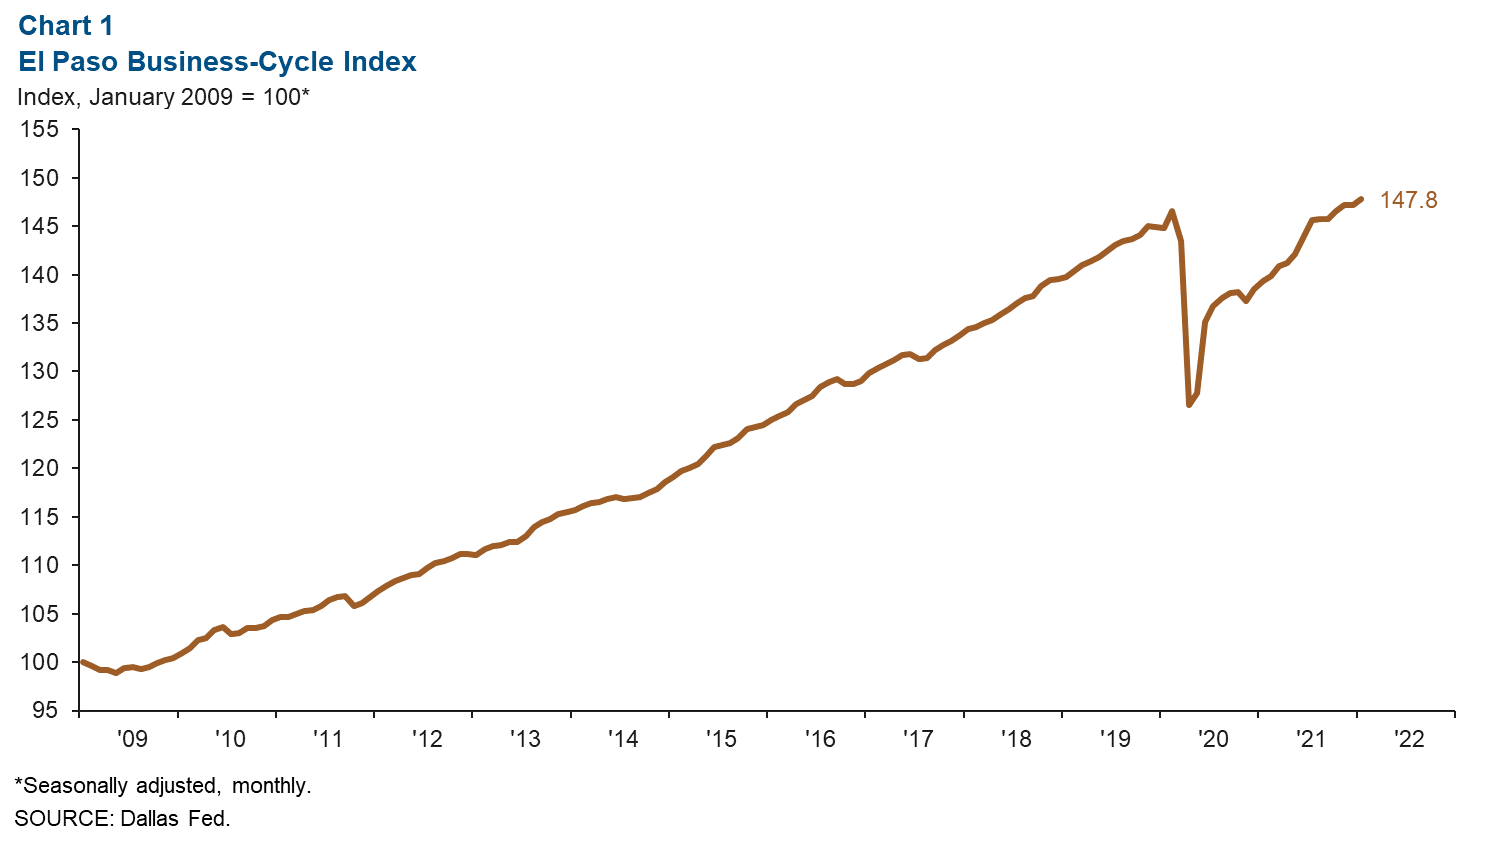
The El Paso Business-Cycle Index rose an annualized 5.4 percent in January after falling 0.1 percent in December (Chart 1). Compared with prepandemic levels (February 2020), the index has recovered and is up 0.9 percent.
Labor market
In January, payroll employment in the metro rose an annualized 4.6 percent, or by 1,213 jobs (Chart 2). Job gains were widespread but largely driven by growth in the education and health services (620 jobs), leisure and hospitality (202) and government (112) sectors. Employment was little changed in the manufacturing (29) and other-services (-13) sectors.
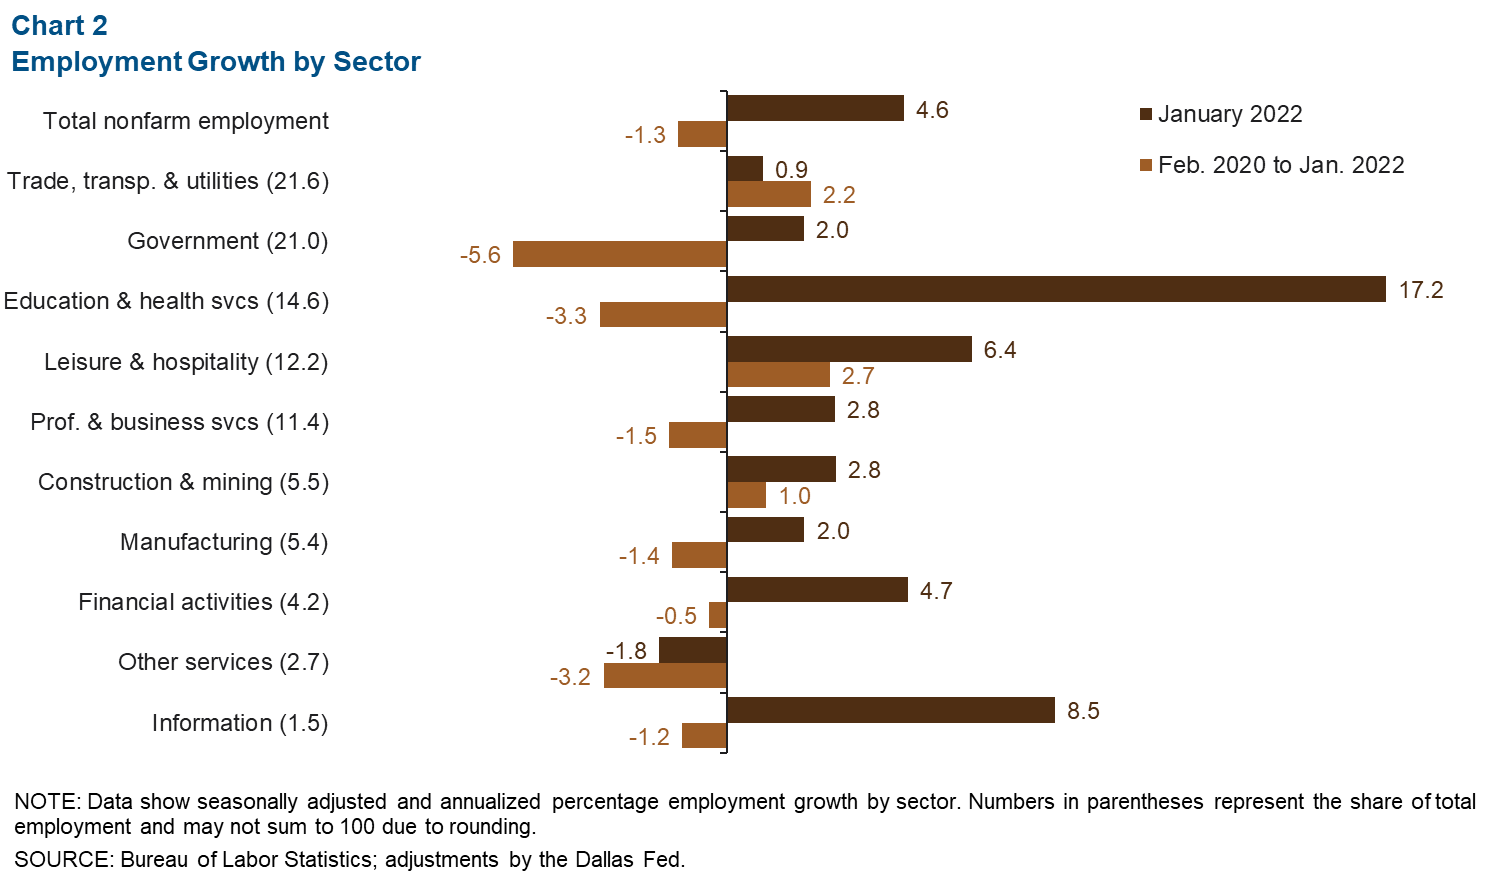
Since the onset of the pandemic and through January 2022, metro employment is down 1.3 percent, a net loss of 4,145 jobs. Payrolls are down by 4,001 positions in the government sector, 1,619 in education and health services, and 558 in professional and business services. The sectors with employment above February 2020 levels include trade, transportation and utilities (1,486 jobs), leisure and hospitality (1,028) and construction and mining (178).
El Paso’s and Texas’ unemployment rates remained at 5.0 and 4.8 percent, respectively, in January. The U.S. figure declined from 4.0 percent to 3.8 percent in February.
Housing permits
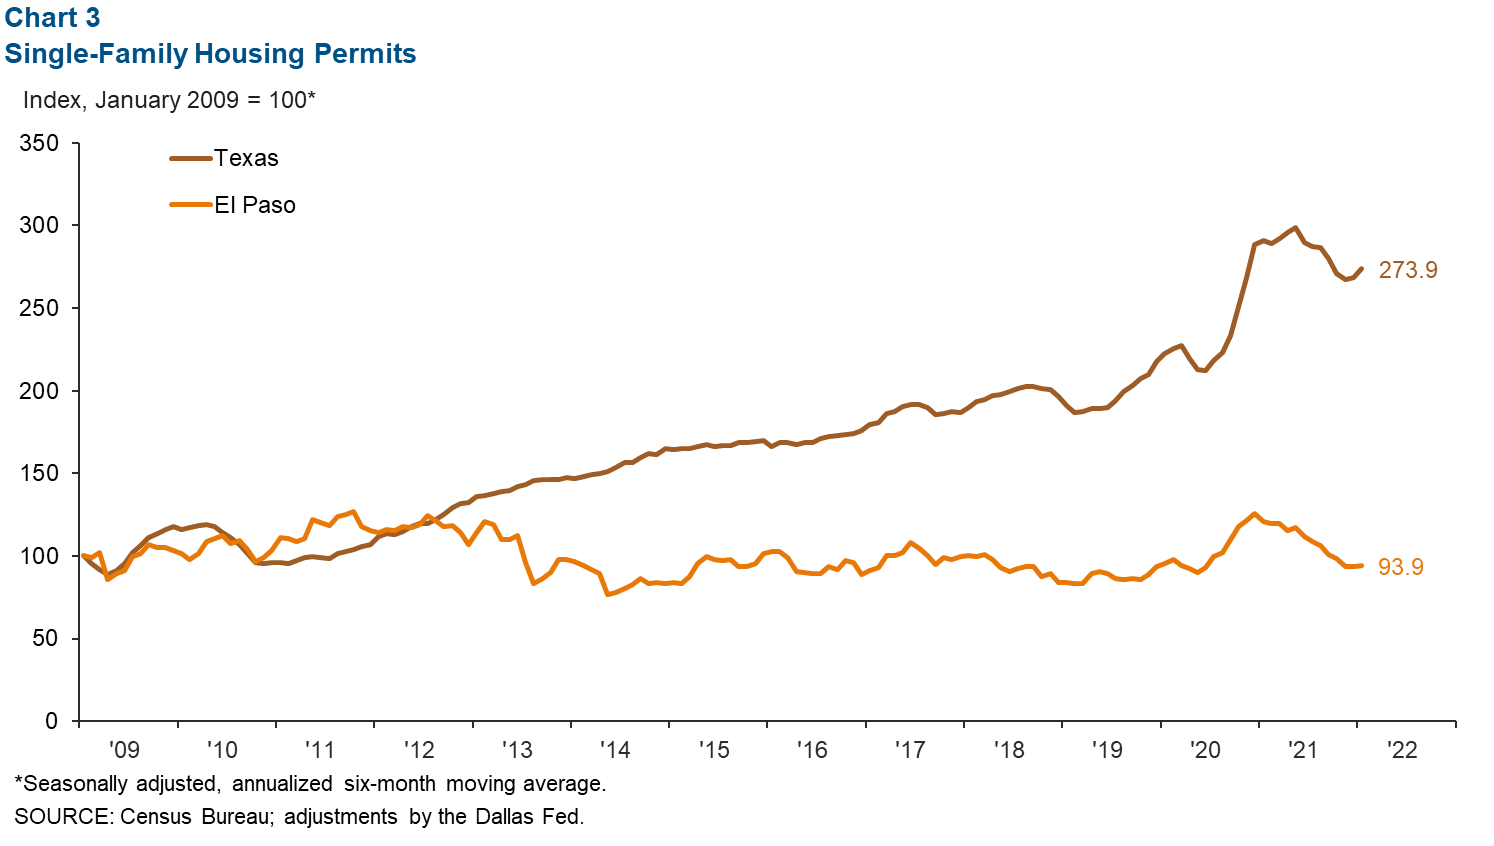
El Paso housing permits increased an annualized 0.5 percent in January on a six-month moving-average basis, compared with the state’s 2.0 percent gain (Chart 3). However, housing permits were down 22.3 percent from the prior January in the metro and down 5.9 percent statewide. Existing-home inventories totaled 1.1 months, well below the six months of supply associated with a balanced market.
Trade
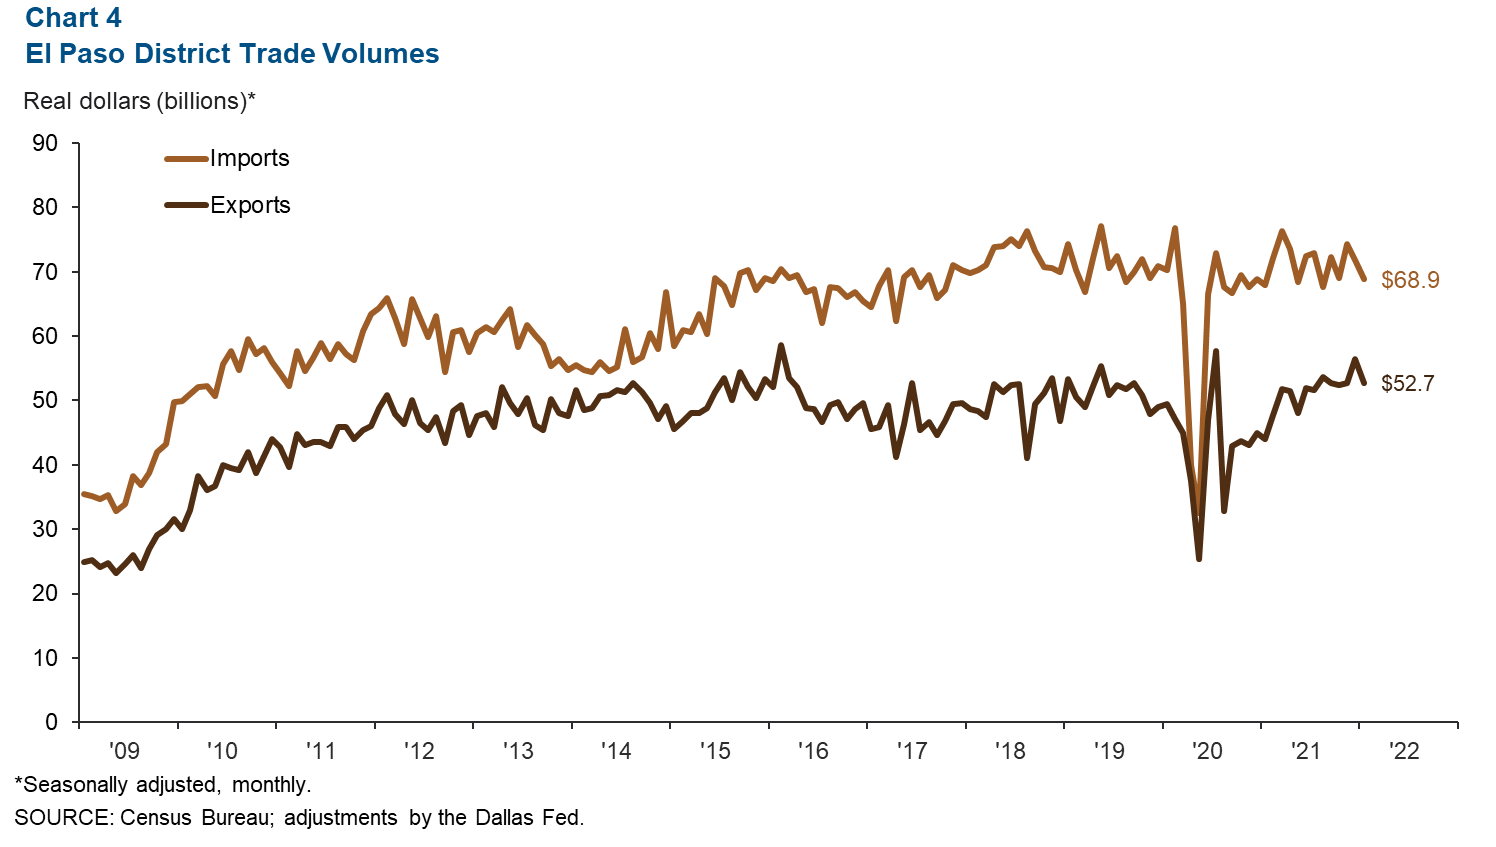
Annualized monthly trade through the El Paso Trade District fell 5.2 percent to $121.6 billion in January (Chart 4). The decrease was driven by export declines of 6.5 percent and import declines of 4.1 percent. Most trade through the El Paso district came through the Ysleta port (54 percent), followed by the Santa Teresa port at 25 percent and the El Paso port at 20 percent.
Industrial production and maquiladora-related activities
The monthly U.S. industrial production (IP) index rose from 102 in December to 103.5 in January and was up 4.1 percent from a year ago (Chart 5). Mexico’s IP index also edged up, from 100.2 in December to 101.2 in January and was 4.3 percent higher than a year ago. The Institute for Supply Management (ISM) manufacturing index rose from January’s 57.6 percent to 58.6 percent in February but was down 2.3 percentage points from a year ago. However, the figure remains above 50, indicating expansion in the manufacturing sector. Comments from ISM panelists indicate a possible recovery in March from the effects of the COVID-19 omicron variant and note sustained strength in demand. But the manufacturing industry continues to face above-trend turnover rates, elevated commodity prices and shortages, and staffing, freight and delivery challenges.
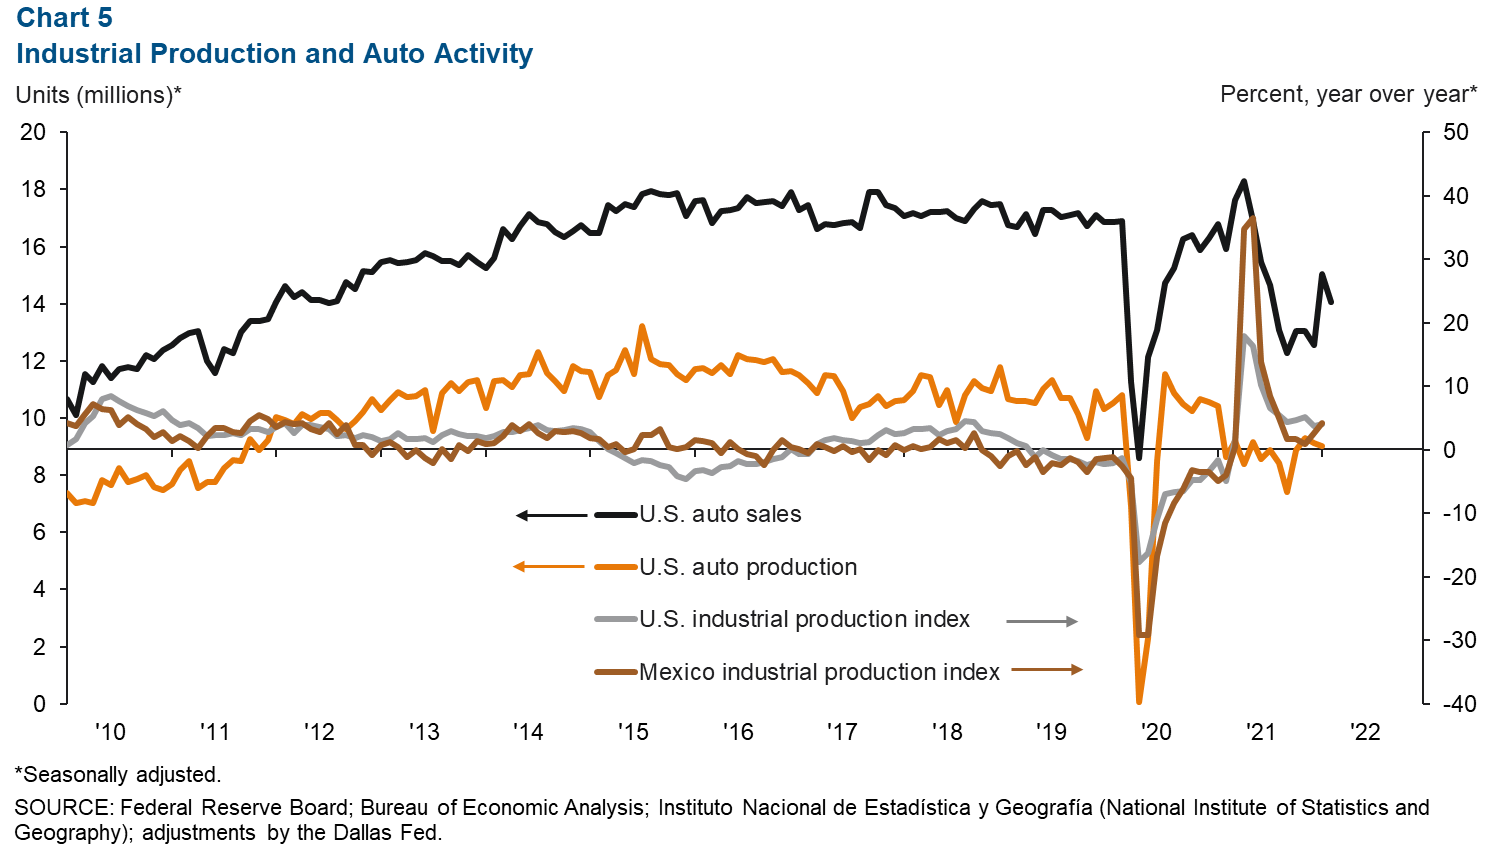
U.S. auto and light-truck production fell from 9.1 million units in December to 9.0 million units in January. Monthly auto sales also fell, from 15 million in January to 14.1 million in February. Industrial and auto activity are closely linked to the El Paso-area economy because of cross-border manufacturing relationships. Roughly half of maquiladoras in Juárez are auto related.
NOTE: Data may not match previously published numbers due to revisions. The El Paso metropolitan statistical area includes El Paso and Hudspeth counties.
About El Paso Economic Indicators
Questions can be addressed to Keighton Hines at keighton.hines@dal.frb.org. El Paso Economic Indicators is published every month after state and metro employment data are released.