Wind
Over the last 10 years, wind power has picked up steam in Texas and southern New Mexico, making the Eleventh District a hub for green jobs. Using the tabs below, learn more about the growth in wind production across the region and its effects on employment.
| Highlights |
|---|
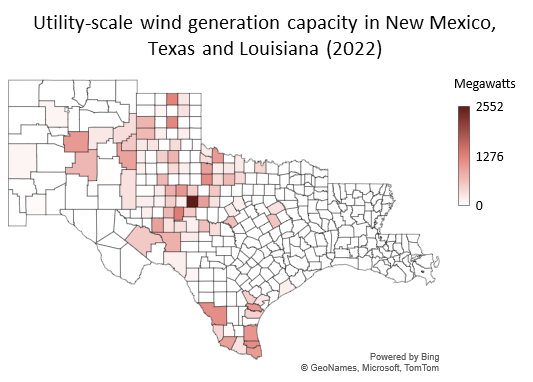
Texas is the leading state for wind energy in the country. As of 2022, the state had more than 39 gigawatts (GW) of utility-scale wind capacity, with Oklahoma, the second-highest capacity state, having less than a third of the capacity. Abundant space and flatland plains lead to the steady, sustained winds that are needed to make wind power an attractive proposition for producing electricity. Texas has been leading the nation for more than 10 years now. There is wind capacity in various parts of the state, but it is most prevalent in West Texas and the Panhandle, in particular Nolan, Sterling and Hansford counties. Those three counties hold 12.7 percent of the state's capacity. Nolan county is by far home to the largest amount of wind power, having capacity of 2,552 megawatts (MW). New Mexico is also home to wind capacity, with 4,409 MW as of 2022. Almost all of that capacity, 97.7 percent, is contained within the Eleventh District. Within our district, Torrance, Roosevelt and Lincoln are the top-producing counties with a combined capacity of 2,698.2 MW. Wind power is responsible for roughly 30 percent of electricity produced in New Mexico. As of 2022, Louisiana is yet to possess any utility-scale wind generation. Texas and New Mexico are located in the |

Today, Texas is the top wind-producing state in the U.S., with wind energy production accounting for 28 percent of power produced in the state. If Texas were a country, it would rank as one of the top wind-producing nations in the world.
The first major wind farm in Texas was built in Culbertson County in 1995. In 2005, the Texas Legislature passed a law that required Texas to increase renewable energy use, mainly wind, given the fact that Texas is located in a natural wind belt that generates a high volume of wind. The Public Utility Commission of Texas (PUCT) needed to, under the legislation, designate Competitive Renewable Energy Zones (CREZ) throughout the state that resulted in sufficient transmission capacity. Under the resulting plan developed by PUCT, 3,500 miles of high voltage transmission lines were permitted, designed and constructed by eight transmission providers for a cost of $6.9 billion by January 2014.
Texas saw significant growth in wind generation capacity from 2005 to 2008, with capacity quadrupling. However, congestion increased in 2008 and 2009, leading to sizeable wind generation curtailments and negative power prices. The CREZ lines helped alleviate these constraints from 2010 to 2014, helping curtailments decline to negligible levels. However, in recent years wind-generation capacity in the state has continued to grow, and power curtailments have become more common again in recent years. These factors have influenced developers in Texas to move toward solar projects, which can be built closer to demand centers more economically, thereby exposing them to less transmission risk. [1]
New Mexico also has a strong wind-power industry and has one of the fastest growth rates of wind-energy production among U.S. states. In 2022, 35 percent of New Mexico’s electricity generation stemmed from wind energy, more than any other energy source. [2]
The sector truly emerged in 2003 when the New Mexico Wind Energy Center opened. At the time, it was one of the world’s largest wind farms, generating up to 200 MW of power and coming online even before the state adopted a Renewable Portfolio Standard. Then, in 2007, the New Mexico Renewable Energy Transmission Authority was established. The state legislature created it to plan, finance, develop and acquire high-voltage transmission lines and storage projects. More wind farms followed. This included the Red Mesa Wind Energy Center in 2015 and the Casa Mesa wind facility shortly afterwards.
In addition, several research laboratories were established in New Mexico to further innovation in the field. One such facility is the Los Alamos National Laboratory, whose researchers study the interaction between wind turbines and atmospheric boundary layer flows. Meanwhile, the Sandia National Laboratories comprises several programs. One helps design more effective turbine blades by predicting their behavior and performance before they are built. Another such program researches the manufacture of wind turbines with radar-absorbing materials. As such, both Texas and New Mexico have notable wind-power sectors that are growing at a steady rate.
Notes
- For more information on the history of wind power in Texas, see Wind Energy, Scientific American, April 14, 2017.
- For more information on the history of wind power in New Mexico, see Wind Energy, Department of Energy, 2023.
| Highlights |
|---|
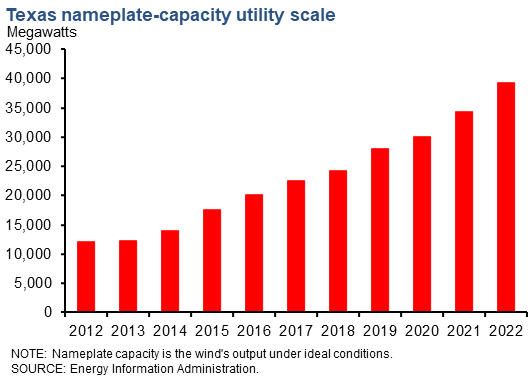
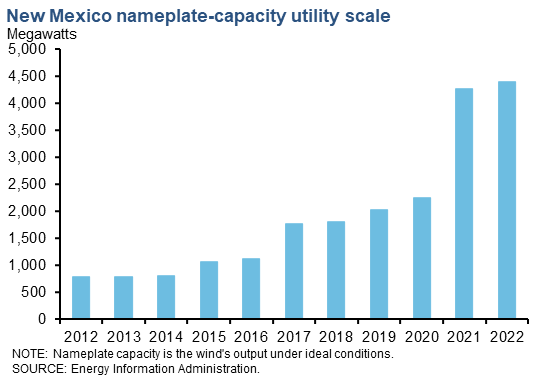
Wind capacity in the Eleventh District began growing rapidly about two decades ago. The area is now home to 10 wind farms that have the capacity to generate 500 MW or more. Utility-scale nameplate capacity—a measure of the potential output under ideal conditions (a wind speed of 13 miles per hour)—rose from 12,185 MW in 2012 to over 39,000 MW in 2022, with steady year-over-year growth each year. The state's share of U.S. utility-scale wind has grown modestly over the last 10 years. In 2012, the state's produced capacity share was 20.4 percent of U.S. utility wind power capacity, and in 2022, it accounted for 27.7 percent of the nation's nameplate capacity. Over the same time frame, New Mexico went from having 1.3 percent of total U.S. wind capacity to 3.1 percent.[1] Wind is an intermittent source of power; it only generates electricity when the wind is blowing. The capacity factor, defined as power production divided by maximum capacity, for wind generation was 35.2 percent in Texas and 37.5 percent in New Mexico. [2] Also, if more wind power is available than the grid can use, grid operators have to curtail wind production to keep the grid balanced. The Electric Reliability Council of Texas' (ERCOT's) curtailment has grown from 3.8 percent of wind generation in 2012 to 4.7 percent in 2022. There is also a seasonal aspect and hourly aspect to wind generation in Texas. During the year, wind generation is generally highest during the early to late spring and late fall. Additionally, wind speeds are generally higher during night hours when compared to the daytime hours as wind speeds are higher at night compared to the early afternoon. |
| Utility-scale capacity 2022 |
||
|---|---|---|
| Megawatts |
Year/year change (percent) |
|
| Texas | 39,335 | 14.4 |
| New Mexico | 4,411 | 3.4 |
| U.S. | 141,952 | 6.4 |
| SOURCE: Energy Information Administration. | ||


Notes
- Utility-scale generation capacity comes from the Energy Information Administration's 860 Report.
- Capacity factor data by state comes from the Energy Information Administration.
| Highlights |
|---|
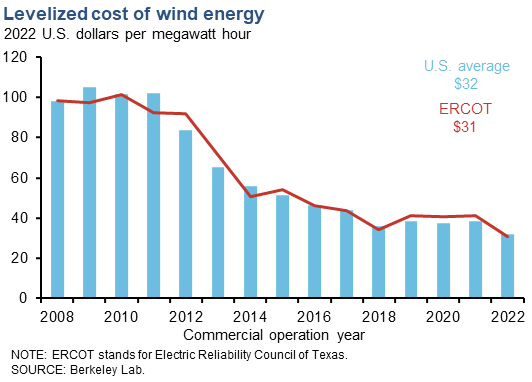
The levelized cost of electricity (LCOE) for new wind generation in ERCOT has declined 69 percent from 2008 to 2022. For 2022, the LCOE for ERCOT was $30.56 per megawatt hour or 4.6 percent lower than the national average. [1] One of the factors driving lower LCOEs is increasing hub height and rotor diameter, allowing each turbine to produce more power. [2] Hub height is defined as the distance from the ground to the hub, or center of the turbine, and rotor diameter is the diameter around the rotor blades. Government incentives have also long been a part of the wind industry in the United States and help with project economics. The Energy Policy Act of 1992 established a production tax credit (PTC) for wind power at 1.5 cents per kilowatt hour. The recent 2022 Inflation Reduction Act has extended the PTC through 2032. |
| LCOE 2022 |
||
|---|---|---|
| Cost per megawatt hour (dollars) |
Year/year change (percent) |
|
| ERCOT | $30.56 | –25.5 |
| U.S. | $32.04 | –16.1 |
| SOURCE: Berkeley Lab. | ||
Notes
- Data from the Berkeley Lab Land-Based Wind Market Report .
- Wind Turbines: the Bigger, the Better, U.S. Department of Energy.
| Highlights |
|---|
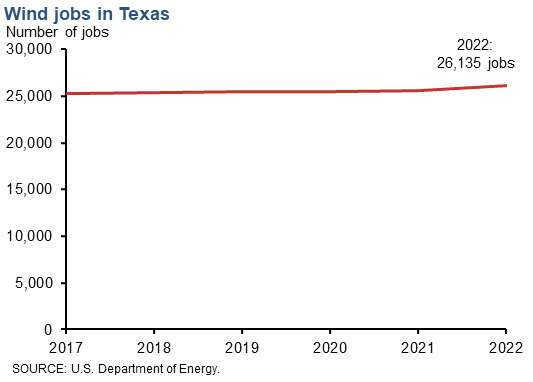
There are over 26,000 jobs in Texas that are connected with wind energy, making Texas the top state for employment in the U.S. wind industry. The state's share of the national total is 20.8 percent, more than double the share of the next-highest state, Illinois, which has 7.4 percent of national wind employment. Following Illinois are Colorado (6.2 percent) and California (6.0 percent). The number of jobs associated with wind energy in the Eleventh District now stands at 26,135 in Texas, 1,109 in New Mexico and 445 in Louisiana. |
| Employment 2022 |
||
|---|---|---|
| Employment |
Year/year change (percent) |
|
| Texas | 26,135 | 2.3 |
| New Mexico | 1,109 | 8.6 |
| U.S. | 125,580 | 7.5 |
| SOURCE: U.S. Department of Energy. | ||
- "Record-breaking Texas summer heat tests the grid, ERCOT operations"
- "Global energy producer Midland-Odessa seeks economic stability, end to boom-and-bust"
- "Energy transition means more than just additional electric vehicles"
- "Texas grid remains vulnerable to extreme weather events"
- "Blame costlier natural gas, Rising fees for increasing power billsrising fees for increasing power bills"
- "Renewable energy projects present unique lender risks, need for oversight"
- "Once-oil-dependent Texas economy to keep growing as renewable energy expands"
- "Wind and Solar Power:
Perfect When Paired in Texas"