
Market Value of U.S. Government Debt
For many uses, market value more accurately represents the debt burden faced by the U.S. government than the par value. The par value of government debt, which is reported by the U.S. Treasury Department, reflects interest rates at the time the debt was issued while the market value is adjusted to reflect market interest rates as of the observed period. Federal Reserve Bank of Dallas researchers calculated the market value of U.S. government debt series until October 2010. In March 2013, the source of market interest rates was changed and updating resumed. See the methodology description for more detail.
Par and market values are reported for gross federal debt (all debt issued by the Treasury), privately held gross federal debt (that not held in U.S. government accounts or by the Federal Reserve) and marketable Treasury debt (Treasury bills, notes and bonds). Values reported are for the last business day of the month. The market value of marketable Treasury debt is an accounting exercise, while the other two require an assumption about the price of nonmarketable debt.
Data Sources
The primary data sources have changed over the years. The current sources are:
- U.S. Treasury: Monthly Statement of the Public Debt, and Monthly Treasury Statement.
- Federal Reserve Bank of New York: System Open Market Account Holdings.
- Bloomberg L.P.
Data sources for historical data also include:
- U.S. Treasury: Treasury Bulletin, Archived Treasury Bulletins
- Wall Street Journal: U.S. Treasury Quotes
Charts 1 and 2 plot the par and market values of U.S. government debt. Marketable Treasury debt and privately held gross federal debt are plotted in separate charts because they are generally very close to one another. This means that U.S. government debt held by the Federal Reserve and privately held nonmarketable U.S. government debt have historically been roughly the same size. Charts 1B and 2B plot U.S. government debt as a percent of GDP to scale the debt to the nation’s potential for repayment.
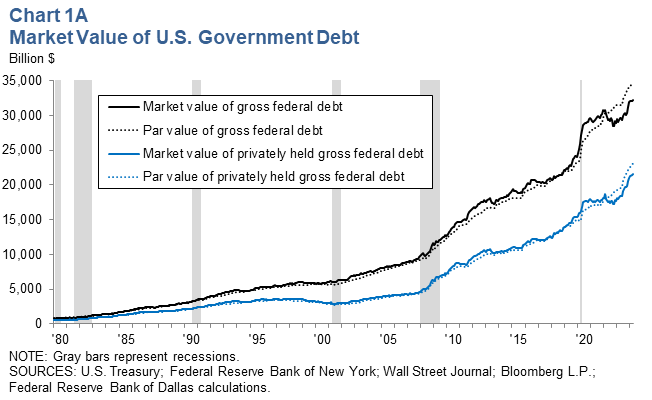
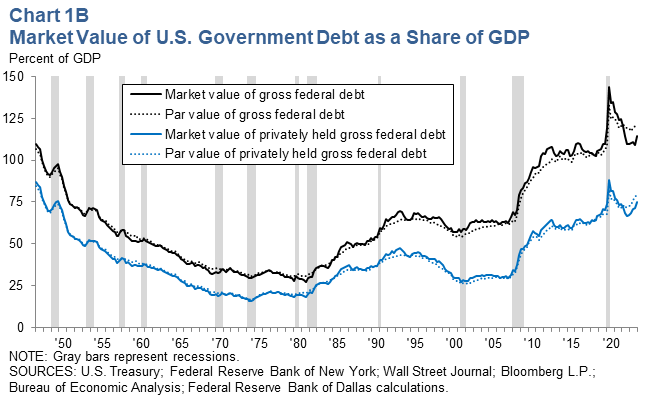
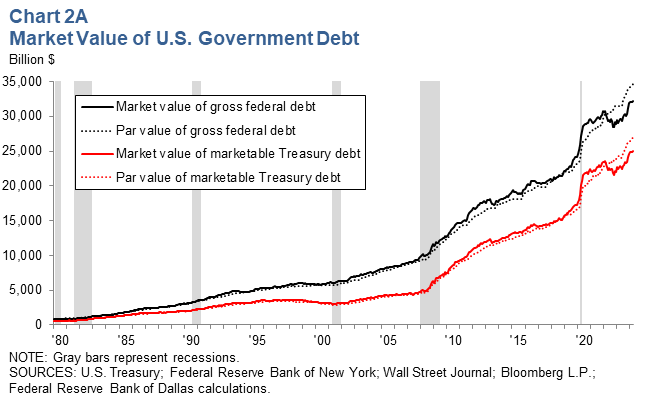
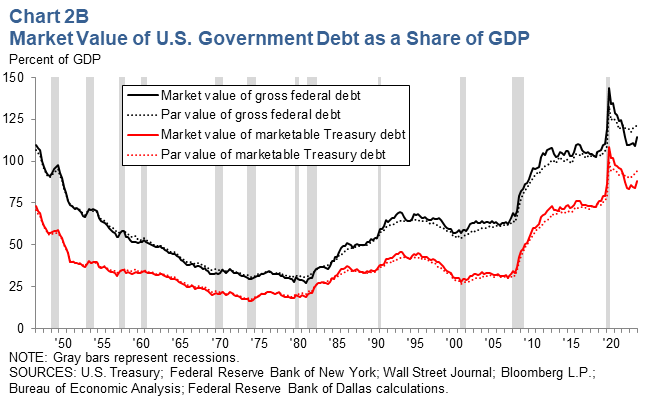
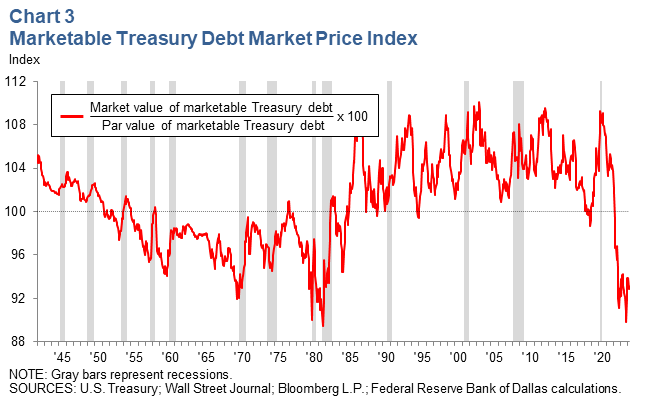
Chart 3 plots the price index for marketable Treasury debt. This index is applied to the nonmarketable debt components of gross federal debt and privately held gross federal debt to estimate their market value.
The series are updated by the end of the eighth business day of each month, corresponding with the release of the Monthly Treasury Statement.
Official statistics on government debt are reported in terms of par value of the debt securities—how much must be repaid at the maturity date. However for many purposes, the market value, which accounts for changes in interest rates since the debt was issued, is a more accurate representation of what the federal government actually owes.
For example, a bond with a par value of $1000 issued when the prevailing interest rate was 5 percent would pay $50 a year in interest. If interest rates for comparable financial instruments fell to 4 percent immediately after the bond was issued, the market value of the bond would have increased to $1250—the price another investor would be willing to pay for the $50 a year interest payments. Otherwise, there would be room for arbitrage opportunities. In particular, if the price of the bond remained at $1000, the rate of return on the bond would still be 5 percent, instead of the 4 percent offered by all other comparable securities. In the attempt to take advantage of this above-market yield, potential investors would bid the price of the bond up. An entirely analogous argument shows why the price of the bond couldn’t go higher than $1250. This, not the $1000 par value, is the market value of the claim against the government represented by the bond. Equivalently, the government would have to pay the market value if it wanted to retire the security by repurchasing it. Conceptually, this principle applies to the entire U.S. government debt.
The market value of U.S. government debt series at a monthly frequency was originally calculated by Cox and Hirschhorn (1983), modified in Cox (1985) and then regularly updated on the Federal Reserve Bank of Dallas website until it was halted in October 2010. Since the original publication, more reliable, timely and rich data sources have become available for which the methodology has again been slightly altered. This documentation provides a brief overview of how the market value of federal debt is calculated and describes the changes to data sources. Cox and Hirschhorn (1983) and Cox (1985) should be referenced for further detail on the original series. The time series are updated on the fourth business day of every month after the Monthly Statement of Public Debt is available.
Components of U.S. Government Debt
Three different aggregations of the components of the U.S. government debt are reported. The broadest is gross federal debt—referred to as total public debt outstanding by the Treasury—and does not include debt issued by federal agencies other than the Treasury, such as the Federal National Mortgage Association (Fannie Mae). The other two series are subsets of gross federal debt.
Gross federal debt is split into marketable and nonmarketable securities.
- Marketable securities can be bought and sold in the open market and fall into the following categories:
- Treasury bills (less than 1-year maturity)
- Treasury notes (1 to 10 years maturity)
- Treasury bonds (greater than 10 years maturity)
- Treasury inflation-protected securities (TIPS)
- Treasury certificates of indebtedness (prior to 1967)
- Nonmarketable securities can only be redeemed by whom the debt was originally issued, although some may be cashed prior to the maturity date with a penalty.
Gross federal debt can also be categorized by who is holding it: a private investor, U.S. government accounts or the Federal Reserve, as reported in the Treasury Bulletin’s Table OFS-1. These two distinctions form six categories as shown in Table 1. The Federal Reserve does not hold any nonmarketable securities so there are only five categories that could be different from zero.
Table 1
The Composition of the Par Value of Gross Federal Debt as of December 2012
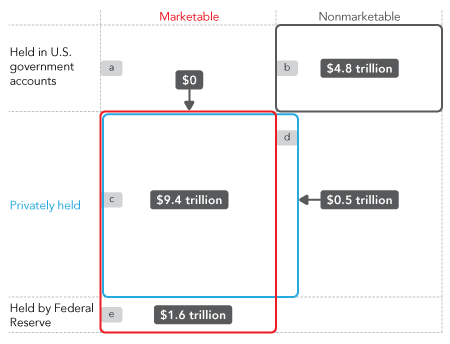
U.S. government accounts hold federal debt securities as a means for one entity of the government to borrow from another, almost entirely in the form of trust funds, which are nonmarketable. U.S. government accounts have held marketable securities (box a in Table 1), in the past, but not since January 2005. The largest U.S. government account is the Federal Old-Age and Survivors Insurance trust fund, which along with the Disability Insurance trust fund, make up the Social Security trust fund. It is not obvious to what extent the U.S. government accounts represent indebtedness of the federal government, as they are funds the government owes itself.[1] The same is true of the Treasury debt held by the Federal Reserve, which it buys and sells in its conduct of monetary policy. Any profits earned from its holdings are remitted back to the Treasury.
Because of this, privately held gross federal debt, the second series reported, is often a series of interest. It is represented by the blue box in Table 1. It is composed mostly of marketable securities with a small amount of nonmarketable debt, like U.S. savings bonds and debt issued to state and local governments. The par value held by private investors is not directly calculated by the Treasury, but is what is left of gross federal debt after subtracting out that held by U.S. government accounts and the Federal Reserve.
The third series reported is marketable Treasury debt, not because it is of particular interest, but because only the market value of marketable debt is directly observable. Market prices are needed to calculate the market value, which obviously only exists for marketable securities. Information on the bid rates and par value outstanding of every marketable Treasury security allows for a direct calculation that should be very precise as it is a simple accounting exercise. Assumptions are needed to estimate the market value of gross and privately held federal debt because they include nonmarketable debt.
Calculation
Calculations are for the last business day of each month, retrieved from various sources as detailed in the next section. The par values of gross federal debt and privately held gross federal debt are directly from the Treasury, while market value aggregates require calculation. First, the market value of each outstanding Treasury security is calculated.
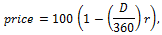
The price of Treasury bills, which are sold on a discount basis, is calculated with the formula used on the securities market,
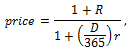
Bid data on certificates of indebtedness were reported as interest rates. The price is calculated using the present value formula
Bonds, notes and TIPS prices are reported directly and do not require any manipulation other than converting to fractions of one dollar. The price of each security is multiplied by the outstanding par value and summed over all securities to obtain the market value of marketable Treasury debt. This is the red solid line shown in Chart 2 in the Charts tab. The par value of marketable Treasury debt is calculated by summing the par values of the securities outstanding and differs slightly from the Monthly Statement of Public debt definition, which includes matured debt and Federal Financing Bank securities. These two last categories, typically small, are classified under privately held nonmarketable debt in the aggregates used here.
As already mentioned, gross federal debt is marketable plus nonmarketable debt, but the market value of nonmarketable debt is not observable. So the market value of gross federal debt is estimated using the price index from the marketable Treasury debt series,
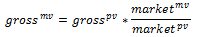
It is the black solid line in Chart 1 in the charts tab. This assumes that a unit of nonmarketable debt is valued the same as a unit of marketable debt and that the maturity structure is the same, both of which may not be true. The par value of nonmarketable debt has ranged between 25 to 50 percent of gross federal debt since 1942, not a trivial component.
The market value of privately held gross federal debt is calculated similarly with the following analogous formula:
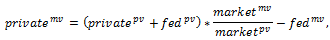
An alternative, conceptually valid definition of the market value of privately held gross federal debt wasn’t used for the methodological consistency reasons discussed at the end of this section. In any case, the formula above assumes again that privately held nonmarketable debt (box d in Table 1) and marketable debt held in U.S. government accounts (box a in Table 1) are valued the same and have the same maturity structure as total marketable debt. This assumption is less of a concern than it is for the calculation of the market value of gross federal debt, because the privately held portion of nonmarketable debt is much smaller than that held in government accounts. From 1995 to 2012 their combined par values have ranged between 3 to 8 percent of gross federal debt, almost all of which is privately held nonmarketable debt. Ideally, one could calculate the precise market value of the privately held marketable securities (box c in Table 1) and only have to make an assumption about privately held nonmarketable debt (box d in Table 1), but information on which securities are held in government accounts is not available. This is not an issue recently, as marketable securities held in government accounts have remained at zero since 2005.
After 1988, the market value of Federal Reserve holdings, fedmv, is calculated in the same way as total marketable securities, so it is an exact calculation. Prior to 1989, the information about the specific securities held by the Federal Reserve is not available, only the amount in the categories of bonds, notes and bills and certificates of indebtedness. Accordingly, prior to 1989 the market value of Federal Reserve holdings is estimated by

This requires the assumption that the securities held by the Federal Reserve (box e in Table 1) have the same maturity structure as the total marketable Treasury debt within the different categories of Treasury debt.
The definition of the market value of privately held gross federal debt above is influenced by the pricing and market structure of Federal Reserve holdings. The securities held by the Federal Reserve are part of total marketable Treasury debt, and the total marketable Treasury debt price index is used to estimate the market value of privately held nonmarketable debt (box d in Table 1). It could be more appropriate to use the price index from only the marketable securities not held by the Federal Reserve (boxes a and c in Table 1). Then the formula would be
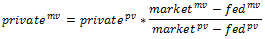
The resulting series is not very different from the previous definition—they are usually less than 0.2 percent apart. To keep with the methodology from Cox (1985), the earlier definition is used, but the series without the influence from Federal Reserve holdings on the estimated market value of privately held nonmarketable debt is available upon request.
Data Sources
In the original publication of the market value of the U.S. government debt by Cox and Hirschhorn (1983), all of the underlying data came from the Treasury Bulletin. In November 1982, the Treasury Bulletin switched from a monthly to a quarterly publication, making it a less suitable source for timely updating. Cox (1985) reported privately held gross federal debt instead of privately held marketable federal debt, and data for the marketable securities prices and par values outstanding was switched to monthly sources. Par values of securities outstanding and the gross federal debt aggregate came from the Monthly Statement of Public Debt from the Treasury and market prices came from the Wall Street Journal. The par value of privately held federal debt and the amount of Federal Reserve holdings still came from the Treasury Bulletin and the privately held series could only be calculated two months after the other series. Since then, more reliable data sources for market prices and the Federal Reserve holdings have become available, and the methodology was again revised to take advantage of those sources. The evolution of data sources is shown in Table 2.
Table 2
Sources of Input Data
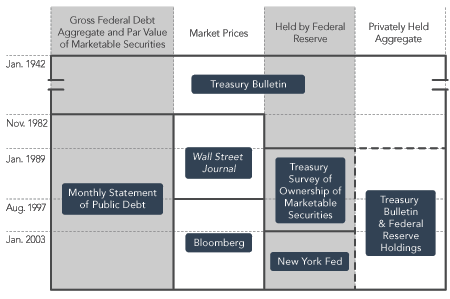
As the market value of the U.S. government debt was updated through the 2000s, a few issues arose regarding the Wall Street Journal as a source for the prices of marketable securities. Newly issued securities would not always be reported and there were occasional errors in the security ID numbers. Bloomberg L.P. proved to be more reliable, reporting a price for every security every month that was in the Monthly Statement of Public Debt. However prices from Bloomberg are only available starting in August 1997, so the Wall Street Journal is still used from November 1982 to July 1997, as in Cox (1985).
In January 1989, information on the par value of individual securities held in the Federal Reserve System Open Market Account became available. As described in the previous section, using the individual securities allows a precise calculation of the market value of Federal Reserve holdings and thus a more accurate estimate of the market value of privately held gross federal debt. This information is not publicly available until January 2003, after which it is available on the Federal Reserve Bank of New York website. The switch to individual securities comes with the cost of a small timing discrepancy. Federal Reserve holdings are reported for every Wednesday, while all other data is for the last business day of the month. After 1988, par and market value of Federal Reserve holdings, which are used to calculate the par and market value of privately held gross federal debt, are from the last Wednesday of the month.
The par value of privately held gross federal debt is defined as

Prior to 1989, it is taken directly from the Treasury Bulletin. Starting in 1989, it must be calculated because the par value of Federal Reserve holdings (fedpv) used here is different from what the Treasury Bulletin reports and uses to calculate the par value of privately held gross federal debt. The two measures of Federal Reserve holdings differ due to the small timing discrepancy already mentioned and, more recently, to the inclusion of federal agency securities in the series from the Treasury Bulletin. In 2008 the two series began to diverge as the Federal Reserve purchased agency securities as part of its asset purchase program. The Federal Reserve Bank of New York series is more appropriate then, as the aggregate definitions here do not include federal agency debt. Further, the Treasury Bulletin revised Federal Reserve holdings in March 2011 to exclude agency debt other than Ginnie Mae, making it inconsistent with previously published values. Another benefit of calculating the par value of privately held gross federal debt using the Federal Reserve holdings from the Federal Reserve Bank of New York is that it allows timelier updating. The Treasury Bulletin is published with a two-month lag—data for March is not published until June. The Federal Reserve holdings from the Federal Reserve Bank of New York is available immediately and federal debt held in U.S. government accounts (govpv) is published in the Monthly Treasury Statement (Table 6, Schedule D) which is available on the 8th business day of the month—data for March is available in mid-April.
Notes
- For example, when Social Security revenues run above benefits paid out, the remainder is invested in interest-bearing certificates of indebtedness, and the funds become available to the Treasury for government operations. When benefits run above revenues, the trust fund is drawn down. If the Treasury pays back the trust fund by issuing more debt, gross federal debt will remain constant as the debt is transferred from government accounts to private investors.
- For example, consider a certificate of indebtedness that had a par value of $1000 would pay $10 in total interest payments and would mature in one year. The coupon rate would then be 1 percent. If immediately after the certificate was issued, interest rates rose to 2 percent, the new market value would be $990.20.
References
Cox, W. Michael and Eric Hirschhorn (1983), “The Market Value of Outstanding Government Debt,” Journal of Monetary Economics 11, pp.261–72.
Cox, W. Michael (1985), "The Behavior of Treasury Securities: Monthly, 1942–1984," Journal of Monetary Economics 16, pp. 227–40.
Contact Information
For questions, comments or suggestions about the data or the web page:
- Tyler Atkinson: tyler.atkinson@dal.frb.org