International House Price Database
The Globalization Institute of the Federal Reserve Bank of Dallas produces an international house price database, which comprises quarterly house price and personal disposable income (PDI) series for a number of countries. All data series begin in first quarter 1975.
We select a house price index for each country that is most consistent with the quarterly U.S. house price index for existing single-family houses produced by the Federal Housing Finance Agency. We extend the preferred series for each country back to first quarter 1975 either with historical data or with data from secondary sources. Each country’s house price index is seasonally adjusted over the entire sample period with an unobserved components time series model and then rebased to 2005 = 100.
PDI series are quoted in per capita terms using working-age population. Both the house price and PDI series are quoted in nominal and real terms. Real values are computed using the personal consumption expenditure deflator.[1] For each series, we produce a weighted average of all countries in the database, using purchasing power parity-adjusted gross domestic product shares in 2005.
A detailed description of the sources and methodology can be found in Mack and Martínez-García (2011), which is updated whenever modifications to the database occur. We would appreciate that anyone wishing to use this dataset, modified or otherwise, acknowledge the source of the data publicly available through this website with a citation of the working paper: for example, including a statement such as: “The authors acknowledge use of the dataset described in Mack and Martínez-García (2011).”
Exuberance Indicators
As part of our ongoing partnership with Efthymios Pavlidis and his colleagues in the Department of Economics at Lancaster University Management School, we also provide exuberance indicators for each release starting in second quarter 2013. We compute these indicators with the recently developed recursive (right-tailed) unit root tests of Yale economist Peter C. B. Phillips and his co-authors called Supremum Augmented Dickey Fuller (SADF) and Generalized SADF (GSADF). These statistics detect and date periods of exuberance during which house prices (or conventional house price-to-fundamentals ratios) display explosive behavior. Exuberant or explosive price behavior may occur when house prices are not based on housing market fundamentals, so these indicators provide a useful signal of emerging misalignments and are powerful tools for monitoring housing.
A detailed description of the methodology for the exuberance indicators can be found in Pavlidis et al. (2016) . We would appreciate that anyone wishing to use this dataset, modified or otherwise, acknowledge the source of the data publicly available through this website with a citation of this paper: for example, including a statement such as: “The authors acknowledge use of the exuberance indicators developed in Pavlidis et al. (2015).”
Release Dates
The international house price database is updated on a quarterly basis. New datasets are posted with a three-month lag to ensure a sufficient number of new country observations in each quarterly release. In setting the release dates, we also take into account the impact of moving holidays that would affect a broad range of data releases used in the database. This ensures the most current data are used. When new observations are not yet available by the release date, we complete the series with our own forecasts. Those forecasts are replaced in subsequent revisions as the corresponding quarterly observations become available.
|
Last Quarter Included |
Data Release Date |
|
First quarter 2024 |
July 12, 2024 |
|
Second quarter 2024 |
October 11, 2024 |
|
Third quarter 2024 |
January 10, 2025 |
|
Fourth quarter 2024 |
April 11, 2025 |
Note
- See "Deflating Nominal Values to Real Values," DataBasics, Federal Reserve Bank of Dallas.
All releases of the database include the following time series for the countries covered: the house price index (HPI), the house price index expressed in real terms (RHPI), the personal disposable income (PDI) index and the personal disposable income expressed in real terms (RPDI) index. All variables in real terms are deflated with the personal consumption expenditure (PCE) deflator. The exuberance indicators files include test statistics for explosive behavior on the RHPI and the ratio of RHPI to RPDI at a lag length of 1 and 4, along with the corresponding 95 percent critical values.
How to Cite
We would appreciate that anyone wishing to use this dataset, modified or otherwise, acknowledge the source of the data publicly available through this website with a citation of the working paper: for example, including a statement such as, “The authors acknowledge use of the dataset described in Mack and Martínez-García (2011).” The accompanying bibliographical citation would be
- Mack, A., and E. Martínez-García. 2011. "A Cross-Country Quarterly Database of Real House Prices: A Methodological Note." Globalization and Monetary Policy Institute Working Paper No. 99, Federal Reserve Bank of Dallas.
Those using the exuberance indicators should also cite the following paper as a source:
- Pavlidis, E., A. Yusupova, I. Paya, D. Peel, E. Martínez-García, A. Mack and V. Grossman. 2016. “Episodes of Exuberance in Housing Markets: In Search of the Smoking Gun.” The Journal of Real Estate Finance and Economics, Vol. 53(4), pp. 419–49.
We recommend including the date when the database was consulted, as data are subject to revisions.
2023
- Fourth Quarter 2023 | Exuberance Indicators
NOTE: Portugal is now included in the database and has been incorporated in the aggregate indexes. The PDI series for Portugal is national disposable income data from the Statistical Office of the European Communities starting in 1991Q1. This is extended using historical national disposable income data from the OECD. The HPI series is constructed using current data from the Bank for International Settlements. The hedonic index includes prices for all types of dwellings starting in 1988Q1. This is extended using historical housing construction data from Banco de Portugal and the Instituto Nacional de Estatística. - Third Quarter 2023 | Exuberance Indicators
- Second Quarter 2023 | Exuberance Indicators
- First Quarter 2023 | Exuberance Indicators
NOTE: The HPI series for Canada has been revised. The MLS Home Price Index from the Canadian Real Estate Association is reviewed annually, with updates to the series released in June. These updates incorporate the latest info on the attributes of the benchmark homes which are tracked over time. The HPI series for South Africa has been revised. FNB has added historical data for 2000 that was not available earlier which has resulted in a reevaluation and upward shift for the first half of our combined series. This will affect the nominal and real HPI series for the 2023:Q1 release and all subsequent data releases.
2022
- Fourth Quarter 2022 | Exuberance Indicators
NOTE: The HPI series for Australia has been revised. Starting in 2011, the series is based on the mean price of residential dwellings developed by the Australian Bureau of Statistics (ABS). The ABS index that we used previously was discontinued after December 2021. This will affect the nominal and real HPI series for the 2022:Q4 release and all subsequent data releases. - Third Quarter 2022 | Exuberance Indicators
- Second Quarter 2022 | Exuberance Indicators
- First Quarter 2022 | Exuberance Indicators
2021
- Fourth Quarter 2021 | Exuberance Indicators
- Third Quarter 2021 | Exuberance Indicators
- Second Quarter 2021 | Exuberance Indicators
- First Quarter 2021 | Exuberance Indicators
2020
- Fourth Quarter 2020 | Exuberance Indicators
- Third Quarter 2020 | Exuberance Indicators
- Second Quarter 2020 | Exuberance Indicators
NOTE: Colombia is now included in the database and has been incorporated in the aggregate indexes. The PDI series for Colombia is national disposable income data from the OECD starting in 2000. This is extended using historical national accounts data from the Departamento Administrativo Nacional de Estadística. The HPI series is constructed using current data from the Banco de la República. The hedonic index includes prices on repeat sales of homes in major metro areas. This is extended using available historical data. - First Quarter 2020 | Exuberance Indicators
NOTE: Several changes have occurred with the 2020:Q1 release, which will affect all subsequent releases. Slovenia is now included in the database and has been incorporated in the aggregate indexes. The PDI series for Slovenia is constructed with net disposable income data from Eurostat starting in 2005. This is extended using a historical series from national sources. The HPI series is constructed using current data from the Statistical Office of the Republic of Slovenia. The index is constructed using the hedonic method and includes prices for all types of dwellings. This is extended using an annual series from Yugoslavia’s Federal Bureau of Statistics. In incorporating Slovenia into IHPD, we have also upgraded the methodology used on Croatian data to better match the historical data during the high-inflation period of the late 1980s and early 1990s. An aggregate series computed using dynamic weights has been added as a complement to the 2005 fixed-weight aggregate that has been included in all previous releases. We use the purchasing power-parity adjusted (annual) GDP shares of all countries in each year of the database.
2019
- Fourth Quarter 2019 | Exuberance Indicators
- Third Quarter 2019 | Exuberance Indicators
- Second Quarter 2019 | Exuberance Indicators
- First Quarter 2019 | Exuberance Indicators
2018
- Fourth Quarter 2018 | Exuberance Indicators
NOTE: The HPI series for Italy has been revised. Starting in 2010:Q1, the series is based on the house price index developed by the Italian National Institute of Statistics (Istat). This will affect the nominal and real HPI series for the 2018:Q4 release and all subsequent data releases. - Third Quarter 2018 | Exuberance Indicators
- Second Quarter 2018 | Exuberance Indicators
NOTE: The HPI series for South Africa has been revised. FNB has switched their preferred index methodology from stratified mean to repeat sales. This will affect the nominal and real HPI series for the 2018:Q2 release and all subsequent data releases. - First Quarter 2018 | Exuberance Indicators
NOTE: The HPI series for Japan has been revised. Starting in 2008:Q2, the series is based on the detached house price index developed by the Japanese Ministry of Land, Infrastructure, Transport and Tourism. This will affect the nominal and real HPI series for the 2018:Q1 release and all subsequent data releases.
2017
- Fourth Quarter 2017 | Exuberance Indicators
- Third Quarter 2017 | Exuberance Indicators
- Second Quarter 2017 | Exuberance Indicators
NOTE: The HPI series for South Africa has been revised. Starting in 2001, the series is based on the house price index developed by South Africa’s First National Bank (FNB). The ABSA index that we used previously was discontinued after November 2016. This will affect the nominal and real HPI series for the 2017:Q2 release and all subsequent data releases. - First Quarter 2017 | Exuberance Indicators
2016
- Fourth Quarter 2016 | Exuberance Indicators
- Third Quarter 2016 | Exuberance Indicators
- Second Quarter 2016| Exuberance Indicators
NOTE: The HPI series for Germany has been revised. The series is now based on the quarterly house price index developed by the Federal Statistical Office starting in 2000. The quarterly index covers all existing dwellings. The index from the Deutsche Bundesbank that we used previously covered existing, terraced houses and was annual. The HPI series for the U.K. has also been revised. Starting in 2005, the series is based on the “UK House Price Index (HPI),” which replaced the previous house price indices that were separately published by the Land Registry and the Office for National Statistics starting with the data released for April 2016. The new HPI uses additional property attributes data that make it more consistent with international best practices as defined by Eurostat. This will affect the nominal and real HPI series for the 2016:Q2 release and all subsequent data releases. - First Quarter 2016| Exuberance Indicators
NOTE: The HPI series for Croatia has been revised. Starting in 2008, the series is based on the house price index developed by the Croatian Bureau of Statistics in cooperation with the Croatian National Bank (CNB). The CNB index that we used previously was discontinued after 2015:Q2. This will affect the nominal and real HPI series for the 2016:Q1 release and all subsequent data releases.
2015
- Fourth Quarter 2015| Exuberance Indicators
- Third Quarter 2015| Exuberance Indicators
NOTE: The historical PDI series for France between 1975 and 1999 has been revised. The series is now calculated using annual consumption of fixed capital data that is interpolated to a quarterly frequency. This will affect the nominal and real PDI series for the 2015:Q3 release and all subsequent data releases. - Second Quarter 2015| Exuberance Indicators
NOTE: The PDI series for Belgium has been revised. Starting in 1999, the series is calculated using consumption of fixed capital data reported at a quarterly frequency. This will affect the nominal and real PDI series for the 2015:Q2 release and all subsequent data releases. - First Quarter 2015 | Exuberance Indicators
2014
- Fourth Quarter 2014| Exuberance Indicators
- Third Quarter 2014 | Exuberance Indicators
NOTE: The PCE series for Croatia has been revised. Due to splicing, this caused a shift in the historical portion of the real HPI and real PDI series. - Second Quarter 2014 | Exuberance Indicators
NOTE: Israel is now included in the database and has been incorporated in the aggregate indexes. The PDI series for Israel is constructed with net private disposable income data from the Israeli Central Bureau of Statistics. The HPI series is constructed using current data from the Israeli Central Bureau of Statistics. The index is constructed using the hedonic method and includes prices for all types of dwellings. This is extended using a price series for owner occupied housing services from the Israeli Central Bureau of Statistics. The historical house price series for Spain between 1975 and 1986 has been revised. We now use the average price series based on mortgage loan data from the Instituto Nacional de Estadística. This series better reflects underlying changes in house prices nationwide in the 1970s and 1980s than the series from Tecnigrama, which only includes prices for Madrid. This will affect the nominal and real HPI series for the 2014:Q2 release and all subsequent data releases. The PDI for the U.K. has also been revised. We now use quarterly consumption of fixed capital data from Eurostat to construct the current PDI measures for the U.K. This will affect the nominal and real PDI series for the 2014:Q2 release and all subsequent data releases. - First Quarter 2014 | Exuberance Indicators
NOTE: The HPI for Canada has been revised. Starting in 2005, the series is based on the MLS Home Price Index from the Canadian Real Estate Association, which is more timely and better reflects underlying changes in house prices. This will affect the nominal and real HPI series for the 2014:Q1 release and all subsequent data releases. PDI for Croatia has been replaced starting in 2002 with integrated national accounts data from Eurostat to facilitate comparability across countries. The nominal PDI series for Belgium has been corrected: data were not consistently adjusted for working-age population in previous releases. This will affect the nominal and real PDI series for the 2014:Q1 release and all subsequent data releases.
2013
- Third Quarter 2013 | Exuberance Indicators
NOTE: The HPI for Ireland has been revised. This will affect the nominal and real HPI series for the 2013:Q3 release and all subsequent data releases. Starting in 2005 the series incorporates the hedonic price index produced by the national statistics office, which better reflects underlying changes in house prices.
- Second Quarter 2013 | Exuberance Indicators
NOTE: Several changes have occurred with the 2013:Q2 release. Croatia is now included in the database and has been incorporated in the aggregate indexes. The PDI series for Croatia is proxied with available household income produced by the Croatian Bureau of Statistics, which measures household earnings plus benefits less taxes. This series is extended using monthly earnings—also produced by the Croatian Bureau of Statistics. The HPI series is constructed using current data from the Croatian Central Bank. The index is constructed using the hedonic method and includes prices for all types of dwellings. This is extended using a price series from the Croatian Bureau of Statistics, which includes only new dwellings. PDI data for Luxembourg are now available from 2006–11, resulting in a substantial revision of our previous estimates of the series since 2007. The RHPI and real personal disposable income RPDI series for Croatia were revised on Oct. 15, 2013 to correct an error in the PCE deflator data. This modification also affects the corresponding aggregate series.
- First Quarter 2013
NOTE: Several changes have occurred with the 2013:Q1 release, which will affect all subsequent releases: The Canadian house price index has been changed. An alternative source is used to obtain house prices from 2010:Q1 onward due to a lapse in current data from the previous source. Also, the national index is now calculated as a weighted average of the 10 metropolitan areas of Canada over the entire period, using fixed population shares from the 2011 census. The historical house price series for Italy between 1975 and 1987 has been revised. The national aggregate now represents a weighted average of the 13 metropolitan areas, pre-1987, using fixed population shares from the 1982 Census. Also, interpolation to a quarterly frequency is done by steps as series are spliced together at the higher frequency. The PDI series for New Zealand has been revised now that we have personal disposable income data reported at quarterly frequency starting in 1998:Q4. The PDI series for South Africa has been revised now that we have working age population reported at quarterly frequency starting in 2008:Q1. The PDI series for Luxembourg has been revised as well. An upward revision for Luxembourg’s net national disposable income has produced a significant shift in the PDI per capita series starting in 2010.
2012
- Fourth Quarter 2012
- Third Quarter 2012
NOTE: Two changes have occurred with the 2012:Q3 release, which will affect all subsequent releases: First, to control for seasonality and excess volatility in some of the PDI series, we now estimate the series with a structural time series model in state-space form. This model allows us to identify and systematically extract the seasonal and excessively volatile components of the data. Second, in cases where national data are not available at the scheduled time of our release, we now provide forecast estimates. - Second Quarter 2012
- First Quarter 2012
NOTE: Several changes have occurred with the 2012:Q1 data release, which will affect all subsequent releases. We no longer rely on the Organization for Economic Cooperation and Development (OECD) Outlook database for current personal disposable income data, but have reconstructed most series using data from national sources and Eurostat. Luxembourg and South Africa are now included in the database. Both countries are included in all four aggregate series. The time coverage of Luxembourg’s disposable income data is limited. Therefore, the PDI series for Luxembourg is inferred through Belgian data. 2012:Q1 and 2012:Q2 data have been released concurrently due to the lagged release caused by these data revisions.
2011
- Fourth Quarter 2011
- Third Quarter 2011
- Second Quarter 2011
NOTE: The second quarter 2011 data have been revised. The nominal PDI data for Canada were not indexed to 2005 = 100 in the original release of the data, which affects both the Canadian series and the OECD-19 aggregate series. Therefore, we offer a revised version, with the Canadian series indexed to 2005 = 100, using the same vintage of data as the original release.
- "A Cross-Country Quarterly Database of Real House Prices: A Methodological Note," by Adrienne Mack and Enrique Martínez-García, Federal Reserve Bank of Dallas, Globalization and Monetary Policy Institute Working Paper No. 99.
Table of Contents
- Introduction
- Background information
- Methodological Approach
- Country-Specific Information
- AU - Australia
- BE - Belgium
- CA - Canada
- CH - Switzerland
- DE - Germany
- DK - Denmark
- ES - Spain
- FI - Finland
- FR - France
- GB - United Kingdom
- HR - Croatia
- IE - Ireland
- IL - Israel
- IT - Italy
- JP - Japan
- KR - South Korea
- LU - Luxembourg
- NL - Netherlands
- NO - Norway
- NZ - New Zealand
- SE - Sweden
- US - United States
- ZA - South Africa
- Bibliography
- Appendix A: Summary of the National Sources of House Price Data
- Appendix B: Table Summaries of HPI Data as Reported from National Sources
Related Reading
- “Oil Change: Fueling Housing and Land Prices?” by Valerie Grossman, Enrique Martínez-García, Yongzhi Sun and Luis B. Torres, Tierra Grande, Journal of the Real Estate Center at Texas A&M University, vol. 24, October 2017.
- “Detecting Periods of Exuberance: A Look at the Role of Aggregation with an Application to House Prices,” by Efthymios Pavlidis, Enrique Martinez-Garcia and Valerie Grossman, Globalization and Monetary Policy Institute Working Paper no. 325, August 2017.
- “Global and Local Housing Markets: The View From Experts at the Dallas FED,” by Enrique Martínez-García and Valerie Grossman (interviewed by Hites Ahir), Global Housing Watch Newsletter, International Monetary Fund, August 2016.
- “Curb Your Enthusiasm. Keeping an Eye on Home Prices,” by Luis B. Torres, Enrique Martínez-García and Valerie Grossman, Tierra Grande, Journal of the Real Estate Center at Texas A&M University, vol. 23, July 2016.
- Presentation of “Monitoring Housing Markets for Episodes of Exuberance—An Application of the Phillips et al. (2013) GSADF Test on the Dallas Fed International House Price Database,” by Efthymios Pavlidis, Lancaster University, and Enrique Martínez-García, Federal Reserve Bank of Dallas, Nov. 15, 2013.
- “Episodes of Exuberance in Housing Markets: In Search of the Smoking Gun,” by Efthymios Pavlidis, Alisa Yusupova, Ivan Paya, David Peel, Enrique Martínez-García, Adrienne Mack and Valerie Grossman, The Journal of Real Estate Finance and Economics, Vol. 53(4), pp. 419–49, November 2016. A working paper version of this article appeared as Globalization and Monetary Policy Institute Working Paper no. 165, December 2013 (Revised June 2015).
- “Increased Real House Price Volatility Signaled Break from Great Moderation," by Adrienne Mack and Enrique Martínez-García, Federal Reserve Bank of Dallas Economic Letter, vol. 7, no. 1, January 2012
- Appendix: “Increased Real House Price Volatility Signaled Break from Great Moderation” by Adrienne Mack and Enrique Martínez-García, Jan. 9, 2012.
The following charts provide a snapshot and overview of the real (inflation-adjusted) house price and personal disposable income data from first quarter 1975 to second quarter 2012 for all countries included in the database. The real house price data is the index of the relative price of residential housing over the private consumption expenditures (PCE) deflator. Personal disposable income data is the index of income available to households from all sources (participation in production, assets and current transfer receipts), net of the income taxes paid to the government. These charts include indicators of contraction to show periods of sustained decline in the data, as well as the indexes for real house prices and real personal disposable income in levels and growth rates. The corresponding interquartile range of the growth rates of all countries is added to illustrate the dispersion of the data across countries.
Charts 1A and 1B compare contraction periods of real house prices with downturns in real household disposable income.
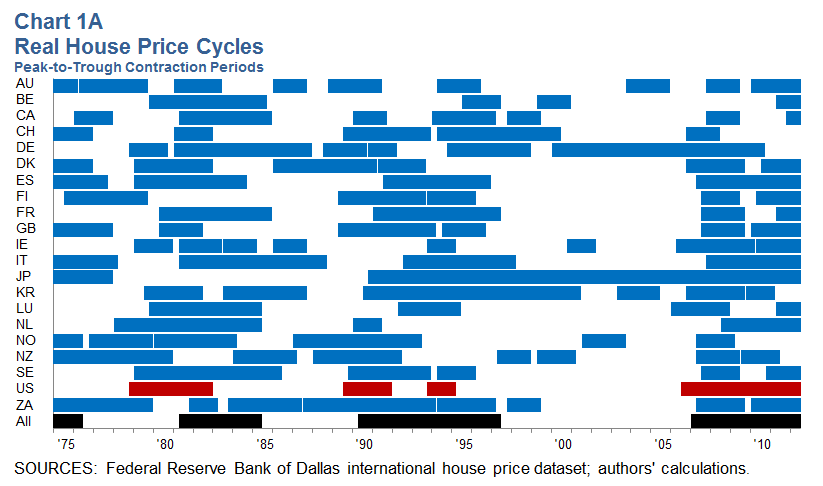
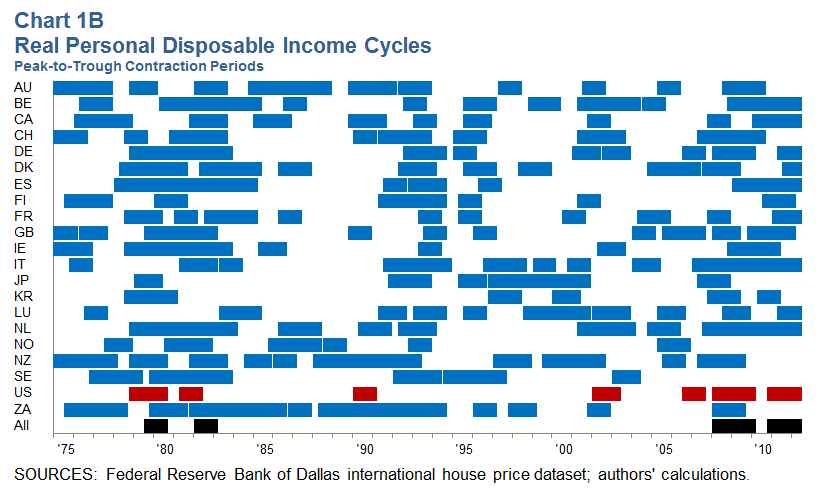
NOTE: Colored bars indicate contraction (peak to trough), determined using the Bry and Boschan (1971) classical cycle dating approach implemented in Harding and Pagan (2002). Black indicates contractions of the all-country aggregate; red, the U.S.; and blue, all other countries in the database. Restrictions are imposed to avoid spurious cycles, so each phase of expansion and contraction must last at least three quarters for real house prices and two quarters for real personal disposable income.
Charts 2A and 2B plot the index levels of real house prices and real personal disposable income for an aggregate of all countries included in the panel, an aggregate that excludes the U.S., and for the U.S. series itself.
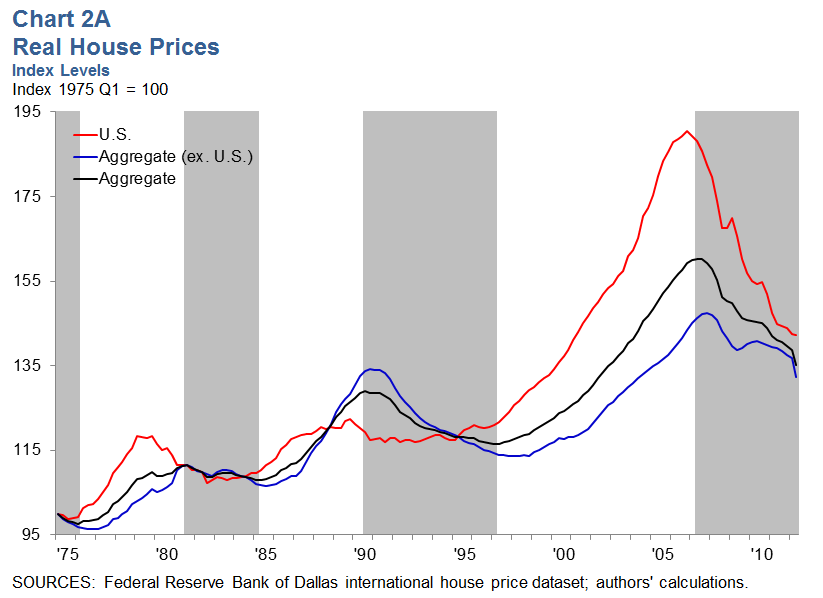
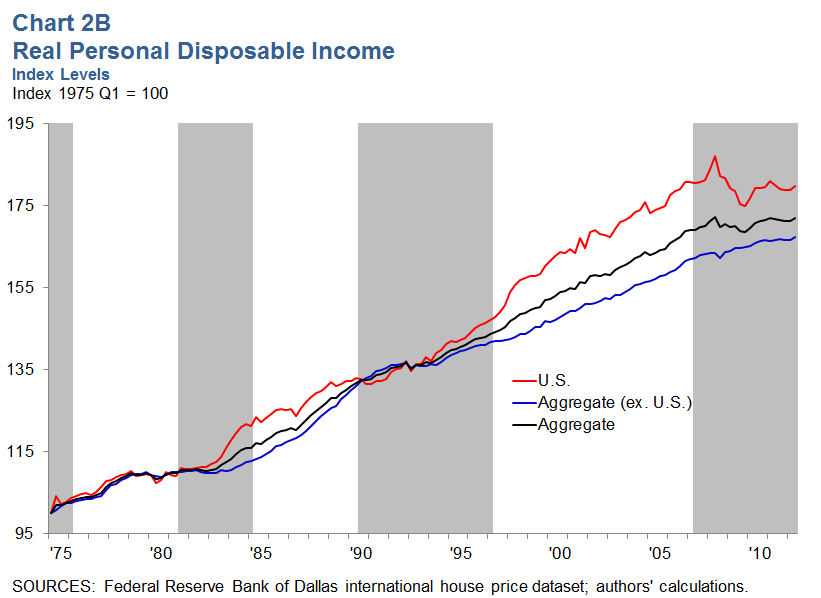
NOTE: Shaded areas indicate contraction (peak to trough) of the aggregate real house price index, determined using the Bry and Boschan (1971) classical cycle dating method implemented in Harding and Pagan (2002). Each phase of expansion and contraction must last at least three quarters for real house prices, to avoid spurious cycles.
Charts 3A and 3B plot the year-over-year growth rates of real house prices and real personal disposable income for an aggregate of all countries included in the panel, an aggregate that excludes the U.S., and for the U.S. series itself.
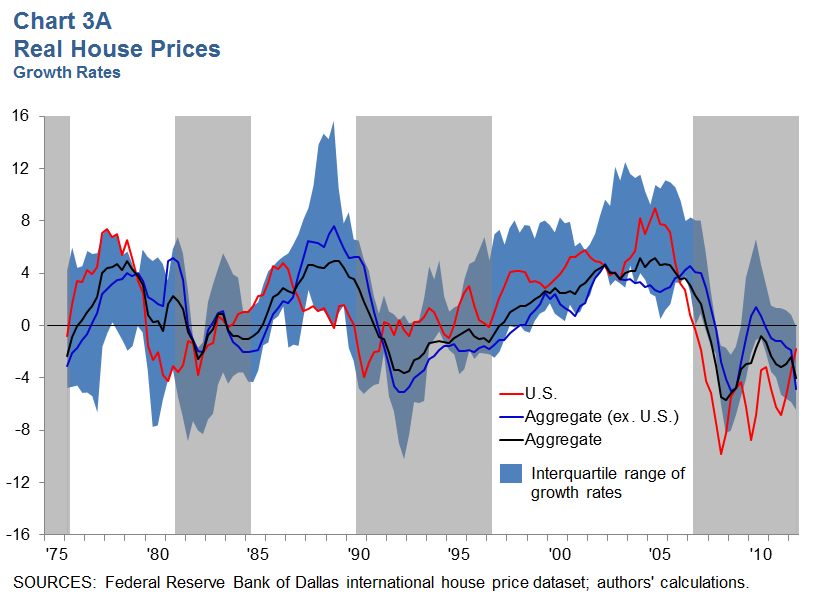
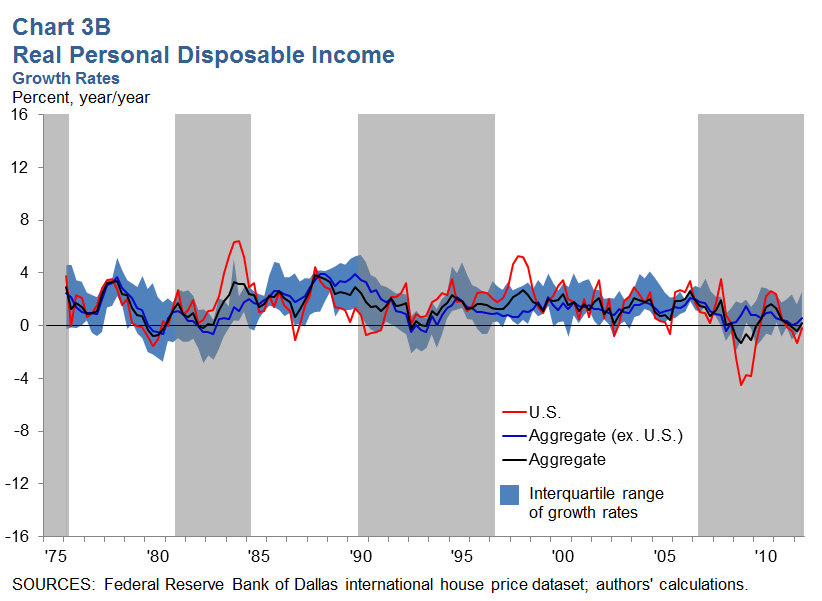
NOTE: Shaded areas indicate contraction (peak to trough) of the aggregate real house price index, determined using the Bry and Boschan (1971) classical cycle dating method implemented in Harding and Pagan (2002). Phases of expansion and contraction must last at least three quarters for real house prices, to avoid spurious cycles. The interquartile range refers to the difference between the upper and lower quartiles (the highest and lowest 25 percent) of the growth rates across all countries.
References
Bry, Gerhard and Charlotte Boschan (1971), "Cyclical Analysis of Time Series: Selected Procedures and Computer Programs," National Bureau of Economic Research Technical Paper 20. Harding, Don, and Adrian Pagan (2002), "Dissecting the Cycle: A Methodological Investigation," Journal of Monetary Economics 49 (2): 365–81.
Partners
The Federal Reserve Bank of Dallas’ Globalization Institute collaborates with a number of highly respected scholars and foreign institutions to research country-specific sources and datasets. We would like to acknowledge the contributions made by our international partners:
- University of Zagreb, Faculty of Economics and Business, Department of Macroeconomics and Economic Development
Founded in 1669, the University of Zagreb is a leading university in southeastern Europe with a strong program in economics. The department of macroeconomics and economic development within Economics and Business has a long-standing history in the study of macroeconomics and development with a special focus on Croatia. - Lancaster University, Management School, Department of Economics
The department of economics at Lancaster University in the U.K. has a strong research orientation, with interests spanning a wide area of theoretical and applied issues, including education economics, labor economics, industrial organization, international trade, macroeconomics, investment, finance, economic development, applications of nonlinear time series and business history. The Economics Department at Lancaster University Management School supports the UK Housing Market Observatory aimed at improving understanding of the national and regional price dynamics in the United Kingdom. - Bank of Israel, Research Department
The Bank of Israel, established in 1954, is the central bank of the state of Israel. The various departments in the bank, and in particular the research department, help the governor of the bank and the Monetary Committee in conducting monetary policy and in assessing the Israeli government's policy by monitoring and analyzing economic developments and by creating a research infrastructure for informed policy decisions. Research and economic analysis within the research department follows three routes: monitoring and analyzing current developments in the economy; initiating economic policy proposals in accordance with the changing needs of the economy; and conducting studies into various aspects of Israel's economy. The latter are published in the bank's discussion paper series and in Israel Economic Review, published jointly with the Israel Economic Association, and in other publications in Israel and abroad. - Jacques Friggit, Conseil Général de l’Environnement et du Développement Durable (CGEDD)
CGEDD provides its expertise on sustainable development and its evaluation services to different ministries and public authorities in France in the fields of infrastructure, transport, energy, housing, construction and land use planning, among others. Jacques Friggit works on housing at CGEDD, where he has contributed to developing historical house price series for France going as far back as the 13th century.
Data and Housing Resources
- Bank for International Settlements
- Organization for Economic Cooperation and Development
- Knight Frank
- Global Property Guide
- Global Housing Watch
Software
- Itamar Caspi (Bank of Israel)
For additional information, consult the methodology.
In what units are the HPI and PDI series reported?
The house price index (HPI) series is an index constructed with nominal house price data. The real house price index (RHPI) is an index calculated by deflating the nominal house price series with a country's personal consumption expenditure (PCE) deflator.
The personal disposable income (PDI) is an index constructed with nominal personal disposable income per capita, which is personal disposable income divided by a country’s working-age population. The real personal disposable income (RPDI) is an index calculated by deflating the nominal series with a country’s PCE deflator.
The underlying series for house prices and personal disposable income are quoted in the local currency (for example, the HPI and PDI series for Australia are quoted in Australian dollars).
For a summary of the reported units for each country’s HPI series, see Table B.2 in the methodology.
For a more detailed discussion on how to interpret an index series, see the DataBasics article "Indexing Data to a Common Starting Point."
Is it possible to obtain the un-indexed HPI and PDI series?
We are unable to provide data not currently included in the database. In some cases these data can be obtained directly from the national source. More details are provided in the country-specific information of the methodology.
Is it possible to obtain data starting before 1975?
We are unable to provide data not currently included in the database. In some cases these data can be obtained directly from the national source. More details are provided in the country-specific information of the methodology.
Is it possible to obtain data for other countries?
We are unable to provide data not currently included in the database. Links to house price data for other countries can be found in our external resources section.
What is the difference between the real and nominal series?
The RHPI and RPDI series are constructed by deflating the respective nominal series with a country's PCE deflator. For a more detailed discussion on deflation, see the DataBasics article "Deflating Nominal Values to Real Values."
Why is the PCE deflator instead of the CPI used to construct the real series?
We report indexes for house prices and PDI per capita in real terms using the PCE deflator in the calculations. In the U.S., the PCE has a broader scope than the CPI because it captures the expenditures of both rural and urban consumers. PCE includes expenditures that are not counted in the CPI (like medical and health care expenses paid by employers and other federal programs) and gives different importance to the different categories of expenditure (for instance, PCE gives less weight to housing than the CPI does). Furthermore, weights of CPI components change infrequently (every two years) while the PCE rebalances its weights quarterly, reflecting the shifting spending habits of consumers. For all these reasons, we choose to report the real series for the U.S. based on the PCE deflator and do the same for all other countries to maintain the consistency of the panel across countries. Since nominal series are reported as well as real series, alternative real indexes based on the CPI or other measures of prices and the cost of living can be easily derived with the available data.
How does your benchmark HPI series, the U.S. Federal Housing Finance Agency (FHFA) HPI, differ from the S&P/Case-Shiller Home Price Index?
a. The S&P/Case-Shiller index is constructed using only purchase prices; the FHFA HPI also includes refinance appraisals.
b. The FHFA index measures house prices using data on conforming, conventional mortgages provided by Fannie Mae and Freddie Mac. The S&P/Case-Shiller index uses information obtained from county assessor and recorder offices, which includes conforming and nonconforming mortgages.
c. The S&P/Case-Shiller index is value-weighted, so more expensive homes have a greater influence on estimated price changes. The FHFA index weights price trends equally for all properties.
d. The S&P/Case-Shiller index does not have valuation data from 13 states. The FHFA index is calculated using data from all states.
Adapted from the FHFA's "Housing Price Index Frequently Asked Questions."
What are exuberance indicators, and how should they be interpreted?
We compute the exuberance indicators from the recently developed recursive (right-tailed) unit root tests of Yale economist Peter C. B. Phillips and his co-authors called Supremum Augmented Dickey Fuller (SADF) and Generalized SADF (GSADF). A detailed discussion of these statistics and a novel extension to panel data that we propose applied to the international house price database can be found here: "Episodes of Exuberance in Housing Markets: In Search of the Smoking Gun," (Efthymios Pavlidis, Alisa Yusupova, Ivan Paya, David Peel, Enrique Martínez-García, Adrienne Mack and Valerie Grossman).
We employ these indicators to detect and date periods of ‘exuberance’ during which the time series of house prices (or, whenever available, conventional house-price-to-fundamentals ratios) displays explosive behavior by finding and dating breaks within sample. Exuberant or explosive price behavior may occur when house prices are not based on housing market fundamentals, so these exuberance indicators provide useful information for the detection of emerging misalignments and for monitoring housing. Detecting such periods is important due to the fact that, historically, rapid price increases have been followed by large corrections, which have severe consequences for the real economy—the most notable example being the global boom-bust episode of the 2000s.
Is it possible to download the data directly from the website into commonly used statistical packages?
We are unable to provide assistance for each particular software. The software provider may have already developed the option that allows it, so more information can be obtained directly from them. However, we can suggest a few command lines that we’ve found useful for E-views and Stata.
- For example: To download the series from the file hp1404.xlsx corresponding to the release for the fourth quarter of 2014, from the tab HPI, use the following command lines:
- E-Views
%webaddress = "http://www.dallasfed.org/~/media/documents/research/international/houseprice/hp1404.xlsx"
wfopen(page=HPI) {%webaddress} range="HPI" colhead=2, namepos=first - Stata
import excel http://www.dallasfed.org/~/media/documents/research/international/houseprice/hp1404.xlsx, sheet("HPI") clear firstrow
drop in 1/1
drop Y - SAS
filename in "C:\hp1404.xlsx";
proc http method="get" out=in
url="http://www.dallasfed.org/~/media/documents/research/international/houseprice/hp1404.xlsx"; run; - R
The package gdata uses some Perl libraries. While Perl is usually installed in Linux and Mac platforms, Windows platforms may require you to install Perl.
require(gdata)
df = read.xls("http://www.dallasfed.org/~/media/documents/research/international/houseprice/hp1404.xlsx", sheet = "HPI", header = TRUE) - Matlab
fname = 'hp1404.xlsx';
url = 'http://www.dallasfed.org/~/media/documents/research/international/houseprice/hp1404.xlsx';
[fname, success] = urlwrite(url,fname);
ImportIHPD : This Matlab program downloads data from the International House Price Database (IHPD) website and places it into a Matlab struct variable available for use. Illustrative examples of how to use this program are also provided with the code.
- E-Views
Contact Information
For questions, comments or suggestions about the data or the webpage, please contact the authors at:
Lauren Spits: lauren.spits@dal.frb.org
Enrique Martínez-García: enrique.martinez-garcia@dal.frb.org
Valerie Grossman: valerie.grossman@dal.frb.org