Texas Economic Indicators

| Texas economy dashboard (February 2024) | |||
| Job growth (annualized) Nov. '23–Feb. '24 |
Unemployment rate |
Avg. hourly earnings |
Avg. hourly earnings growth y/y |
| 2.8% | 3.9% | $32.45 | 4.6% |
The Texas economy expanded strongly in February. Payroll growth strengthened and the unemployment rate remained flat for the ninth straight month, while labor force growth slowed. The March Texas Business Outlook Surveys (TBOS) indicated modest expansion in the service sector and a slight contraction in manufacturing activity. Home sales increased in February despite mortgage rates remaining high, while sales tax revenue dipped.
Labor market
Job gains accelerate in February
Texas employment expanded 4.3 percent in February, above the nation’s 2.1 percent gains, and higher than January’s 1.9 percent growth (Chart 1). Job gains were largely widespread, outpacing the U.S. in all sectors but trade, transportation and utilities, and oil and gas. Texas’ strongest gains were in professional and business services, leisure and hospitality, manufacturing and financial activities—all grew more than 6.0 percent.

Unemployment stable
The Texas unemployment rate held steady at 3.9 percent in February, while the U.S. jobless rate ticked up to 3.9 percent (Chart 2). Texas’ unemployment rates were 2.9 percent for whites, 4.5 percent for Hispanics and 5.8 percent for Blacks. Among the state’s metros, Midland had the lowest unemployment rate at 2.6 percent.

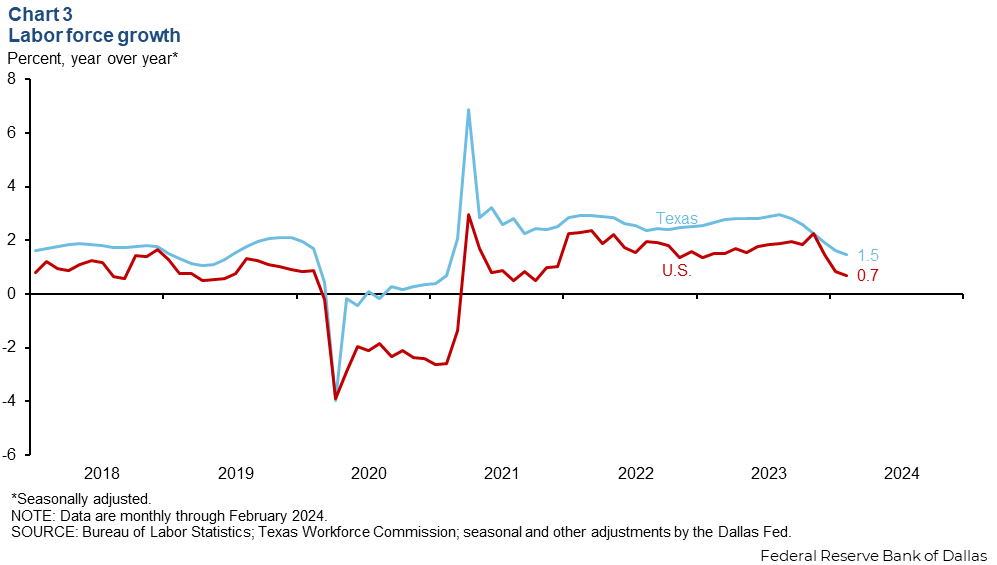
Labor force growth moderates
In February, the Texas labor force grew 2.1 percent, while the nation saw a 1.1 percent increase. The 12-month growth rate has been slowing rapidly since August 2023 in Texas, though it remained positive at 1.5 percent—exceeding the nation’s 0.7 percent growth (Chart 3).
Texas Business Outlook Surveys
The March Texas Business Outlook Surveys reported a weakening in manufacturing output but continued modest expansion in service sector activity (Chart 4). The manufacturing output index dipped to -4.1 following a near-zero reading last month. The service sector revenue index decreased 1.2 points to 4.0. Both indexes were below their series averages. Outlooks were flat in the service sector but remained pessimistic in manufacturing.

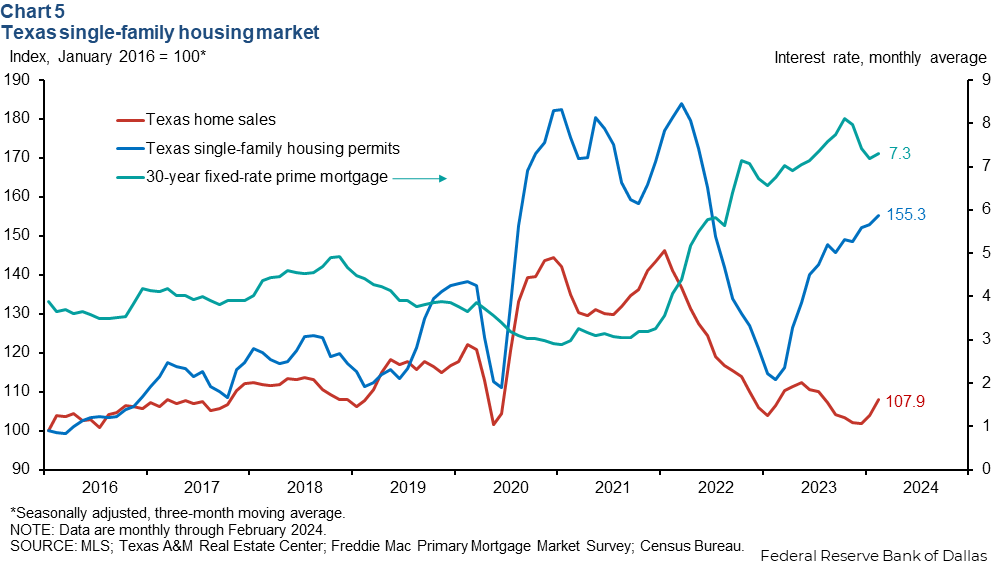
Housing
Texas existing-home sales rose in February, despite high mortgage rates (Chart 5). Texas home sales increased 4.0 percent, and U.S. home sales rose sharply as well. Mortgage rates remained elevated—averaging 7.3 percent in February—and continued to impact housing affordability. Texas single-family housing construction permits increased 2.2 percent in February. Inventories in Texas rose to 4.0 months of supply, their highest level since January 2014.
Sales tax collections
Texas retail sales tax collections decreased to $4.9 billion in February (Chart 6). Statewide sales tax collection was 4.4 percent below its peak of $5.1 billion reached in June 2023. Compared with February 2023, real retail sales tax collections were down 2.4 percent, reflective of slowing consumer spending.

NOTE: Data may not match previously published numbers due to revisions.
About Texas Economic Indicators
Questions or suggestions can be addressed to Diego Morales-Burnett at diego.morales-burnett@dal.frb.org. Texas Economic Indicators is published every month during the week after state and metro employment data are released.