Revisiting the odd behavior of the Beveridge curve as unemployment stays low
At first glance, it seems unlikely that the unemployment rate would remain stable if the number of job vacancies decreased.
However, such a scenario played out recently as the number of firms seeking to fill positions by poaching employees from other firms increased, while the ranks of the unemployed remained relatively stable. This development could ultimately affect how policymakers use their toolkit to manage interest rates and could signal an era of softer economic landings at the conclusion of monetary tightening cycles.
I noted the unusual behavior of the unemployment and job vacancy rates following the 2020 COVID-19 recession in a Dallas Fed Economics article in November 2022.
I also introduced a dual vacancy model to explain this phenomenon. The model suggested that a rise in vacancies was primarily due to the job openings aimed at enticing workers to leave their current jobs—what we referred to as “poaching vacancies.” Other vacancies come and go with economic expansion and contraction.
Job poaching trend explored
New data provides insights into the job poaching trend, its possible causes and potential impacts on the job market (Chart 1).
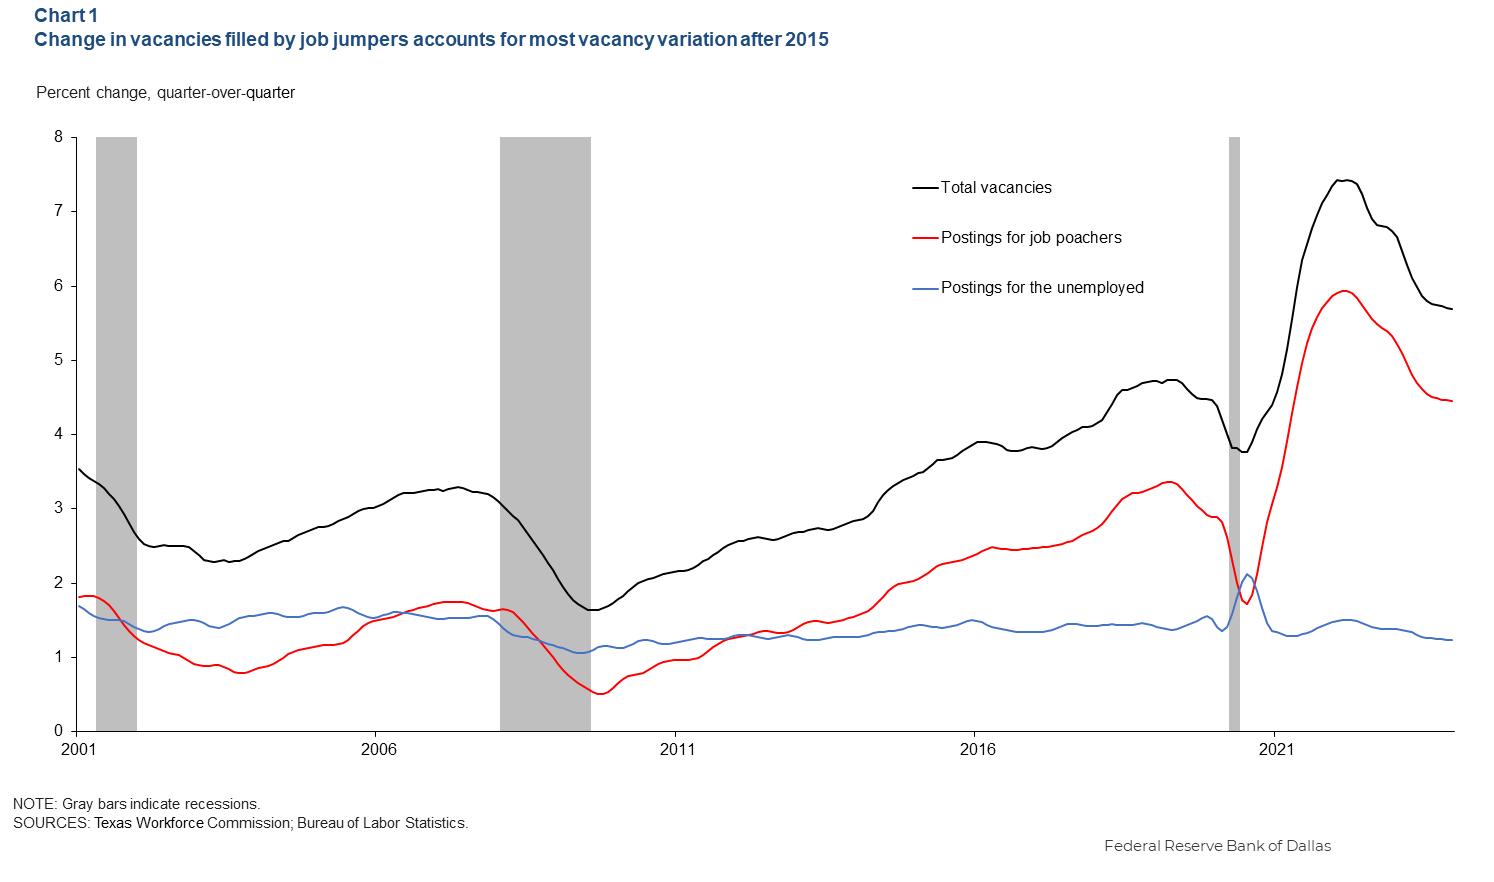
The data reveal that a decrease in job openings primarily reflects a reduction in vacancies meant for poaching employees. Thus, diminished job postings involve those already employed, with unemployment rates minimally rising.
The notion that the number of unemployed individuals normally moves in the opposite direction to the number of available jobs is depicted in the Beveridge curve. Economist William Beveridge observed that during booms, the number of jobs increases and unemployment declines, while the opposite movement occurs in recessions.
In an update of “The Dual Beveridge Curve,” co-author Paulina Restrepo-Echavarria of the Federal Reserve Bank of St. Louis and I propose a more detailed model that enhances our understanding of the factors influencing these trends.
The model draws on three main factors, which include reduced job turnover due to a long-run decrease in labor market dynamism—specifically, declining internal migration and new firm creation. Other primary factors are stable profitability of traditional vacancies and a surge in the profitability of vacancies aimed at poaching. In other words, among poaching firms, the additional profits from stealing an experienced worker have increased or it has become less costly to swipe a worker.
Looking at the data through the lens of the model suggests the modest decrease in labor market dynamism accounts for a gradual decline in unemployment and job vacancies for those out of work, whereas the growth in vacancies for poaching is driven solely by the higher profitability of such hiring from the firms’ point of view.
Contours of Beveridge curve change
Considering trend growth in poaching vacancies before the COVID-19 recession (March–April 2020), the Beveridge curve has shifted significantly. This curve has not only moved outward but also become steeper (Chart 2). The curves corresponding to 2007 and 2019 are plotted showing the positions of the Beveridge curve at the two prerecession peaks, commonly used as benchmarks.

The Beveridge curve has steepened from -1 to at least -1.25 and possibly to a coefficient of -1.4, if we consider more recent developments. This implies a decline in the vacancy rate from 7 percent to 5 percent should correspond to an increase in the unemployment rate from 3.5 percent to at most 4.6 percent, and possibly even 4.4 percent. That compares with an increase all the way to a 4.9 percent unemployment rate 20 years ago. The outward movement of the Beveridge curve suggests coexistence of the recent 6 percent vacancy rate—rather than 4 percent, which was previously considered standard—with a new, normal 4 percent natural unemployment rate.
One lesson from our exercise is that instead of looking at the classic Beveridge curve and interpreting its increasingly chaotic movements, we should shift our attention to an adjusted Beveridge curve, which excludes poaching vacancies. It is unlikely to change as much and will, therefore, remain a good indicator of the state of labor market.
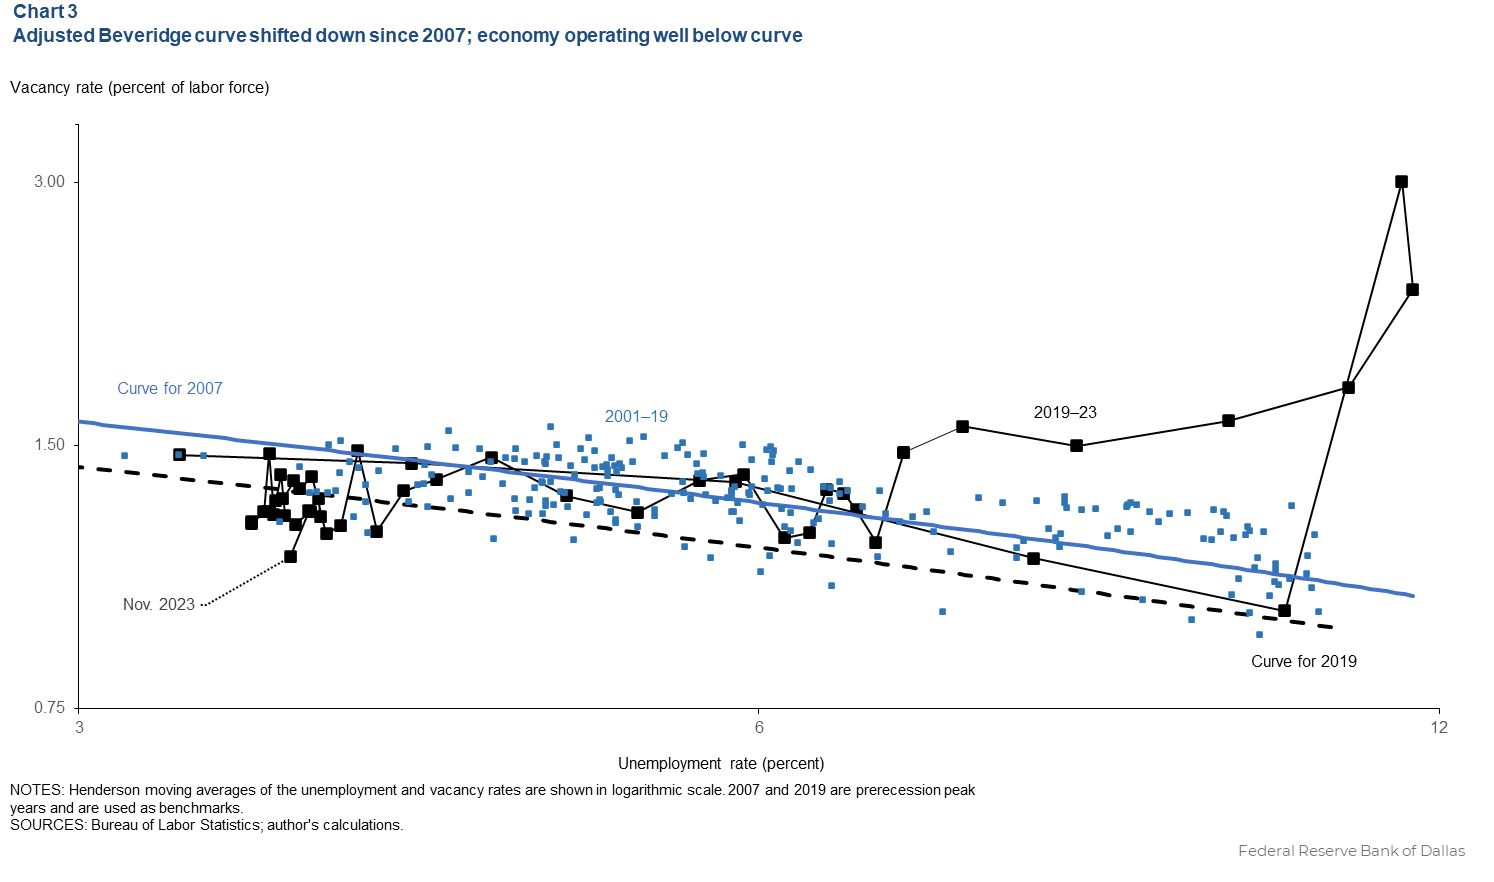
The adjusted Beveridge curve shifted down only slightly due to reduced labor market dynamism. The most recent value of vacancies relative to the jobless rate, in November 2023, is well below the curve, strongly suggesting that a future increase in the unemployment rate is necessary to remain consistent with the curve.
Higher future unemployment possible
Recent data compared with 2019 suggest the decline in job vacancies without a corresponding increase in unemployment may not last and unemployment rates could rise soon.
The future behavior of the Beveridge curve and the ongoing expansion in vacancies aimed at poaching will depend on factors that either lower the costs of filling these vacancies or increase employers’ benefits of filling poaching vacancies. These factors include technological advancements in online job searching and artificial intelligence, the rise of temporary and remote work opportunities and expansion of the online gig economy. On the other side, employers’ increased market dominance and their growing monopsony power may further drive this trend.
Taken together, these developments imply labor market softening in the 2020s will lead to a significant drop in job openings but only a slight increase in unemployment. That is, softer landings may become the new normal. This suggests various policy instruments might have limited impact on traditional vacancy and unemployment rates, with poaching vacancies absorbing much of the change.
About the author

Anton Cheremukhin is a principal research economist in the Research Department at the Federal Reserve Bank of Dallas.
The views expressed are those of the author and should not be attributed to the Federal Reserve Bank of Dallas or the Federal Reserve System.